Copyright
©The Author(s) 2020.
World J Gastroenterol. Dec 21, 2020; 26(47): 7528-7537
Published online Dec 21, 2020. doi: 10.3748/wjg.v26.i47.7528
Published online Dec 21, 2020. doi: 10.3748/wjg.v26.i47.7528
Figure 1 Flowchart reporting the process of patients selection.
IBD: Inflammatory bowel disease.
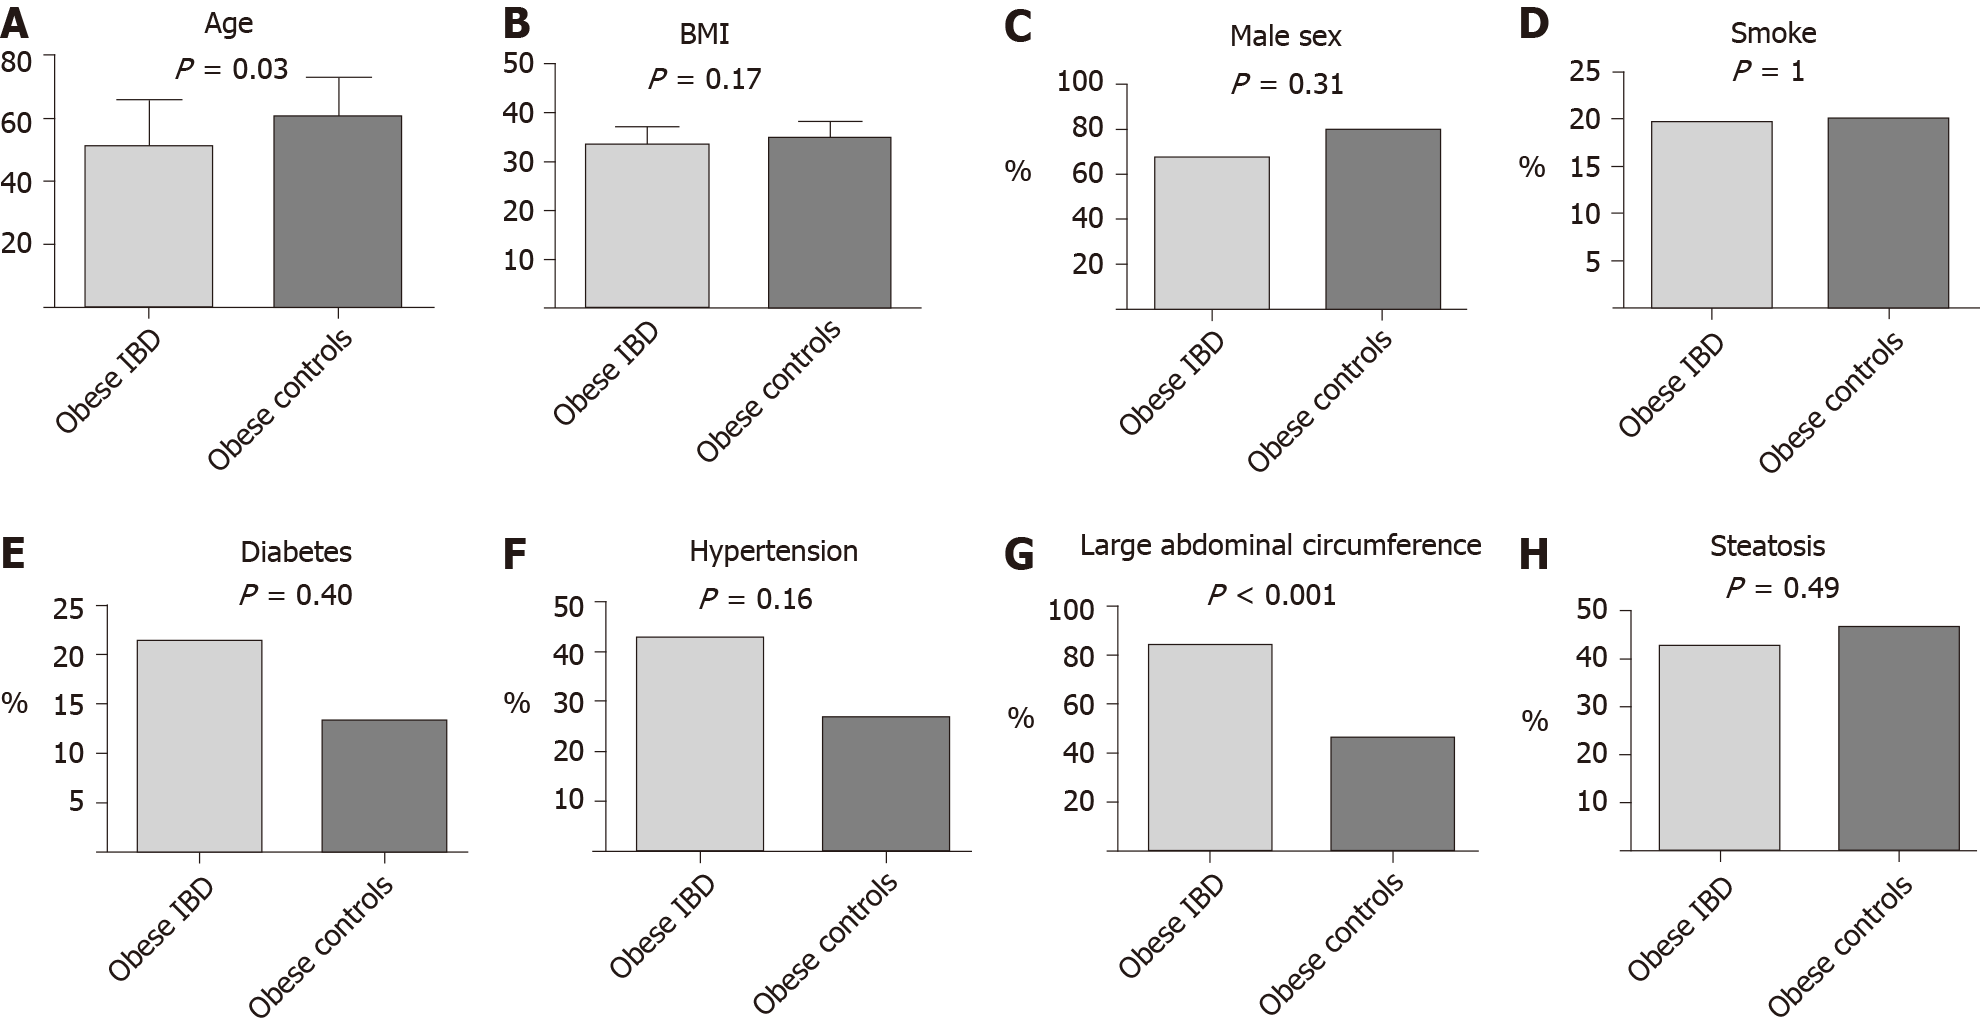
Figure 2 Comparison between obese inflammatory bowel disease and controls.
A: Age; B: Body mass index; C: Sex; D: Smoking habits; E: Diabetes; F: Hypertension; G: Abdominal circumference > 102 in males and > 88 in females; H: Liver steatosis. BMI: Body mass index.
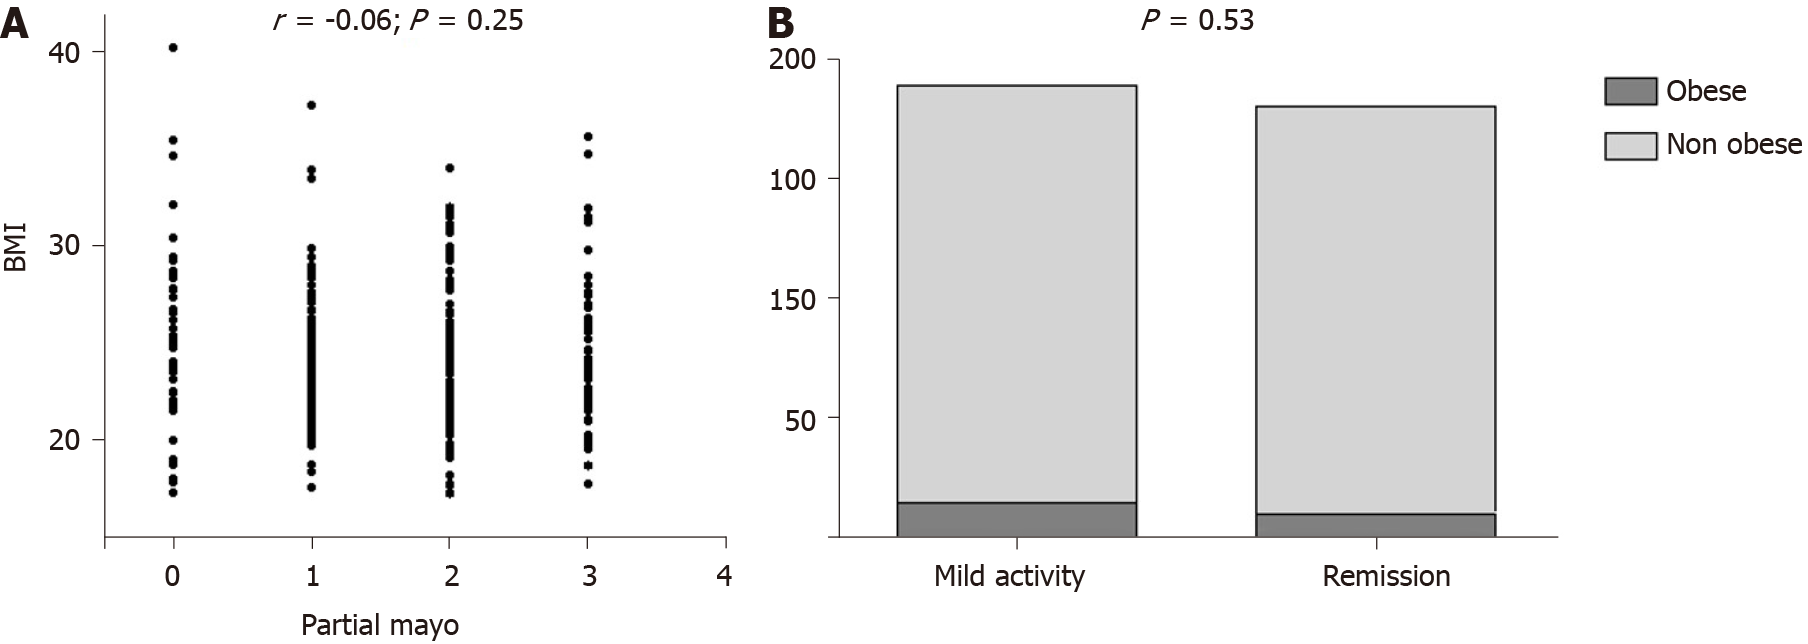
Figure 3 Correlation between ulcerative colitis clinical activity and body mass index.
A: Scatterplot of body mass index and partial Mayo scores; B: Distribution of activity phase according to obesity status. BMI: Body mass index.
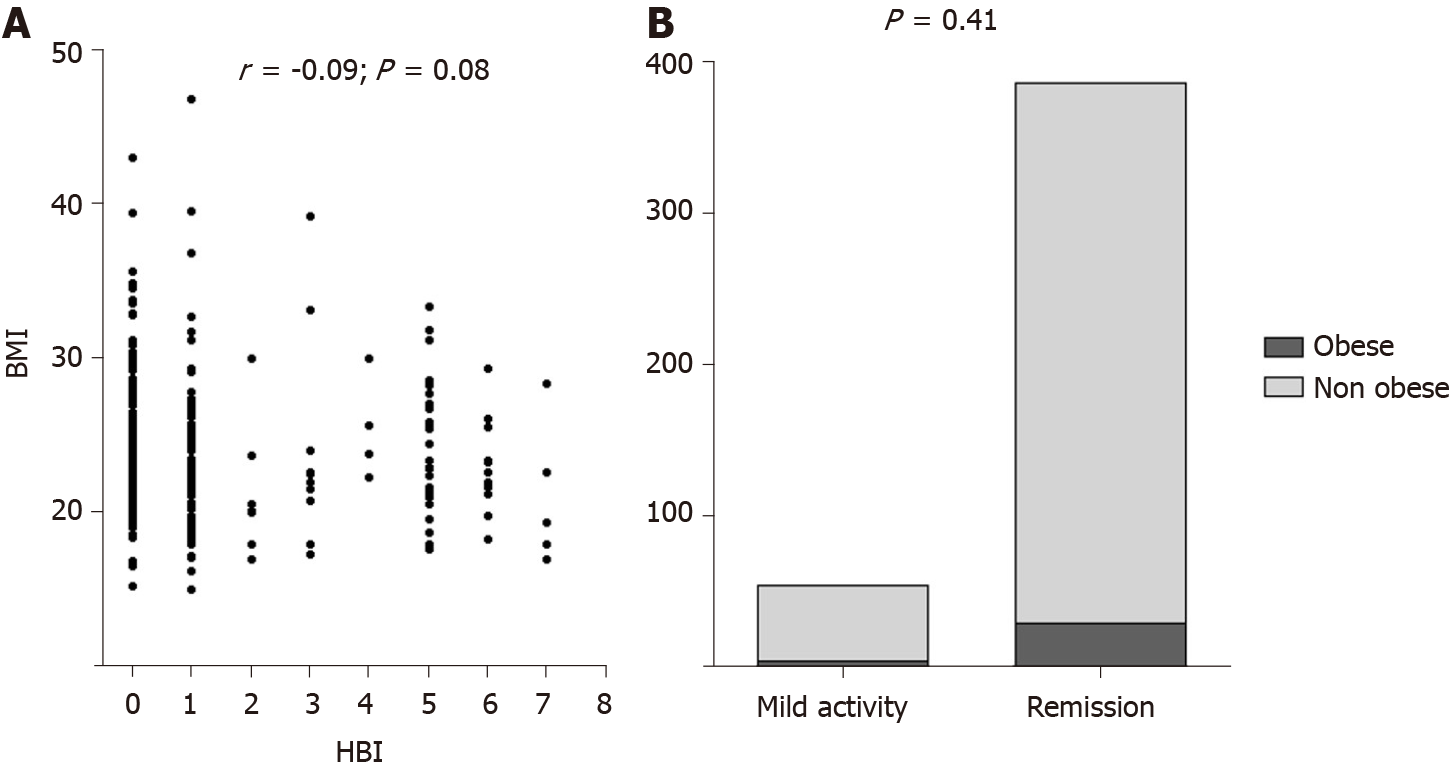
Figure 4 Correlation between Crohn’s disease clinical activity and body mass index.
A: Scatterplot of body mass index and Harvey-Bradshaw index scores; B: Distribution of activity phase according to obesity status. BMI: Body mass index; HBI: Harvey-Bradshaw index.
- Citation: Losurdo G, La Fortezza RF, Iannone A, Contaldo A, Barone M, Ierardi E, Di Leo A, Principi M. Prevalence and associated factors of obesity in inflammatory bowel disease: A case-control study. World J Gastroenterol 2020; 26(47): 7528-7537
- URL: https://www.wjgnet.com/1007-9327/full/v26/i47/7528.htm
- DOI: https://dx.doi.org/10.3748/wjg.v26.i47.7528


