Copyright
©The Author(s) 2020.
World J Gastroenterol. Dec 14, 2020; 26(46): 7338-7351
Published online Dec 14, 2020. doi: 10.3748/wjg.v26.i46.7338
Published online Dec 14, 2020. doi: 10.3748/wjg.v26.i46.7338
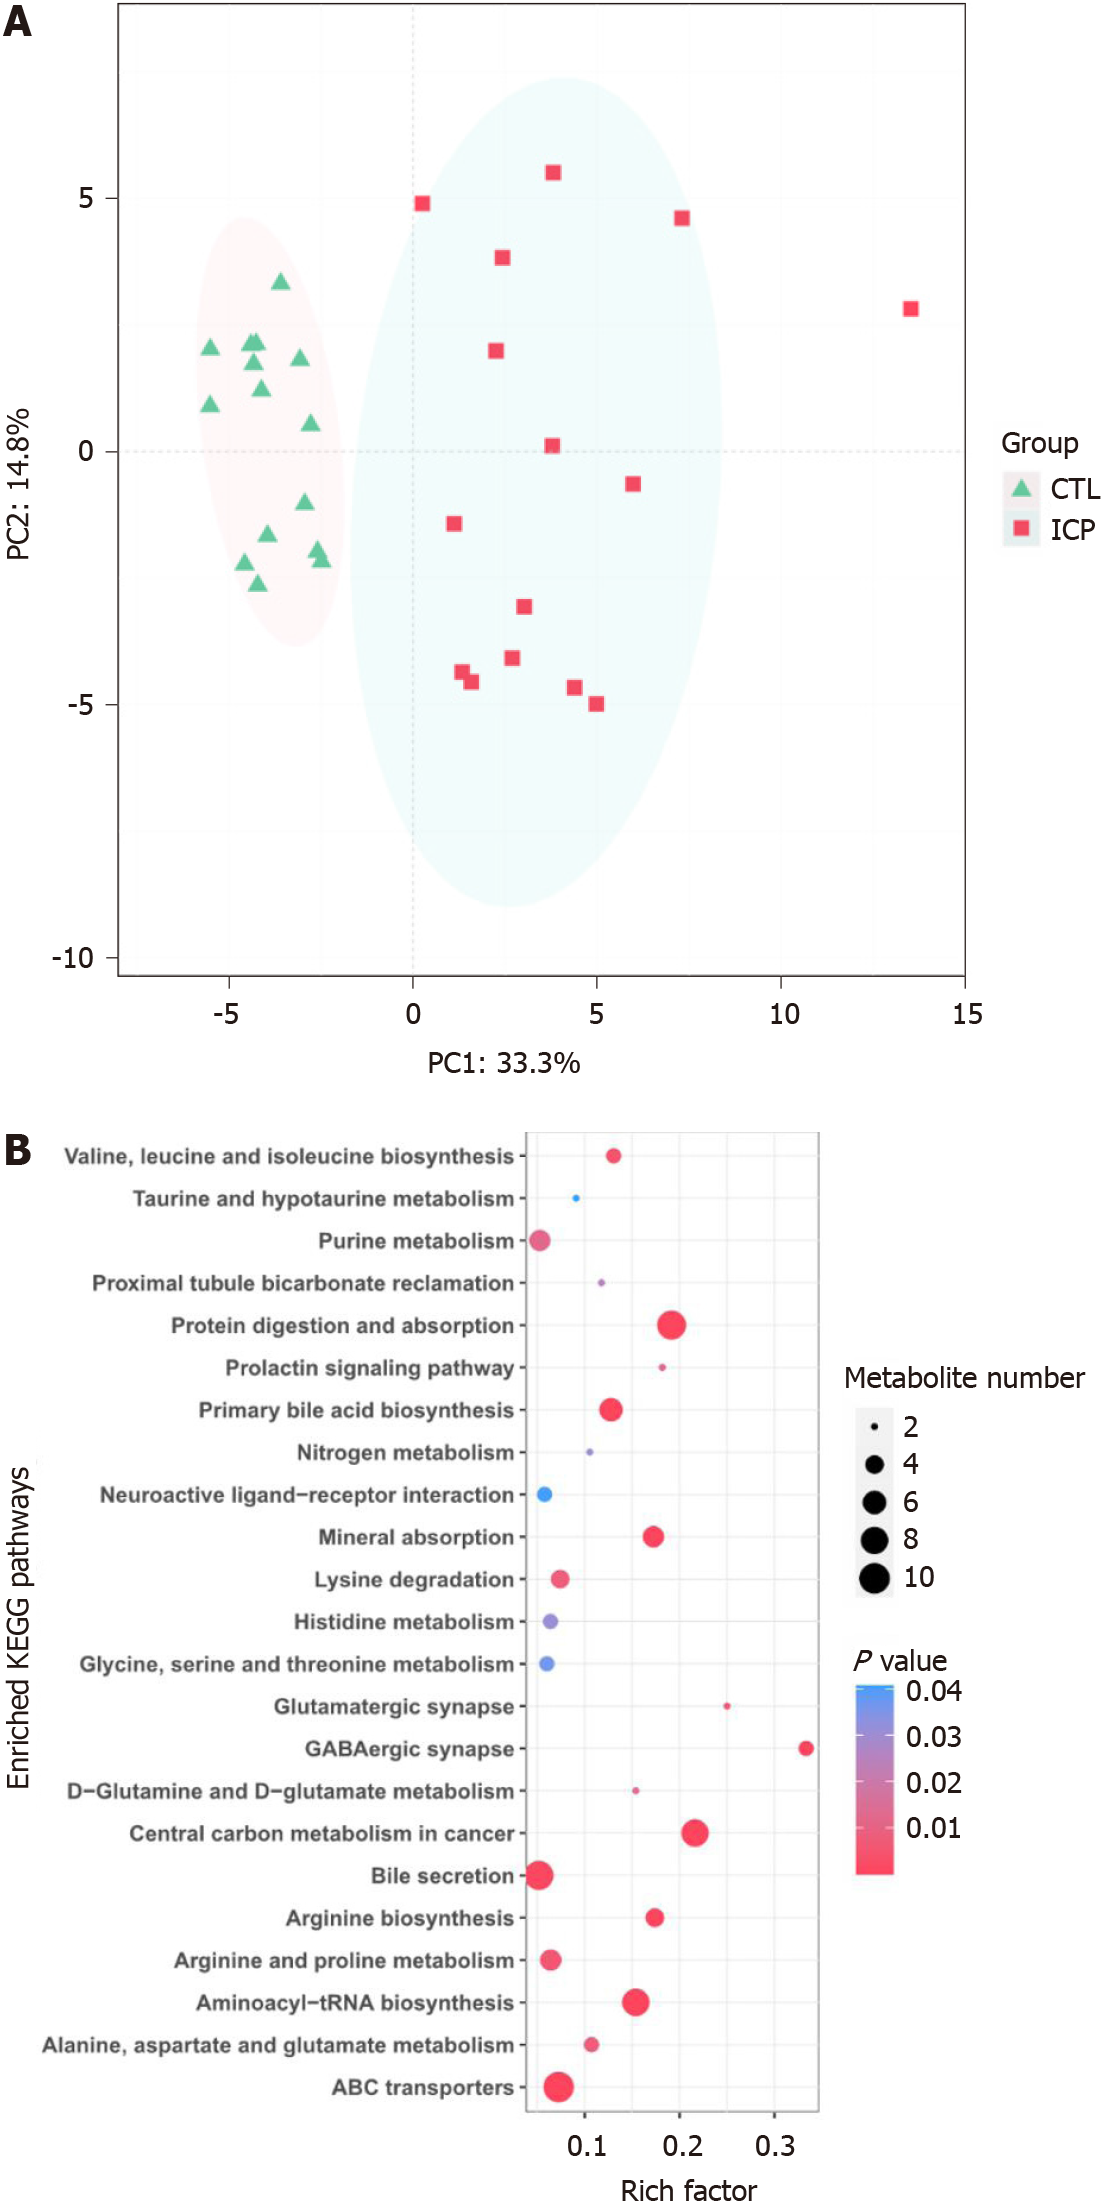
Figure 1 Distinct serum microbiome feature associated with intrahepatic cholestasis in pregnancy patients.
A: Bray-Curtis principal analysis of metabolites shows significant differences between intrahepatic cholestasis in pregnancy and healthy controls; B: Kyoto Encyclopedia of Genes and Genomes pathway enrichment analysis of metabolites identified in this study. The metabolites identified were subjected to a pathway enrichment analysis using the Kyoto Encyclopedia of Genes and Genomes database. Only significantly enriched Kyoto Encyclopedia of Genes and Genomes functional categories (P < 0.05) are depicted according to their P-values. CTL: Control; ICP: Intrahepatic cholestasis in pregnancy; KEGG: Kyoto Encyclopedia of Genes and Genomes.
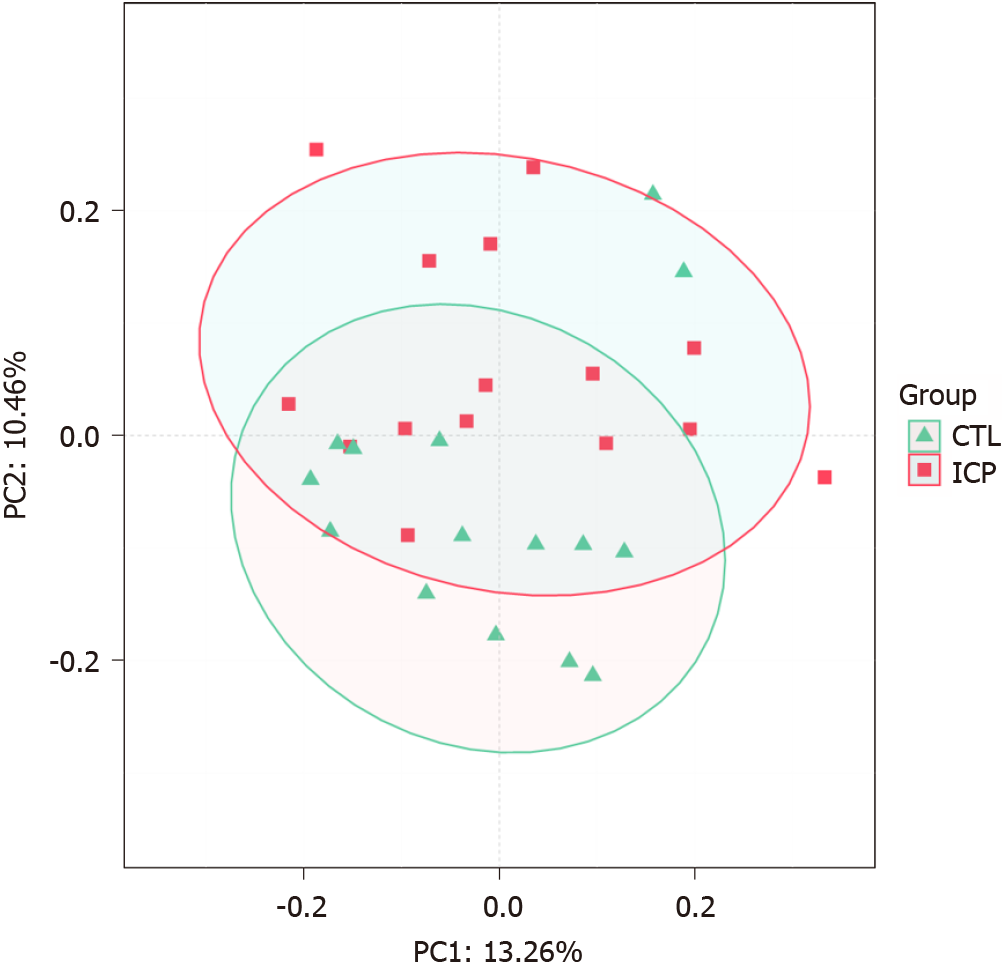
Figure 2 Distinct gut microbiota feature associated with intrahepatic cholestasis in pregnancy patients.
Principal coordinate analysis score plot based on Bray-Curtis distance at the phylum level. CTL: Control; ICP: Intrahepatic cholestasis in pregnancy.
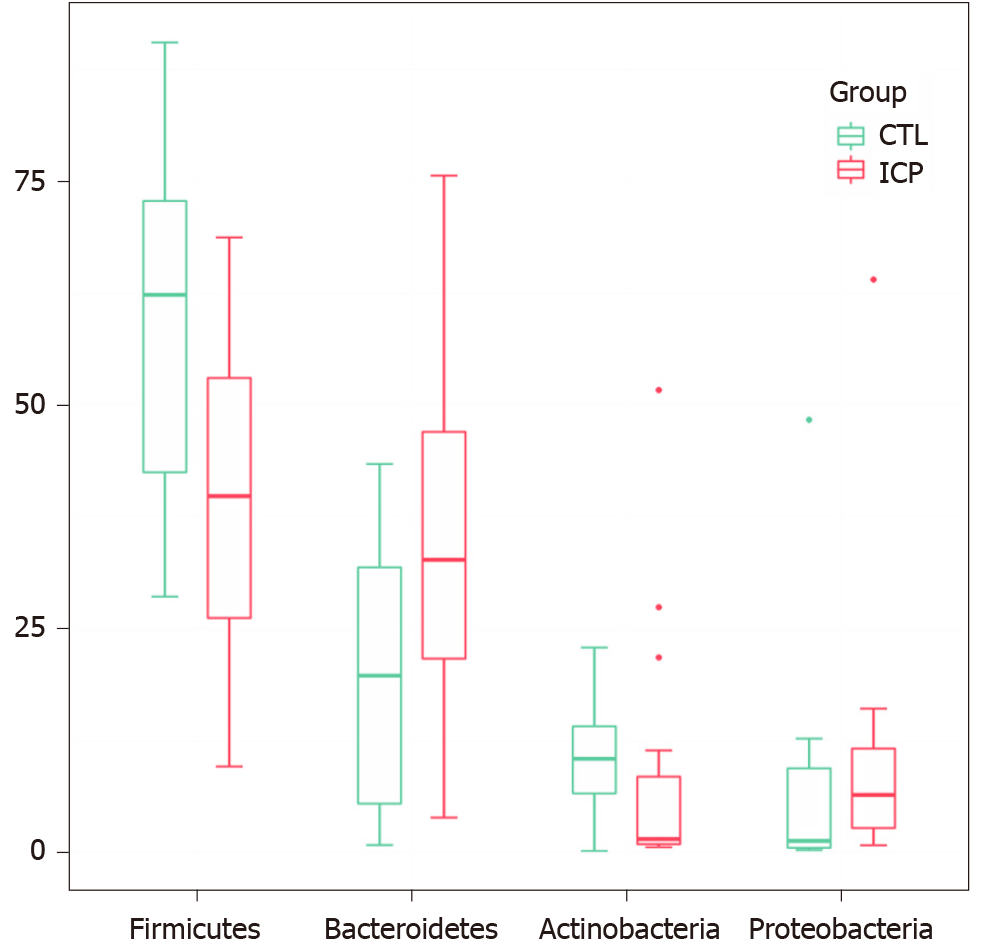
Figure 3 Changes of gut microbiota at the phylum level between intrahepatic cholestasis in pregnancy and healthy groups.
Box plots show the relative abundance of the main phylum in microbiota. The center line denotes the median. Points outside the whiskers represent outlier samples. CTL: Control; ICP: Intrahepatic cholestasis in pregnancy.
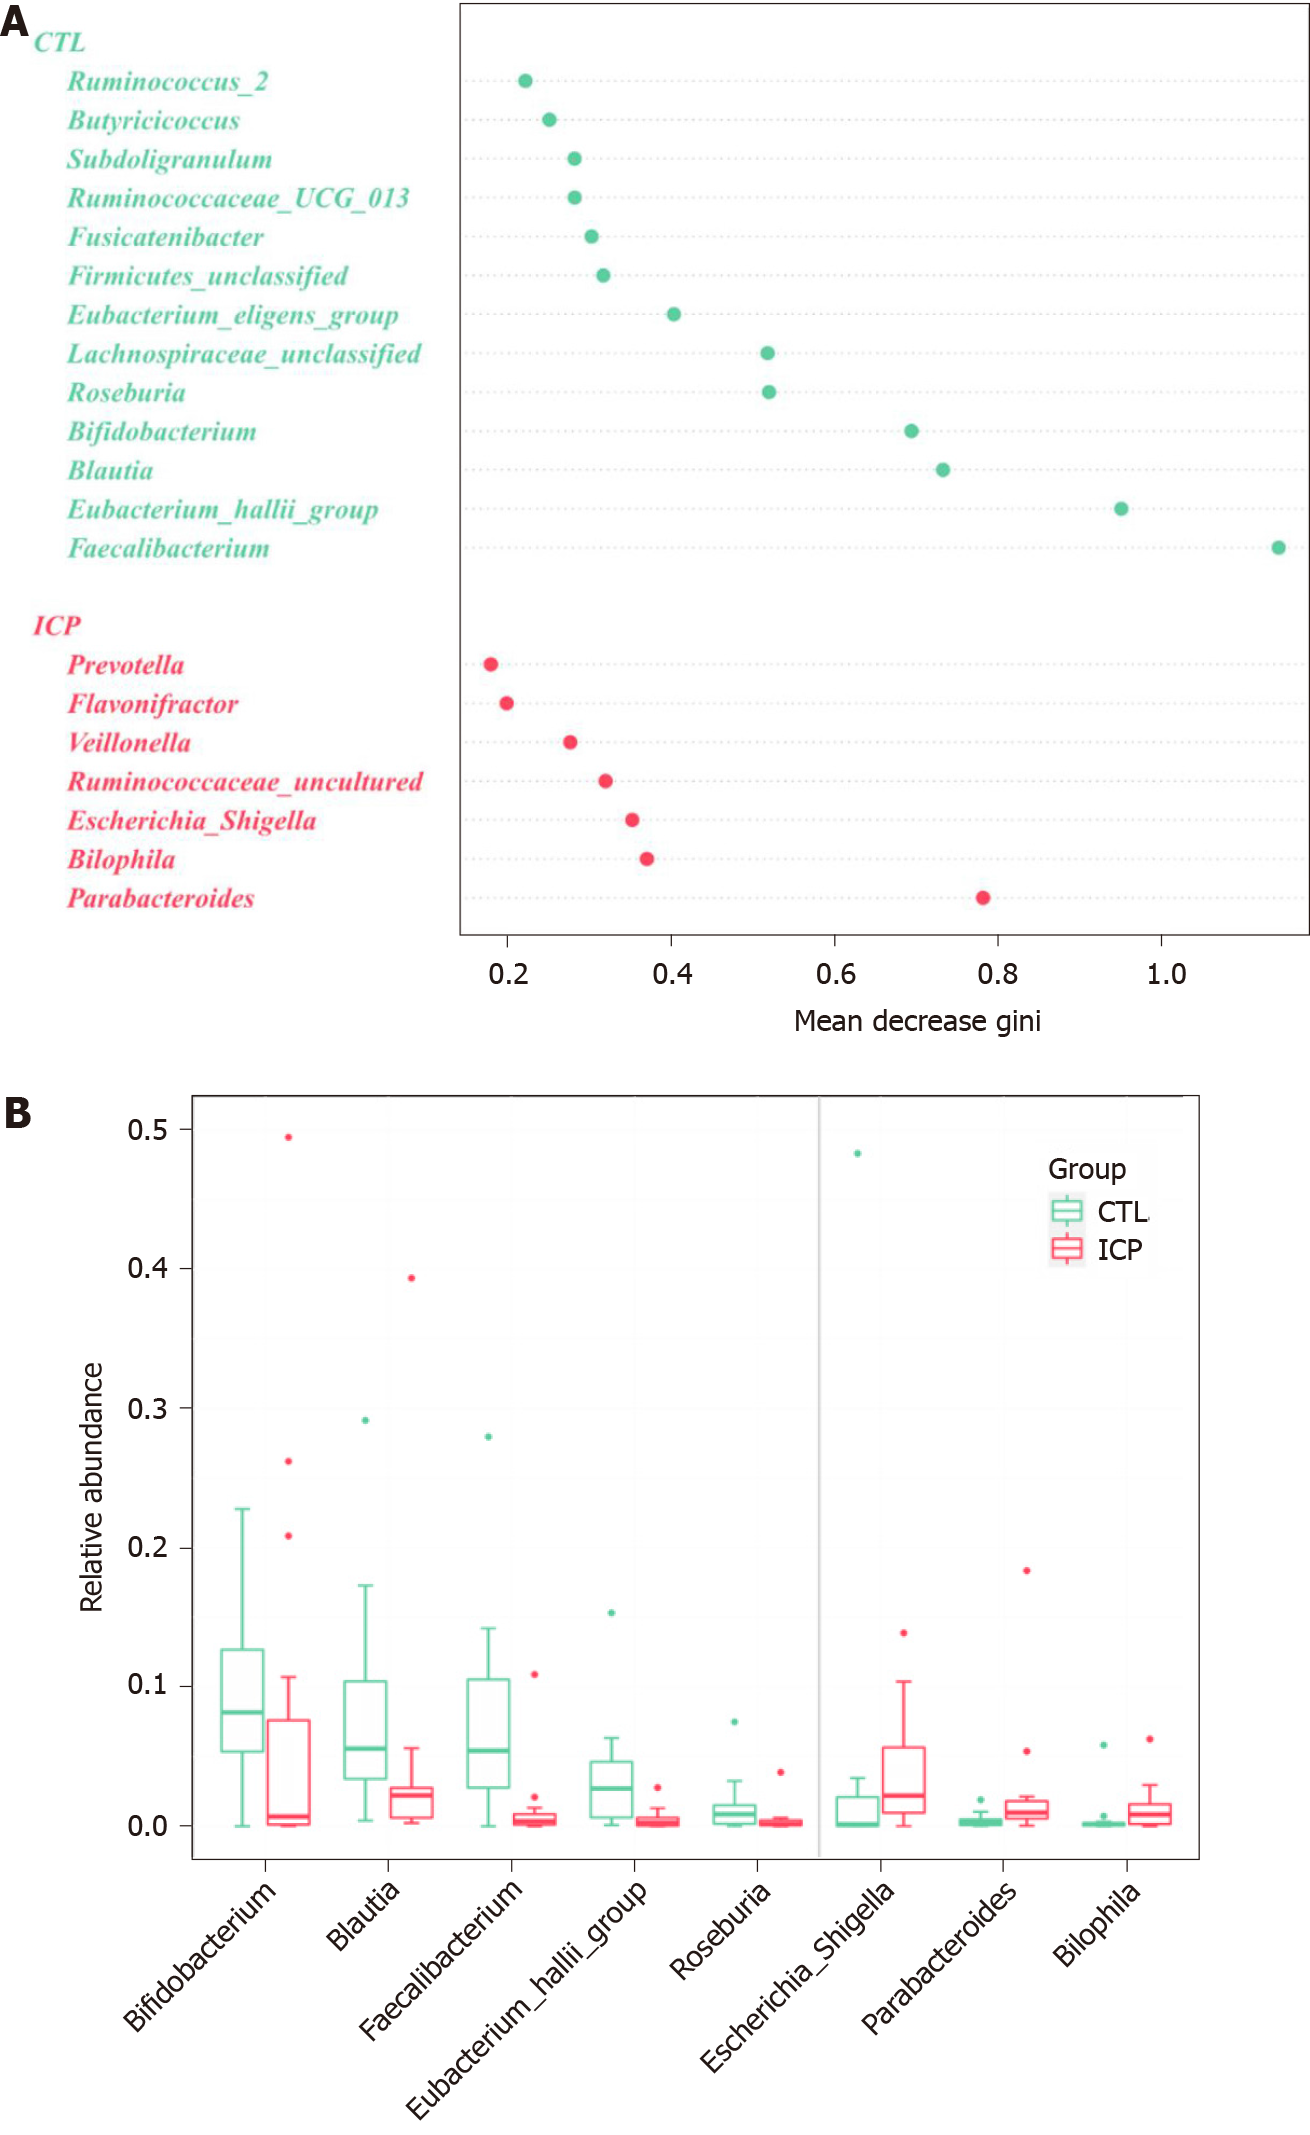
Figure 4 Genera important for differentiating intrahepatic cholestasis in pregnancy and healthy control were identified using random Forest package.
A: The ranking of genera according to mean decrease gini were obtained from the random forest algorithm using default parameters. Genera with differences in abundance between the two cohorts are shown in red (intrahepatic cholestasis in pregnancy enriched) and green (control enriched); B: Comparison of the relative abundances of the main different genera of the gut microbiota in the two groups. Box plots show the abundance of the main difference genera in microbiota. The center lines the median. Points outside the whiskers represent outlier samples.
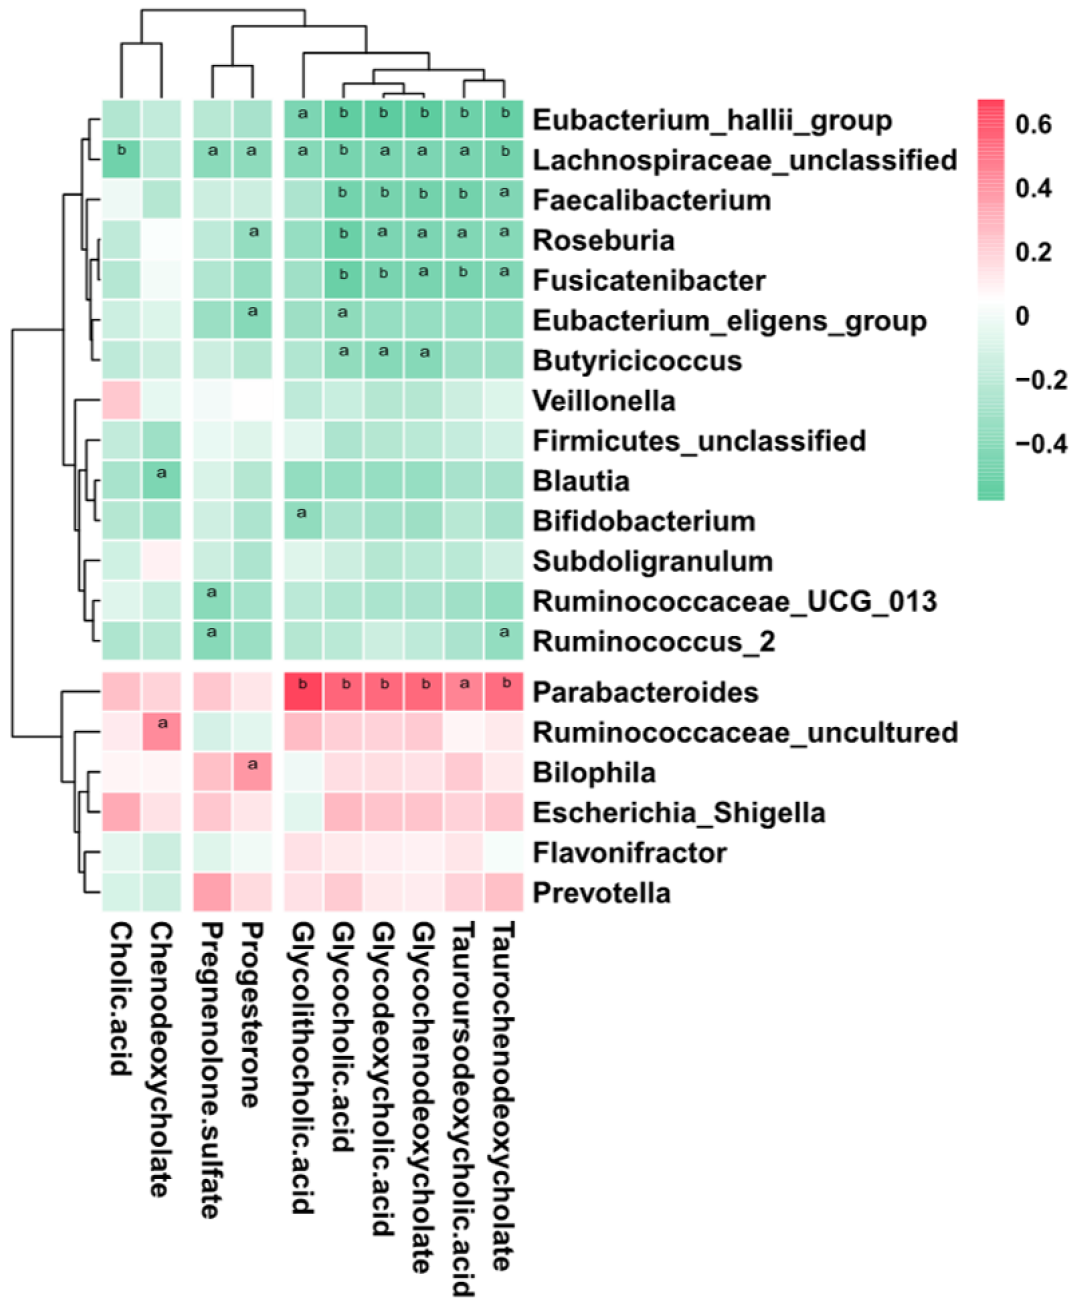
Figure 5 Association of key genera associated with disease with bile acid-related metabolites.
Genera important for differentiating healthy controls/intrahepatic cholestasis in pregnancy status were identified using random Forest package. The significance level in the correlation test is denoted as: aP < 0.05; bP < 0.01.
- Citation: Li GH, Huang SJ, Li X, Liu XS, Du QL. Response of gut microbiota to serum metabolome changes in intrahepatic cholestasis of pregnant patients. World J Gastroenterol 2020; 26(46): 7338-7351
- URL: https://www.wjgnet.com/1007-9327/full/v26/i46/7338.htm
- DOI: https://dx.doi.org/10.3748/wjg.v26.i46.7338


