Copyright
©The Author(s) 2020.
World J Gastroenterol. Sep 21, 2020; 26(35): 5343-5353
Published online Sep 21, 2020. doi: 10.3748/wjg.v26.i35.5343
Published online Sep 21, 2020. doi: 10.3748/wjg.v26.i35.5343
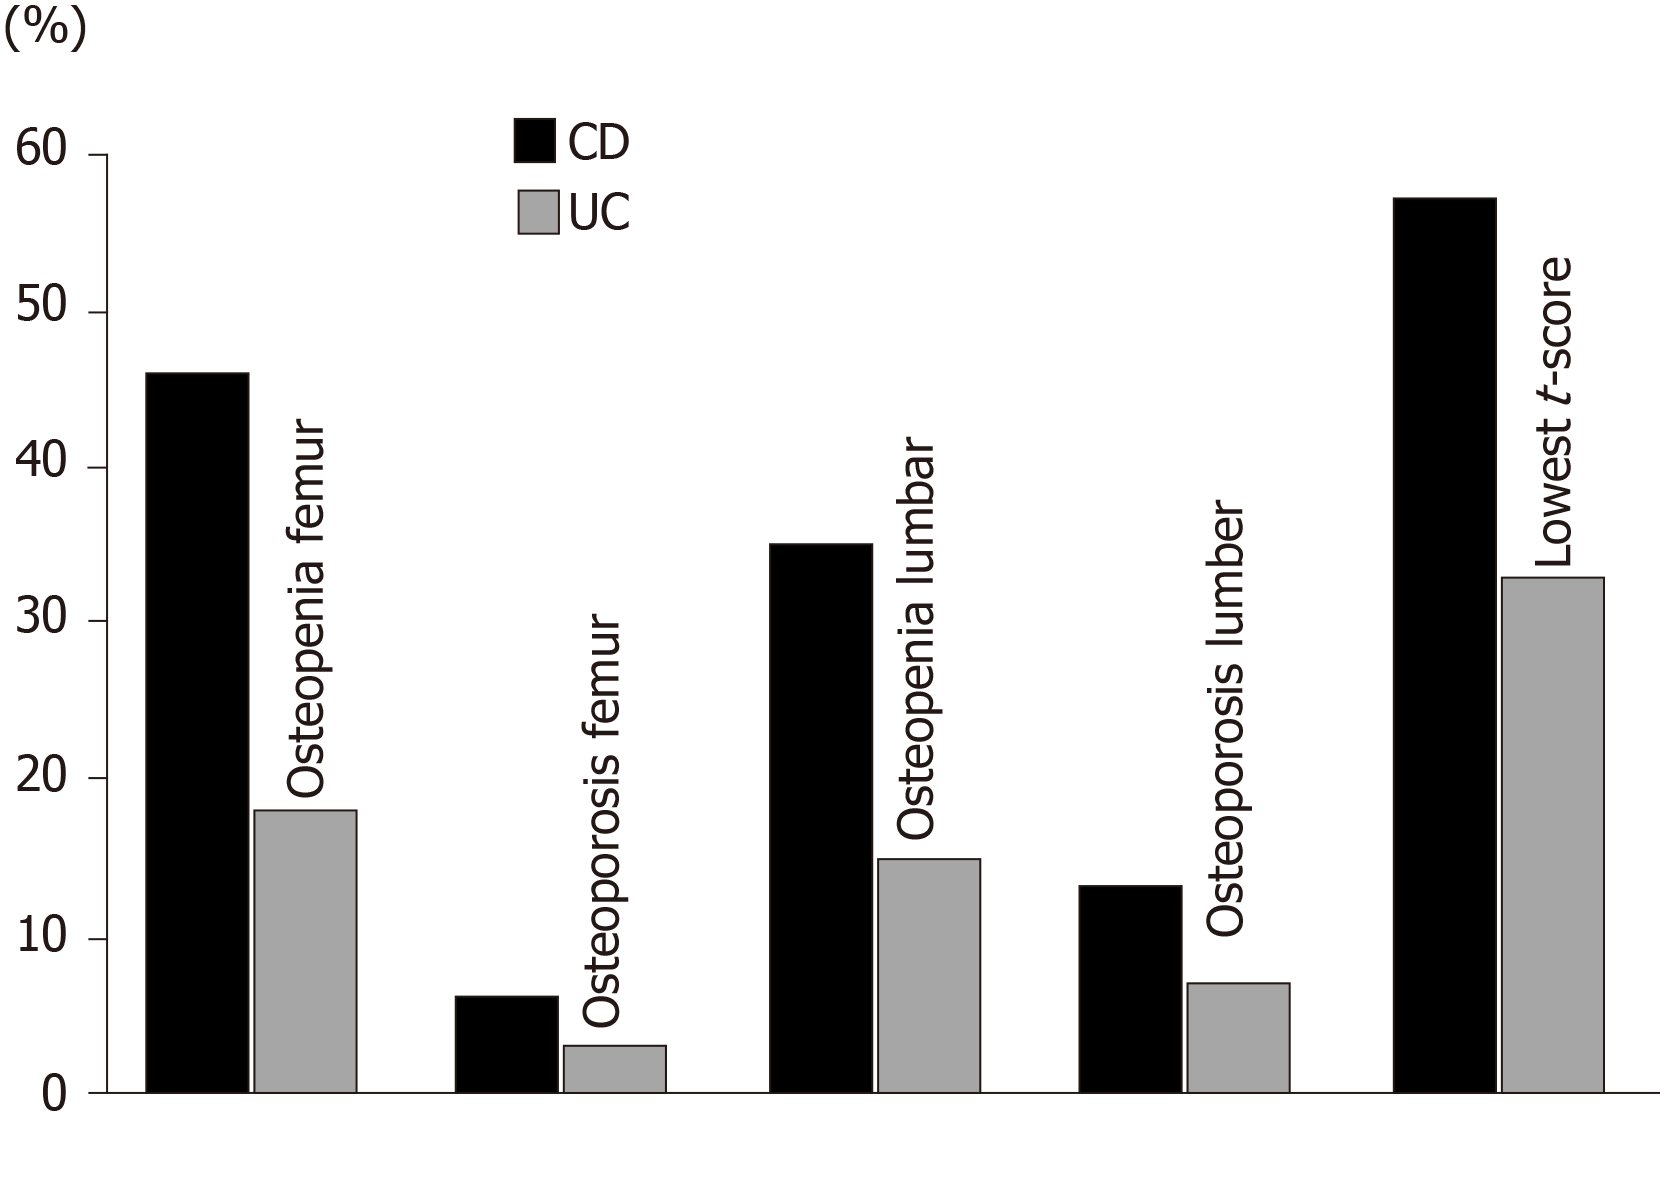
Figure 1 The percentages of patients with reduced bone mineral density in Crohn’s disease compared to ulcerative colitis.
CD: Crohn’s disease; UC: Ulcerative colitis.
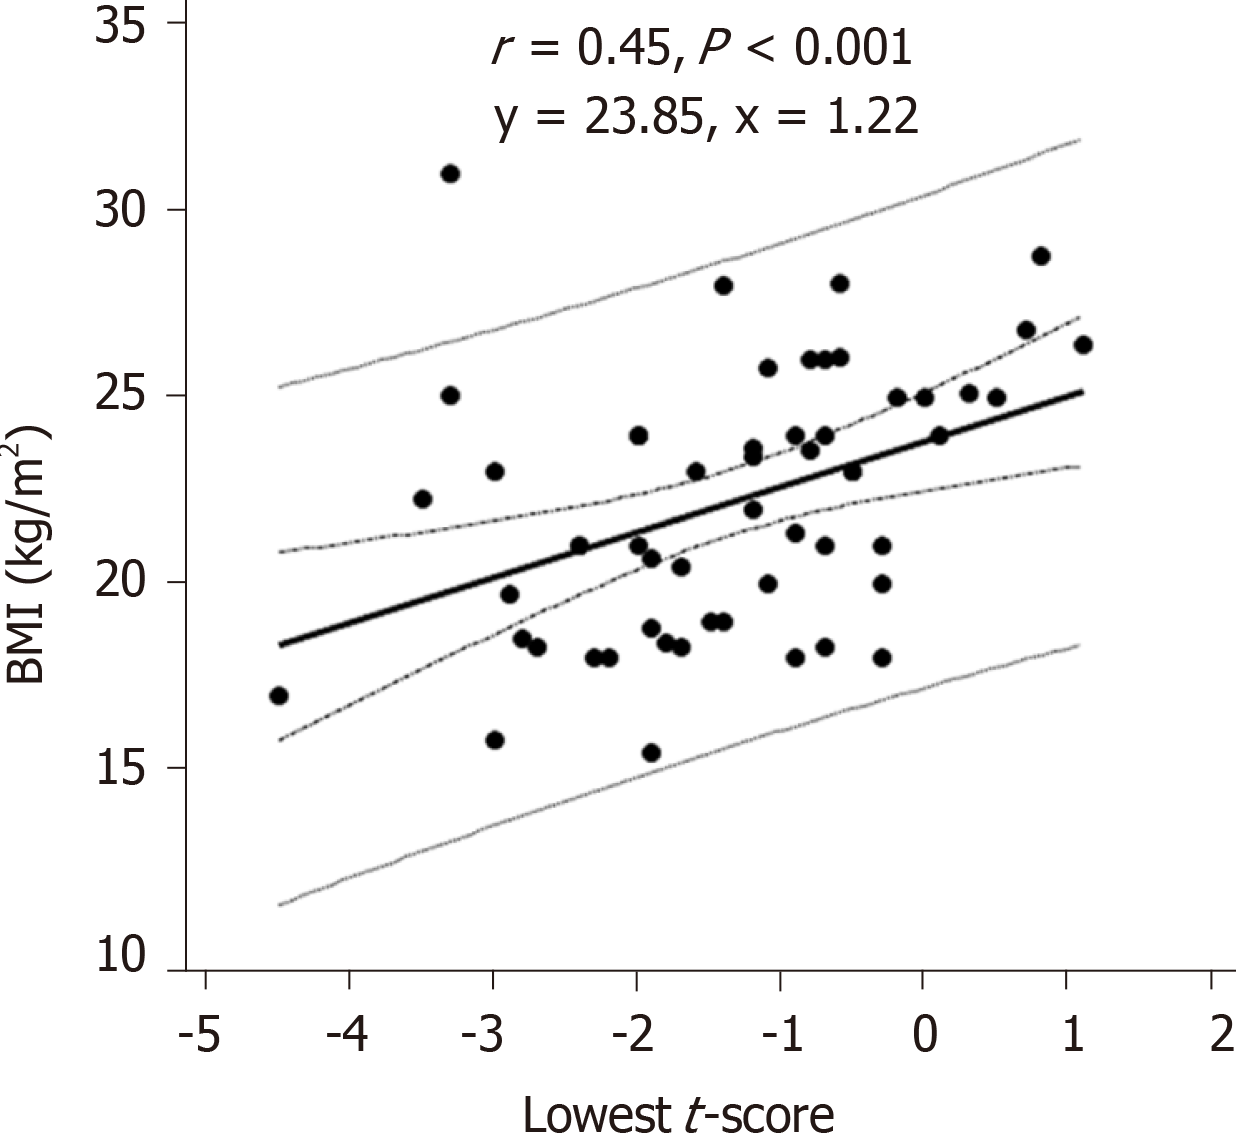
Figure 2 Scatterplot showing the correlation between lowest t-score and body mass index.
BMI: Body mass index.
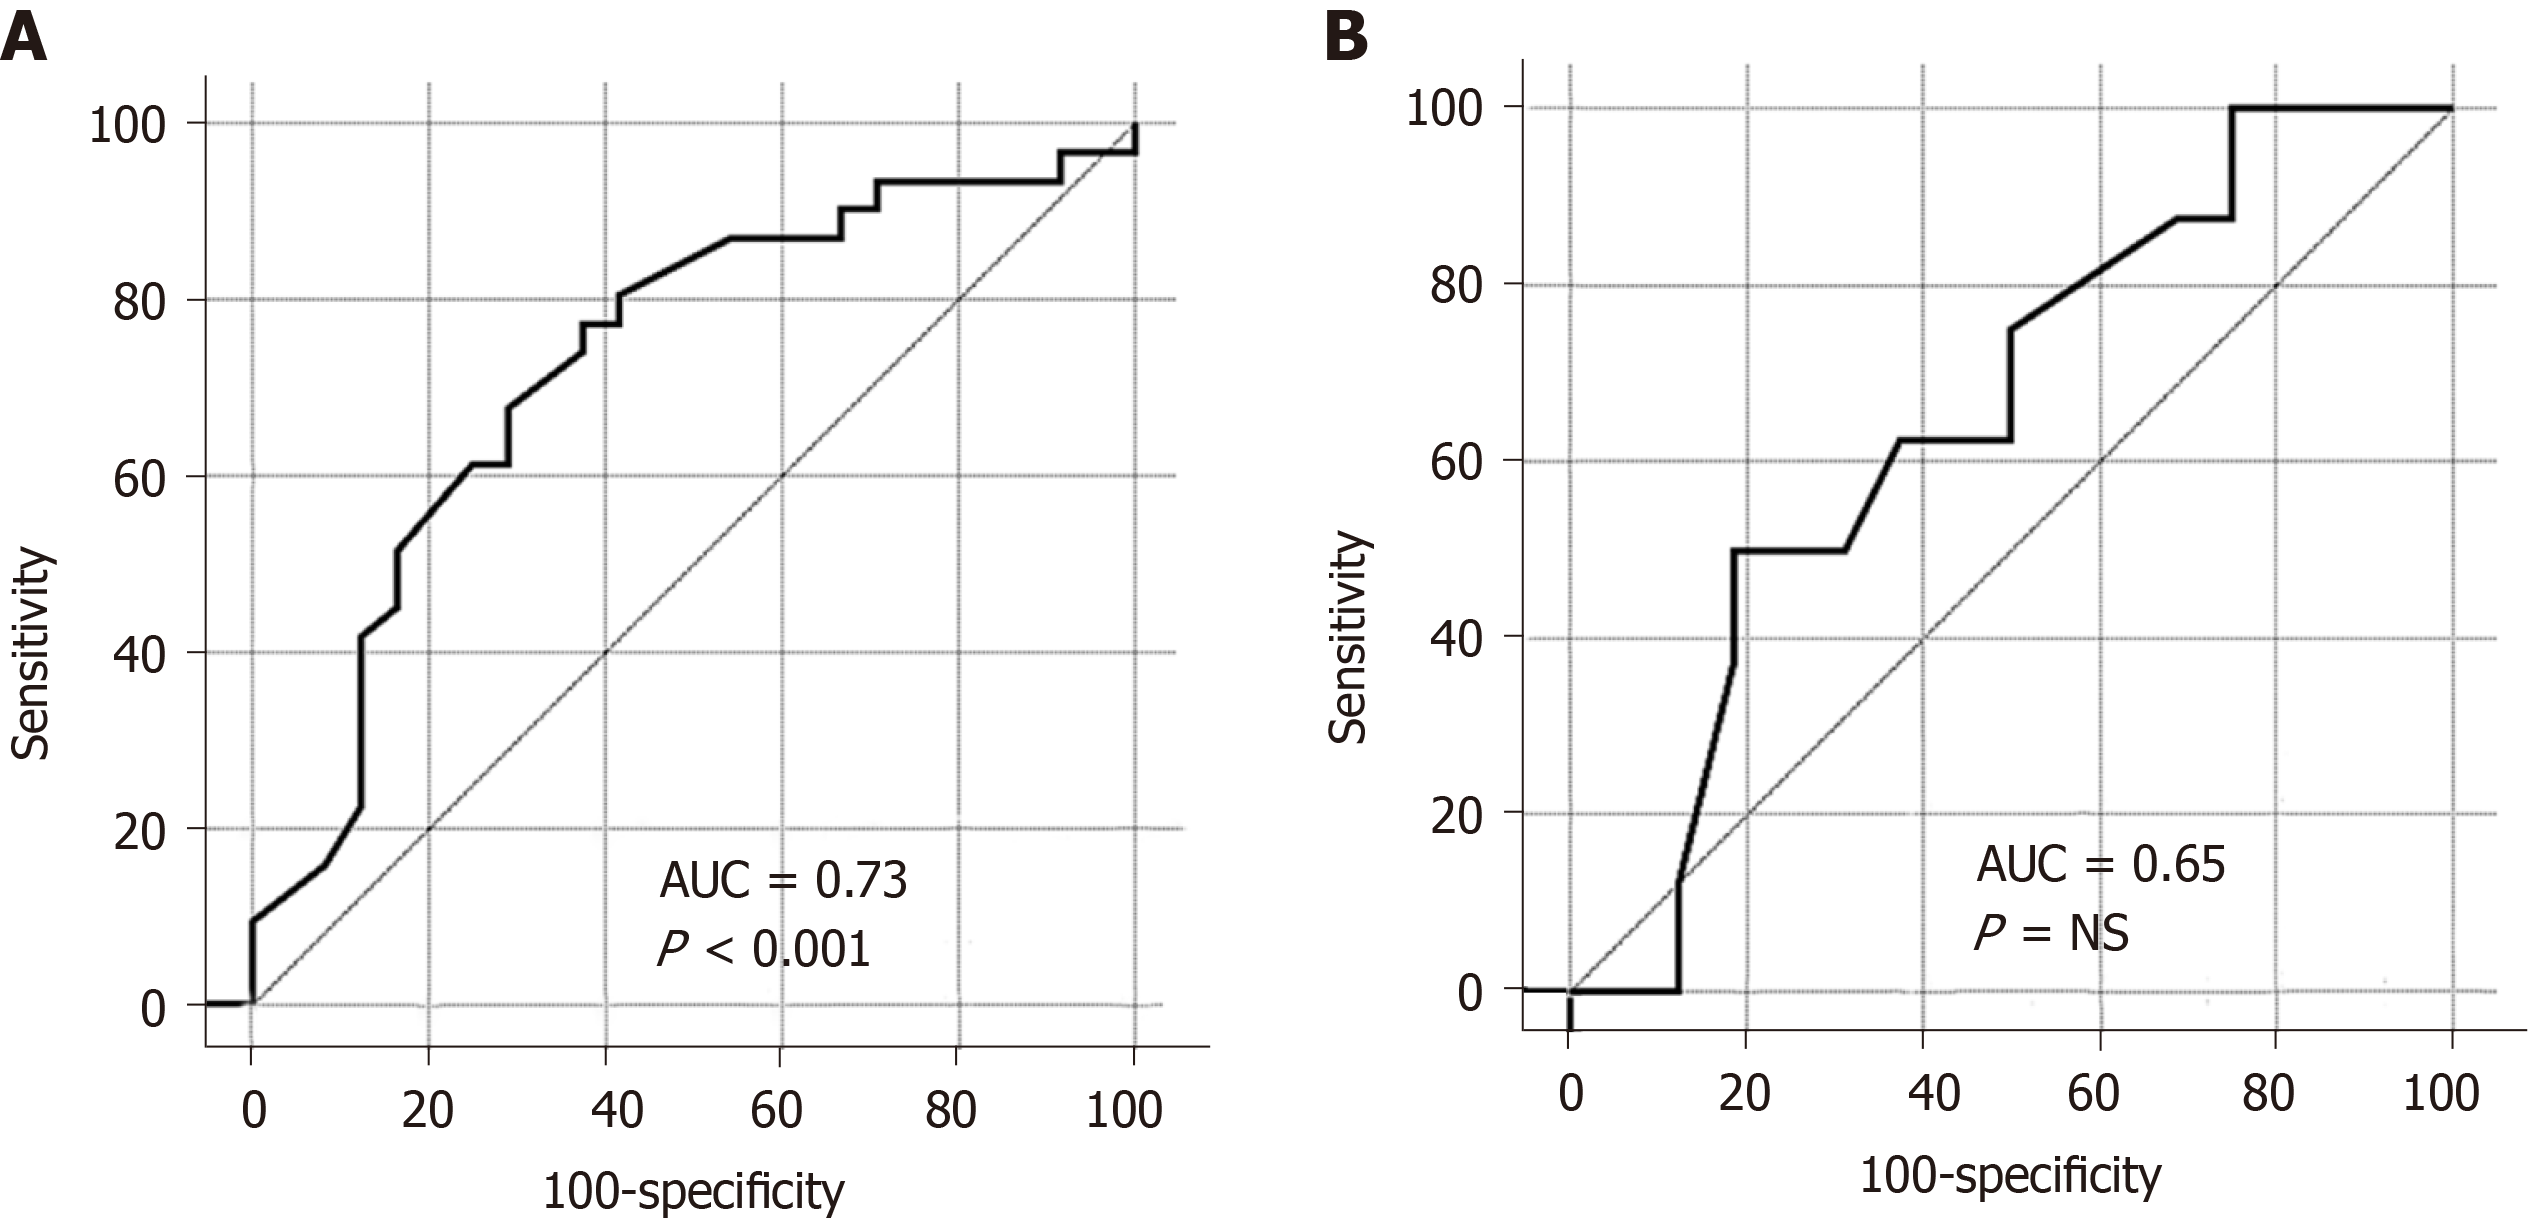
Figure 3 Receiver operating characteristic-curves showing prediction of low body mass index for low t-score in Crohn’s disease group (A) and in ulcerative colitis group (B).
AUC: Area under curve.
- Citation: Ewid M, Al Mutiri N, Al Omar K, Shamsan AN, Rathore AA, Saquib N, Salaas A, Al Sarraj O, Nasri Y, Attal A, Tawfiq A, Sherif H. Updated bone mineral density status in Saudi patients with inflammatory bowel disease. World J Gastroenterol 2020; 26(35): 5343-5353
- URL: https://www.wjgnet.com/1007-9327/full/v26/i35/5343.htm
- DOI: https://dx.doi.org/10.3748/wjg.v26.i35.5343


