Copyright
©The Author(s) 2020.
World J Gastroenterol. Sep 21, 2020; 26(35): 5314-5327
Published online Sep 21, 2020. doi: 10.3748/wjg.v26.i35.5314
Published online Sep 21, 2020. doi: 10.3748/wjg.v26.i35.5314
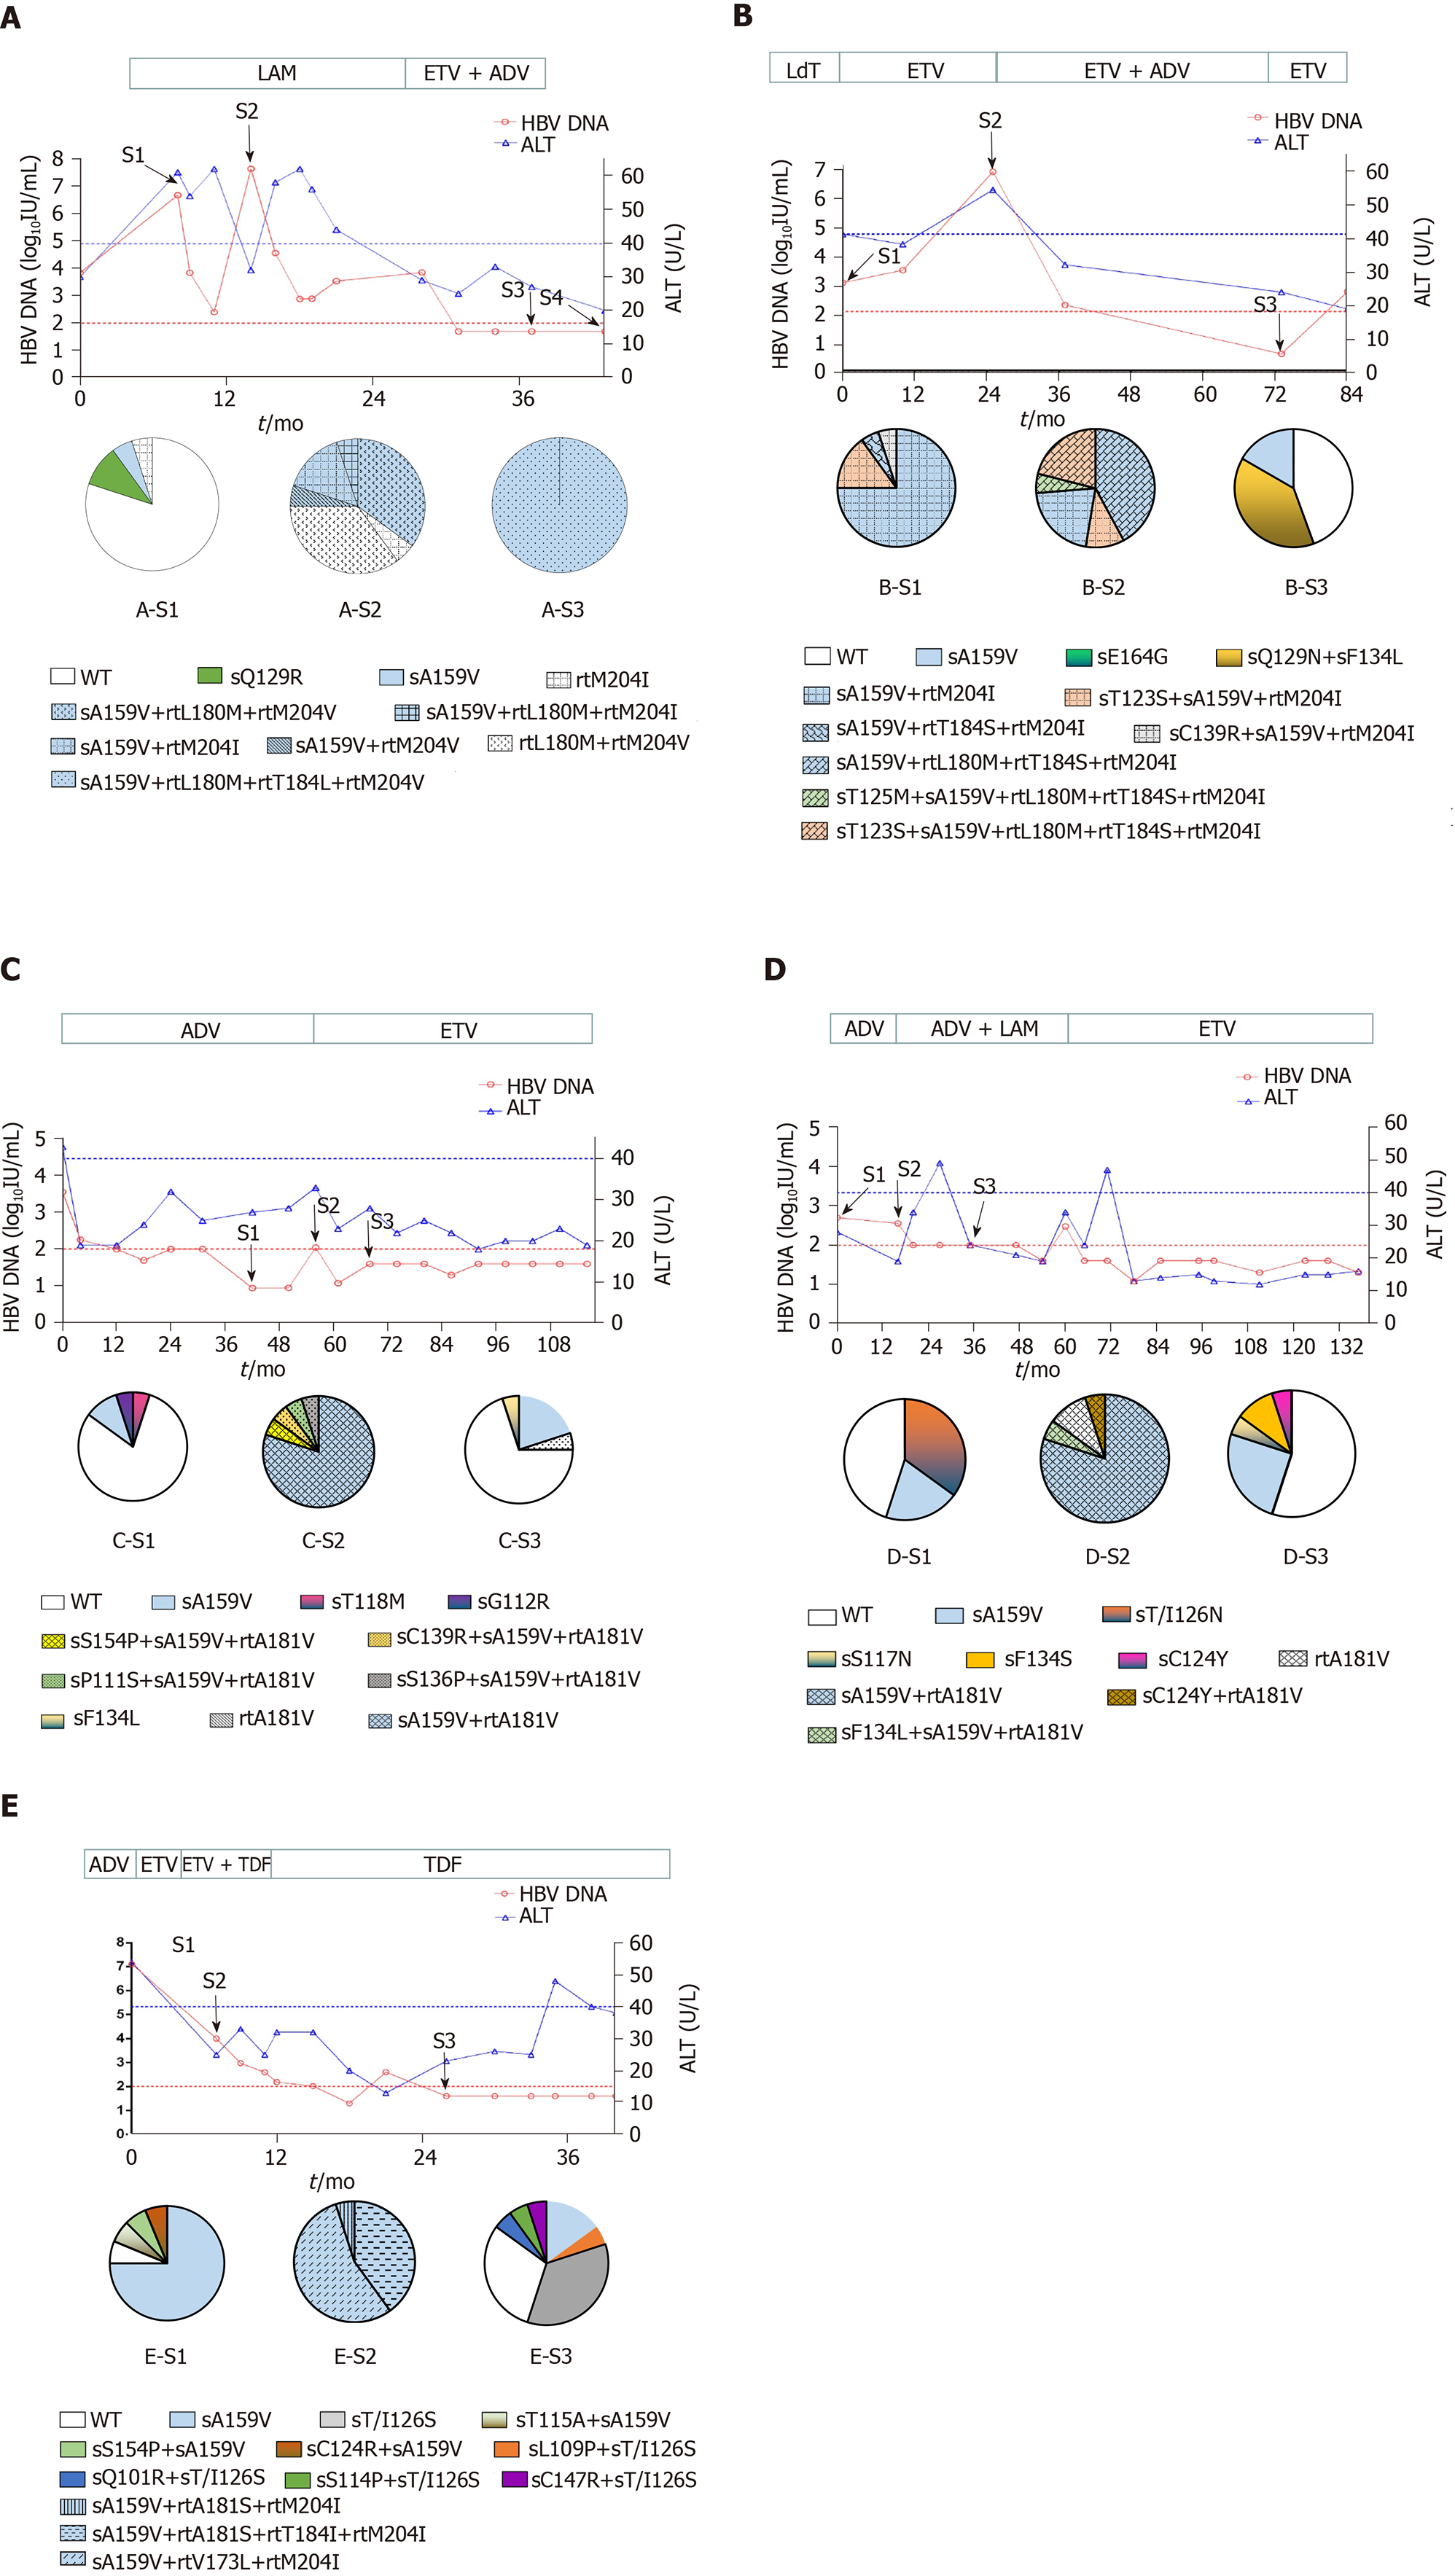
Figure 1 Evolution of drug-resistant hepatitis B virus strains and clinical responses during antiviral therapy in five representative patients.
Dynamic changes in serum hepatitis B virus deoxyribonucleic acid (HBV DNA) and alanine aminotransferase (ALT) levels are shown along with antiviral therapies. The duration (months) of antiviral therapy is represented by bars above the graph, and the serum samples from the patient for cloning are indicated by arrows. Two dashed lines show the lower detection limit of HBV DNA (100 IU/mL) and normal ALT levels (40 U/L). Proportions of wild-type and mutant HBV reverse transcriptase from each sample are depicted by a series of pie charts. A: Evolution of drug-resistant hepatitis B virus strains and clinical responses during antiviral therapy in patient A; B:Evolution of drug-resistant hepatitis B virus strains and clinical responses during antiviral therapy in patient B; C:Evolution of drug-resistant hepatitis B virus strains and clinical responses during antiviral therapy in patient C; D:Evolution of drug-resistant hepatitis B virus strains and clinical responses during antiviral therapy in patient D; E:Evolution of drug-resistant hepatitis B virus strains and clinical responses during antiviral therapy in patient E.
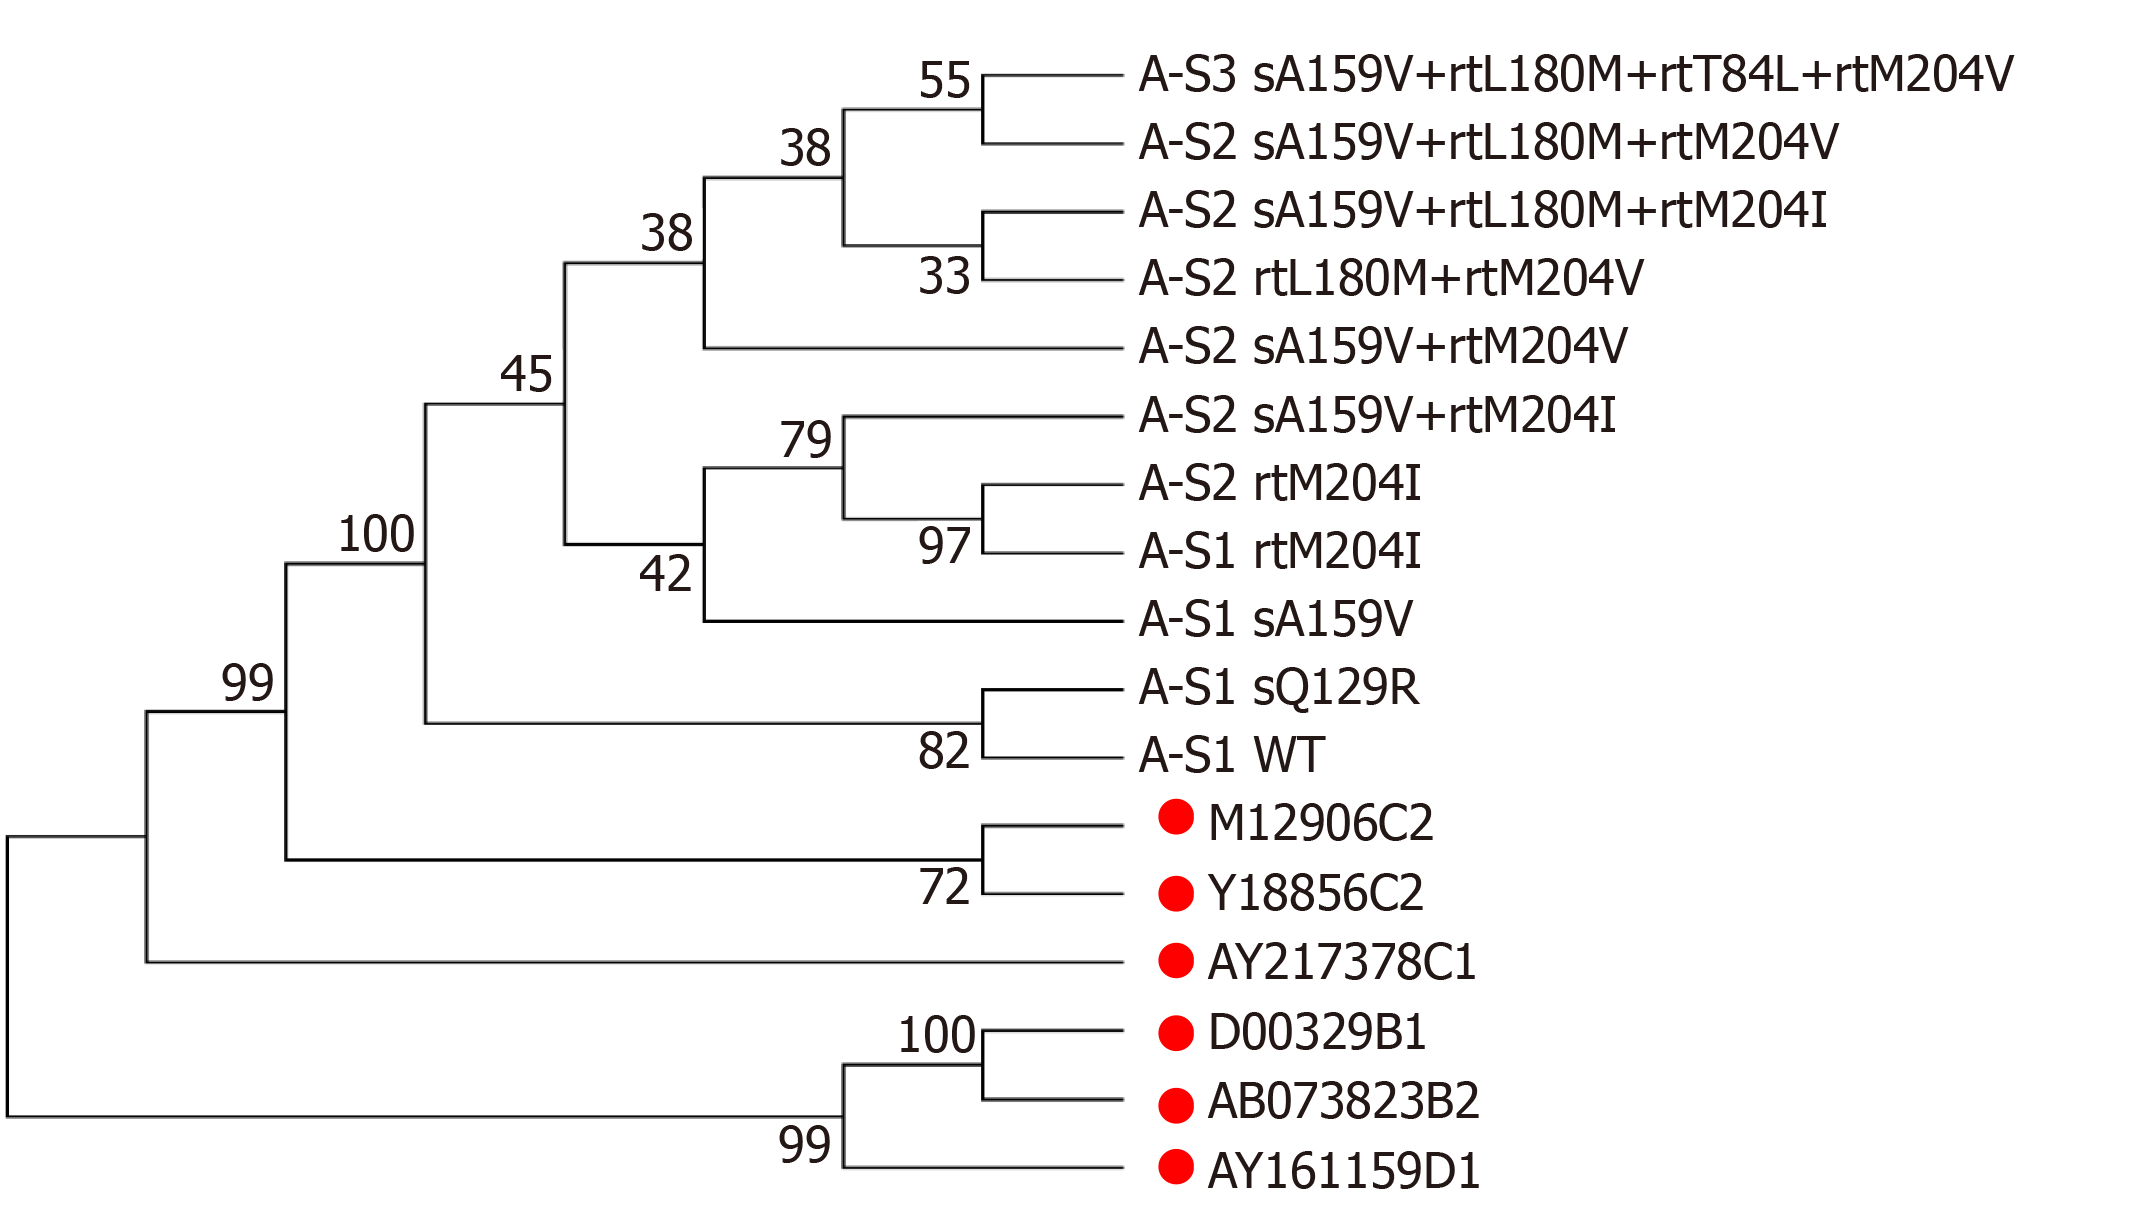
Figure 2 Phylogenetic tree analysis of hepatitis B virus reverse transcriptase sequences from a patient with sA159V + resistance mutations.
Reference sequences are marked with solid red circles.
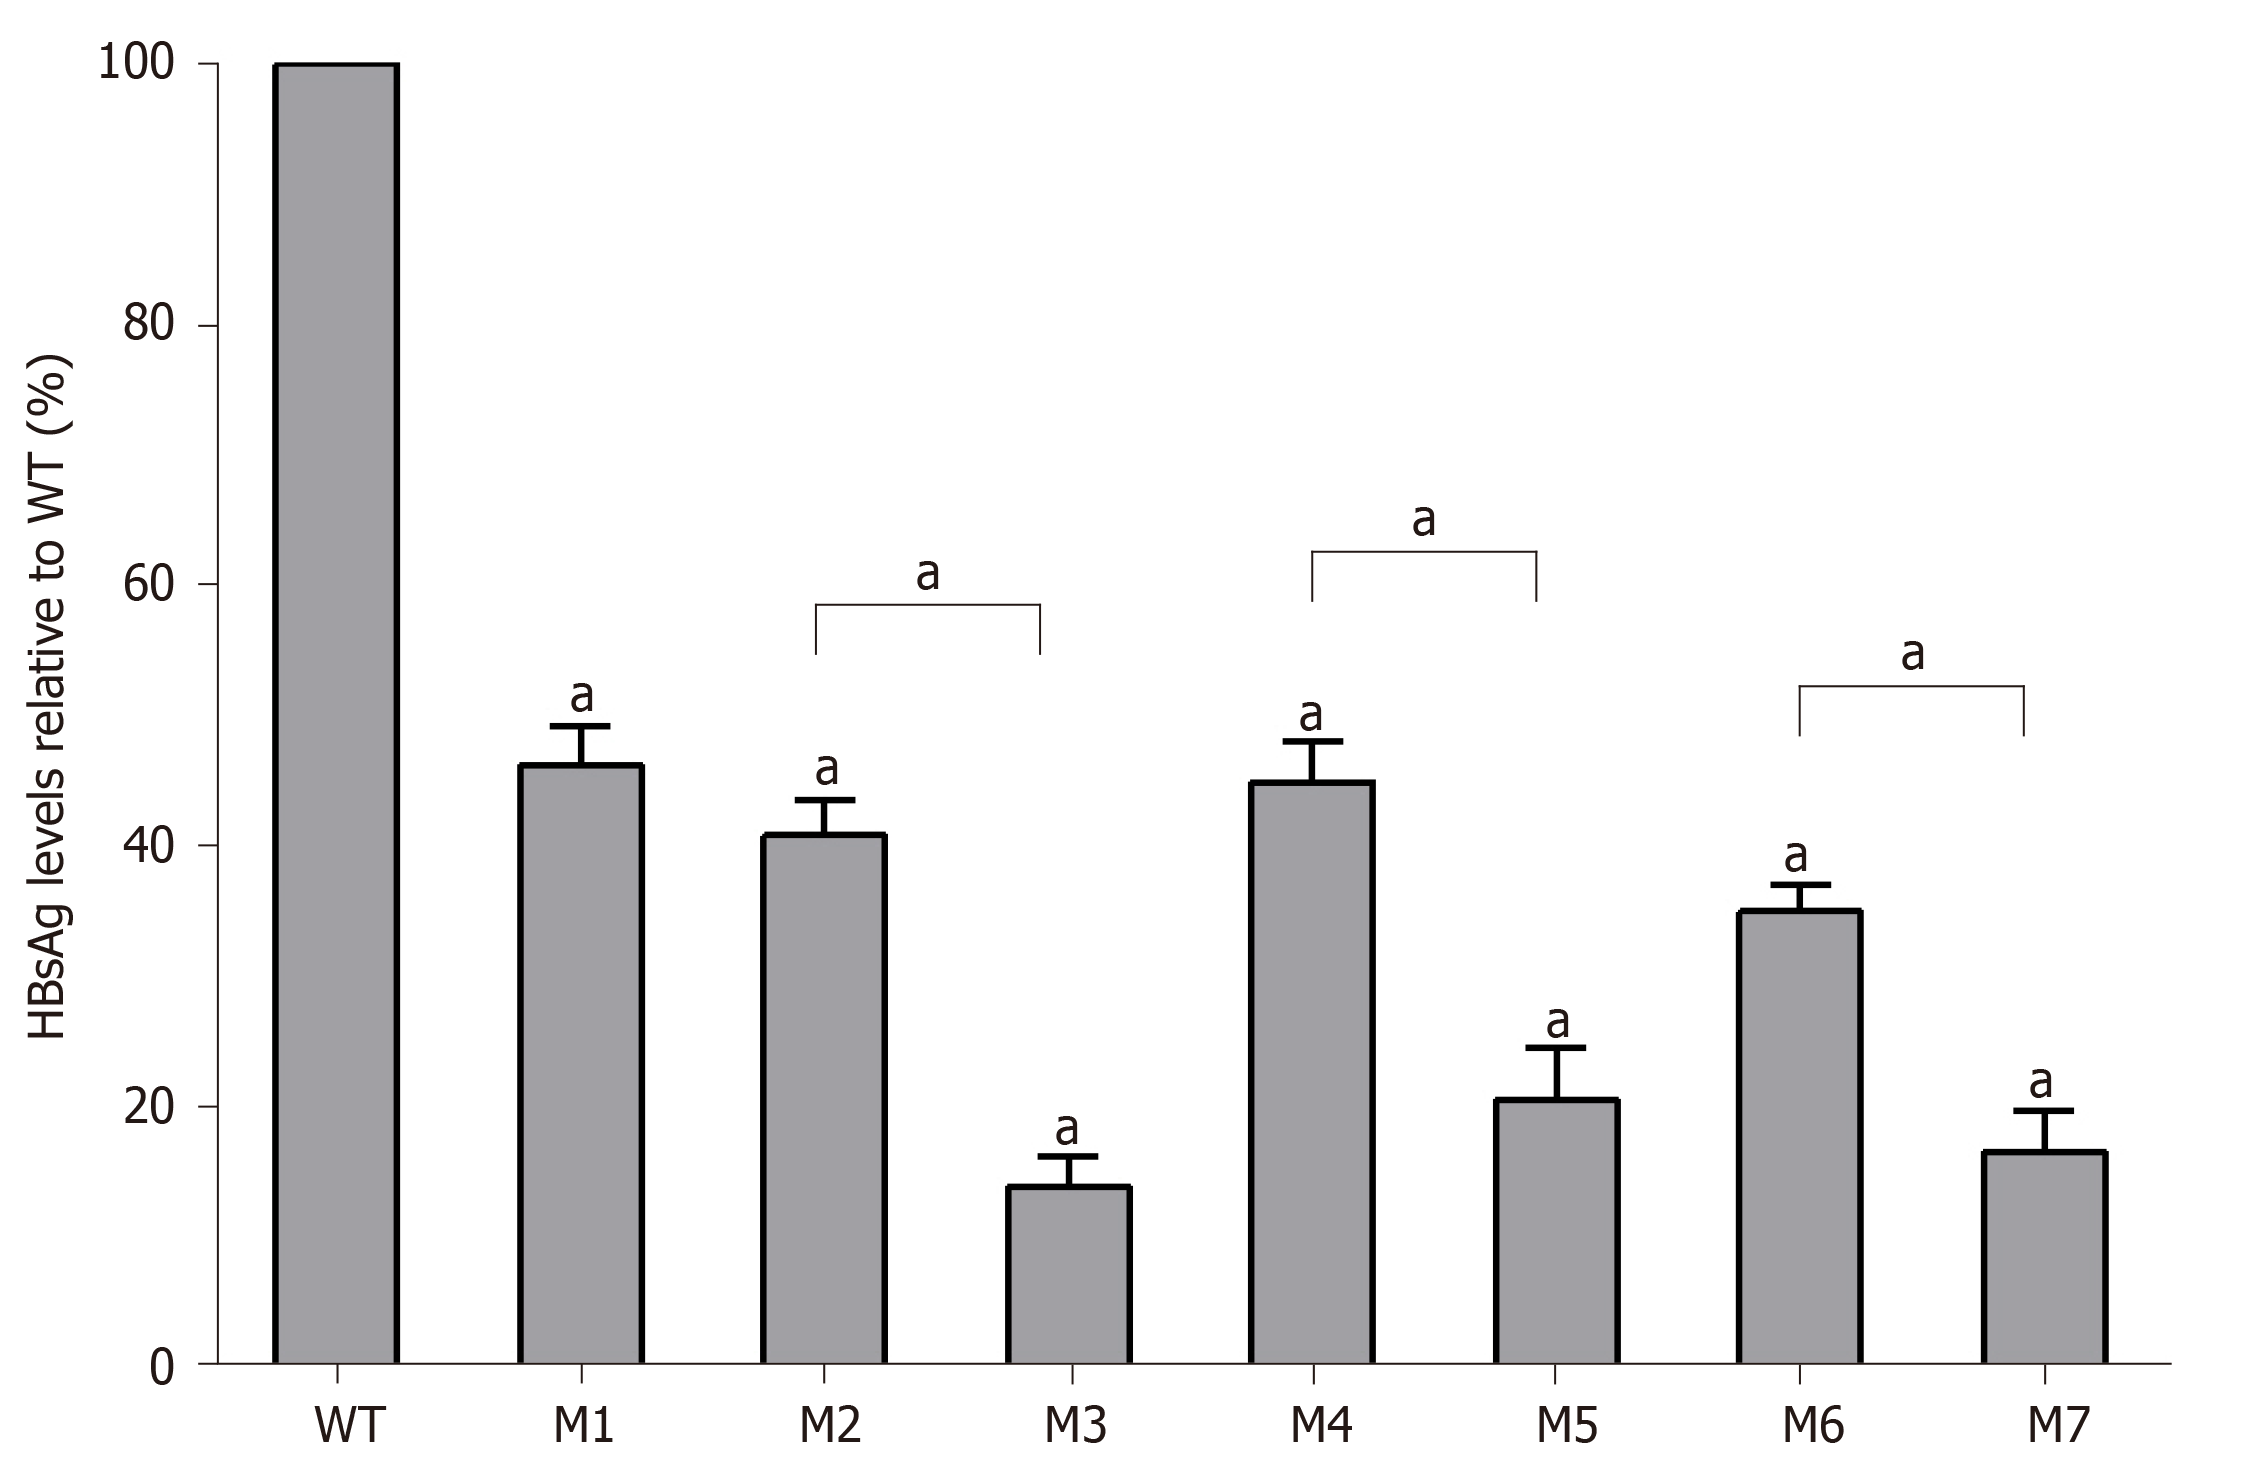
Figure 3 Quantitative analysis of hepatitis B surface antigen levels in individual viral vector-transfected human hepatocellular carcinoma cells.
Relative values (%) of mutant hepatitis B surface antigen levels vs wild-type levels are shown. Data are expressed as means ± standard deviations. M1, sA159V; M2, rtM204I; M3, sA159V+rtM204I; M4, rtL180M+rtM204V; M5, sA159V+rtL180M+rtM204V; M6, rtL180M+rtT184L+rtM204V; M7,sA159V+rtL180M+rtT184L+rtM204V. aP < 0.05 (mutant vs wild-type or other indicated mutant).
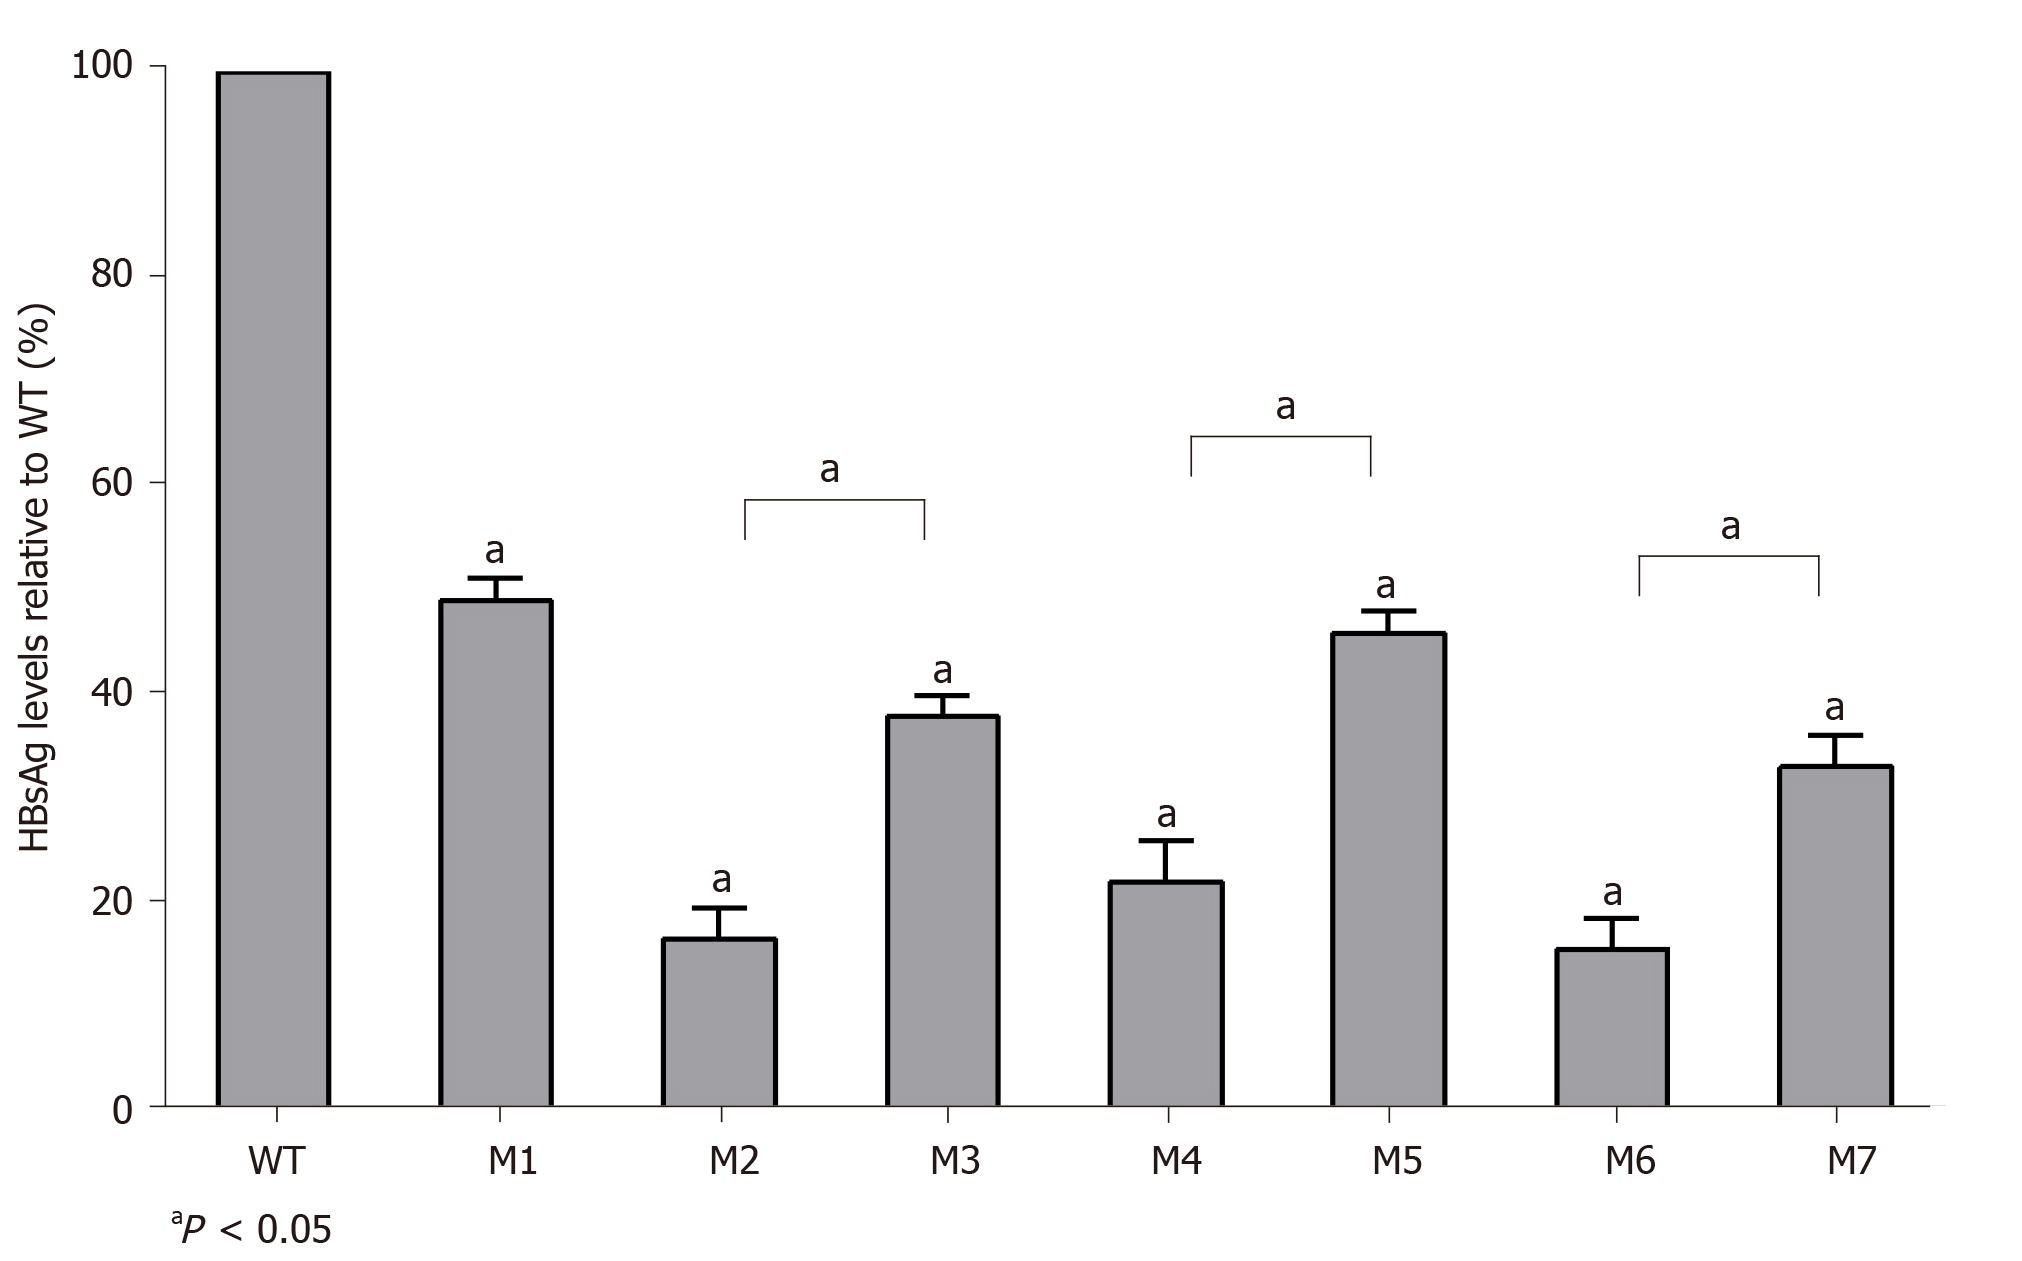
Figure 4 Quantitative analysis of hepatitis B virus deoxyribonucleic acid production levels in individual viral vector-transfected human hepatocellular carcinoma cells.
Relative values (%) of mutant hepatitis B virus deoxyribonucleic acid levels vs wild-type levels are shown. Data are expressed as the means ± standard deviations. M1, sA159V; M2, rtM204I; M3, sA159V+rtM204I; M4, rtL180M+rtM204V; M5, sA159V+rtL180M+rtM204V; M6,sA159V+rtL180M+rtT184L+rtM204V; M7, rtL180M+rtT184L+rtM204V. aP < 0.05 (mutant vs wild-type or other indicated mutants).
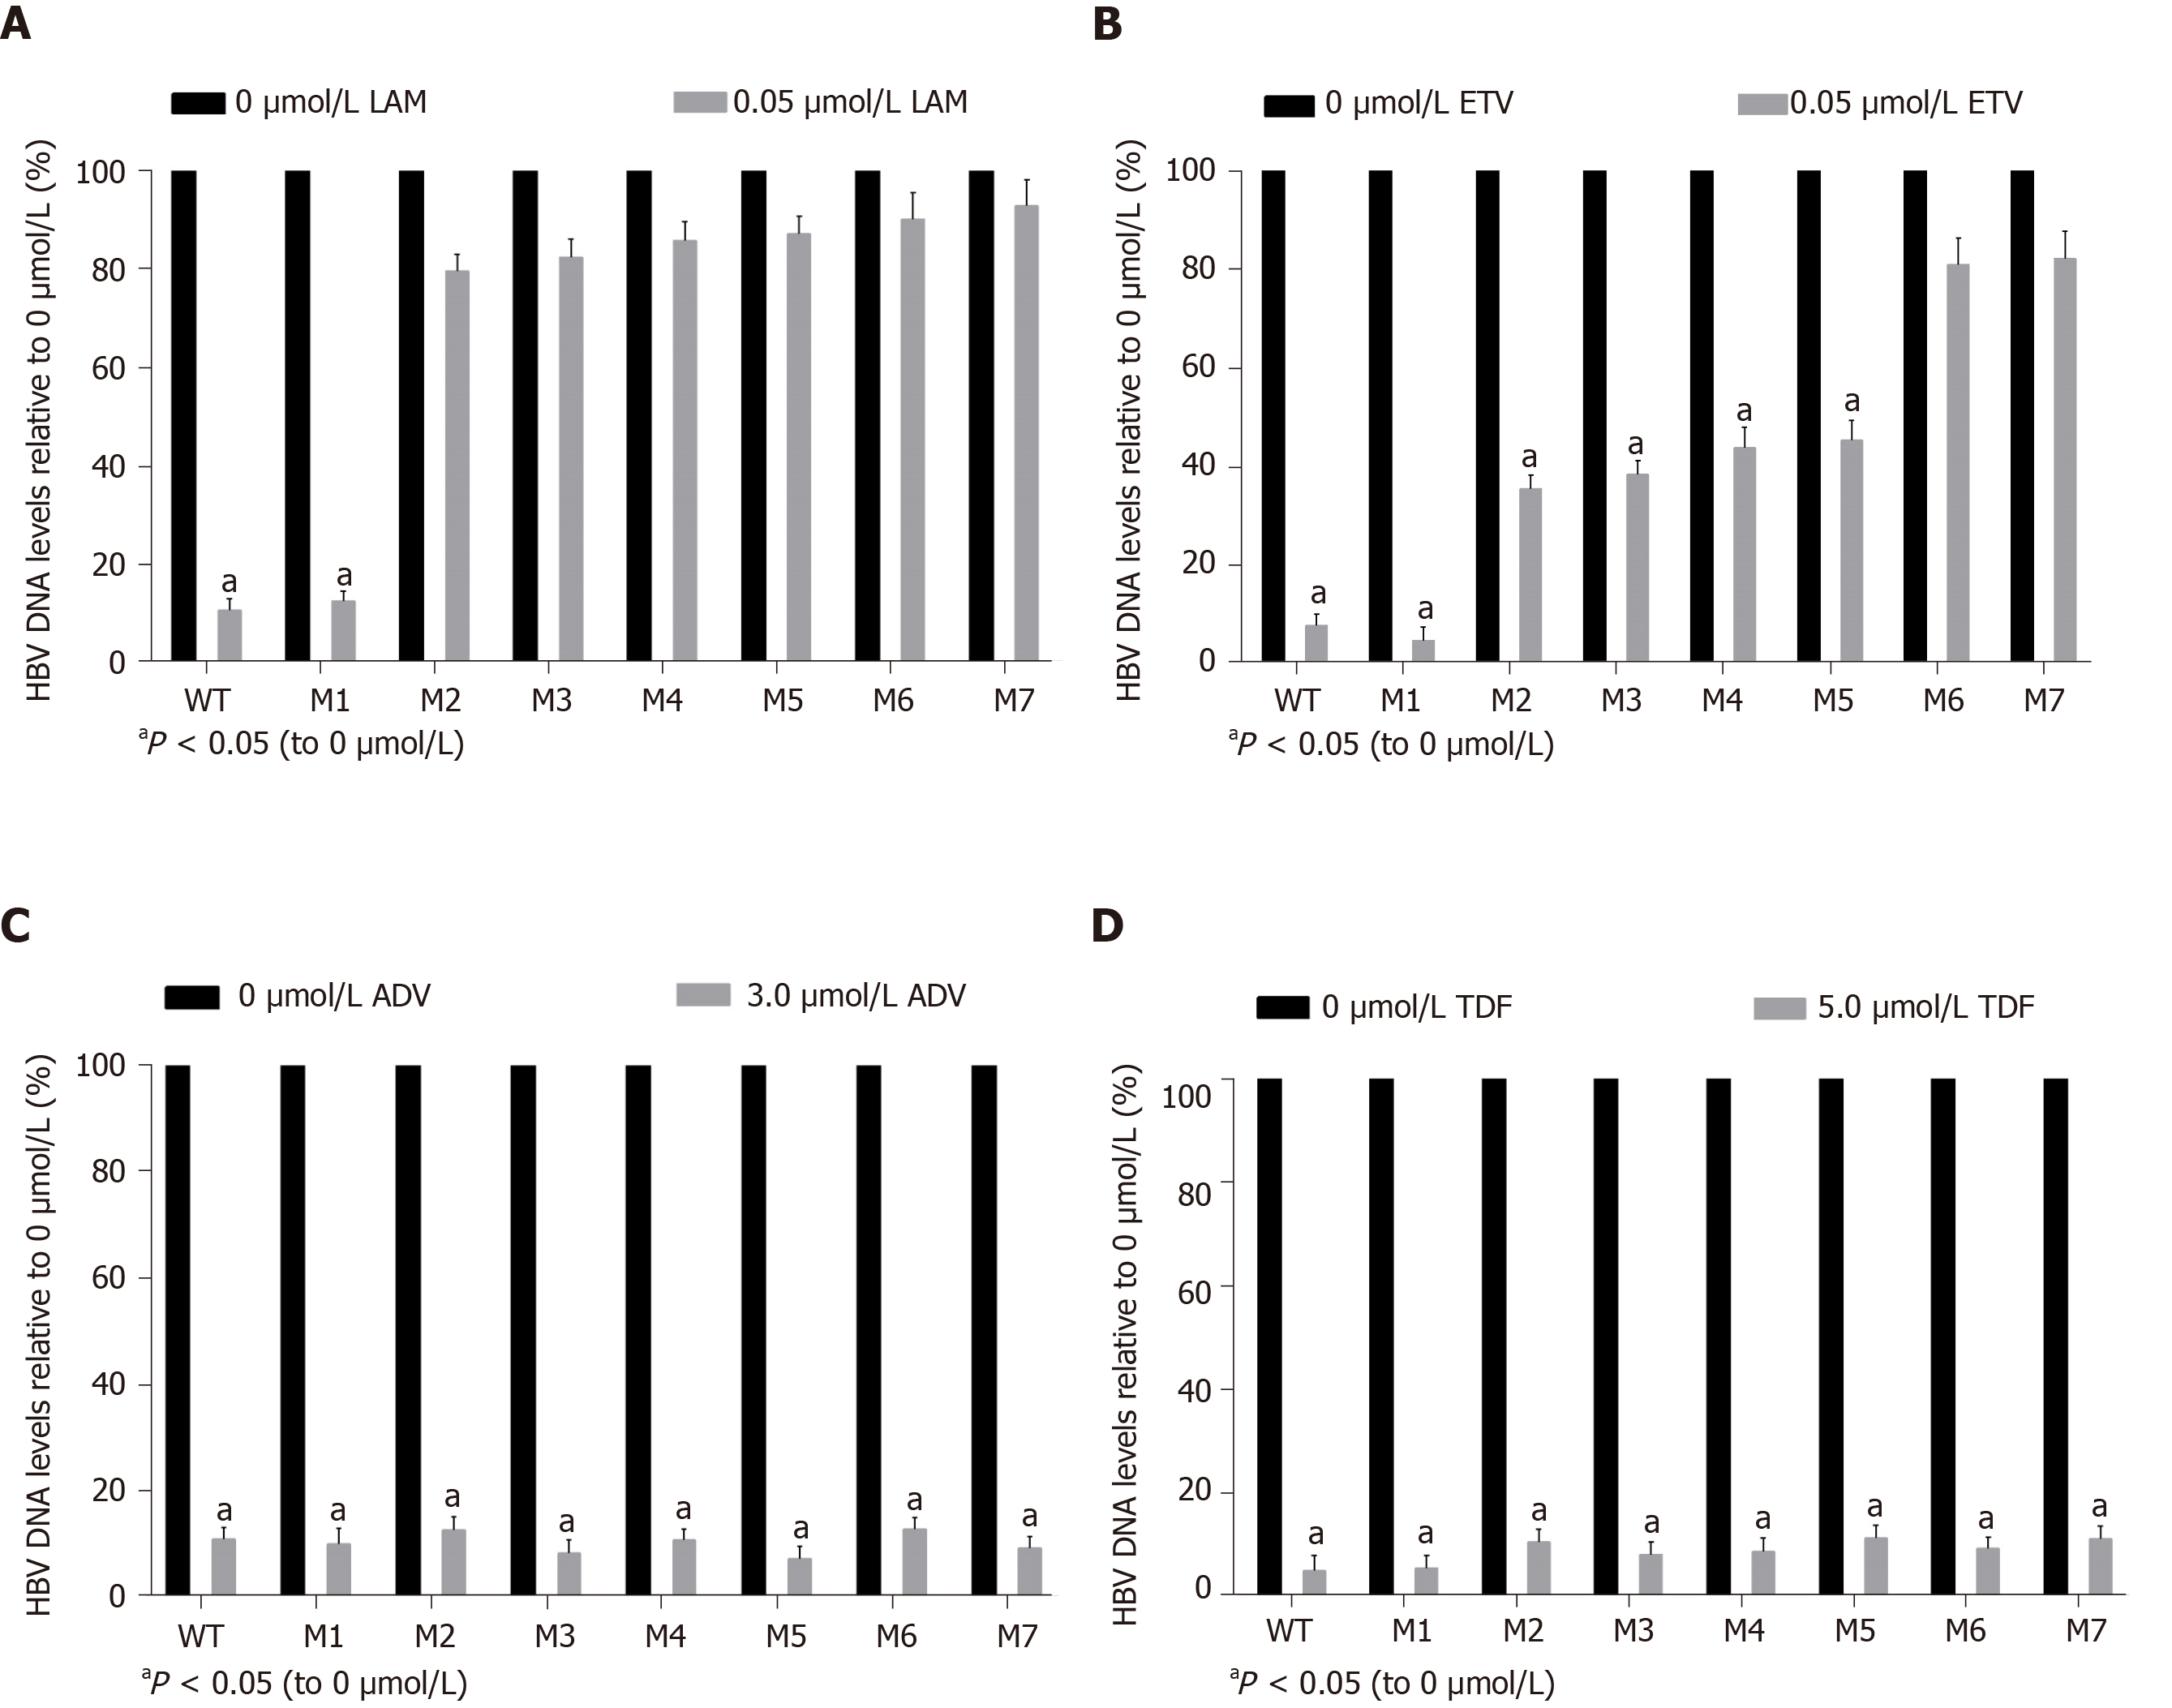
Figure 5 Assessment of drug-induced viral inhibition.
Human hepatocellular carcinomas cells were transiently transfected with wild-type or individual viral vectors and cultured with or without one of the following four drugs: (A) 0.05 μmol/L lamivudine, (B) 0.05 μmol/L entecavir, (C) 3.0 μmol/L adefovir, and (D) 5.0 μmol/L tenofovir disoproxil fumarate. Viral inhibition was evaluated as the relative hepatitis B virus deoxyribonucleic acid level of samples with the drug to that without the drug. M1, sA159V; M2, rtM204I; M3, sA159V+rtM204I; M4, rtL180M+rtM204V; M5, sA159V+tL180M+rtM204V; M6, rtL180M+rtT184L+rtM204V; M7, sA159V+rtL180M+rtT184L+rtM204V. aP < 0.05.
- Citation: Huang BX, Liu Y, Fan ZP, Si LL, Chen RJ, Wang J, Luo D, Wang FS, Xu DP, Liu XG. Investigation of immune escape-associated mutations of hepatitis B virus in patients harboring hepatitis B virus drug-resistance mutations. World J Gastroenterol 2020; 26(35): 5314-5327
- URL: https://www.wjgnet.com/1007-9327/full/v26/i35/5314.htm
- DOI: https://dx.doi.org/10.3748/wjg.v26.i35.5314


