Copyright
©The Author(s) 2020.
World J Gastroenterol. Sep 21, 2020; 26(35): 5287-5301
Published online Sep 21, 2020. doi: 10.3748/wjg.v26.i35.5287
Published online Sep 21, 2020. doi: 10.3748/wjg.v26.i35.5287
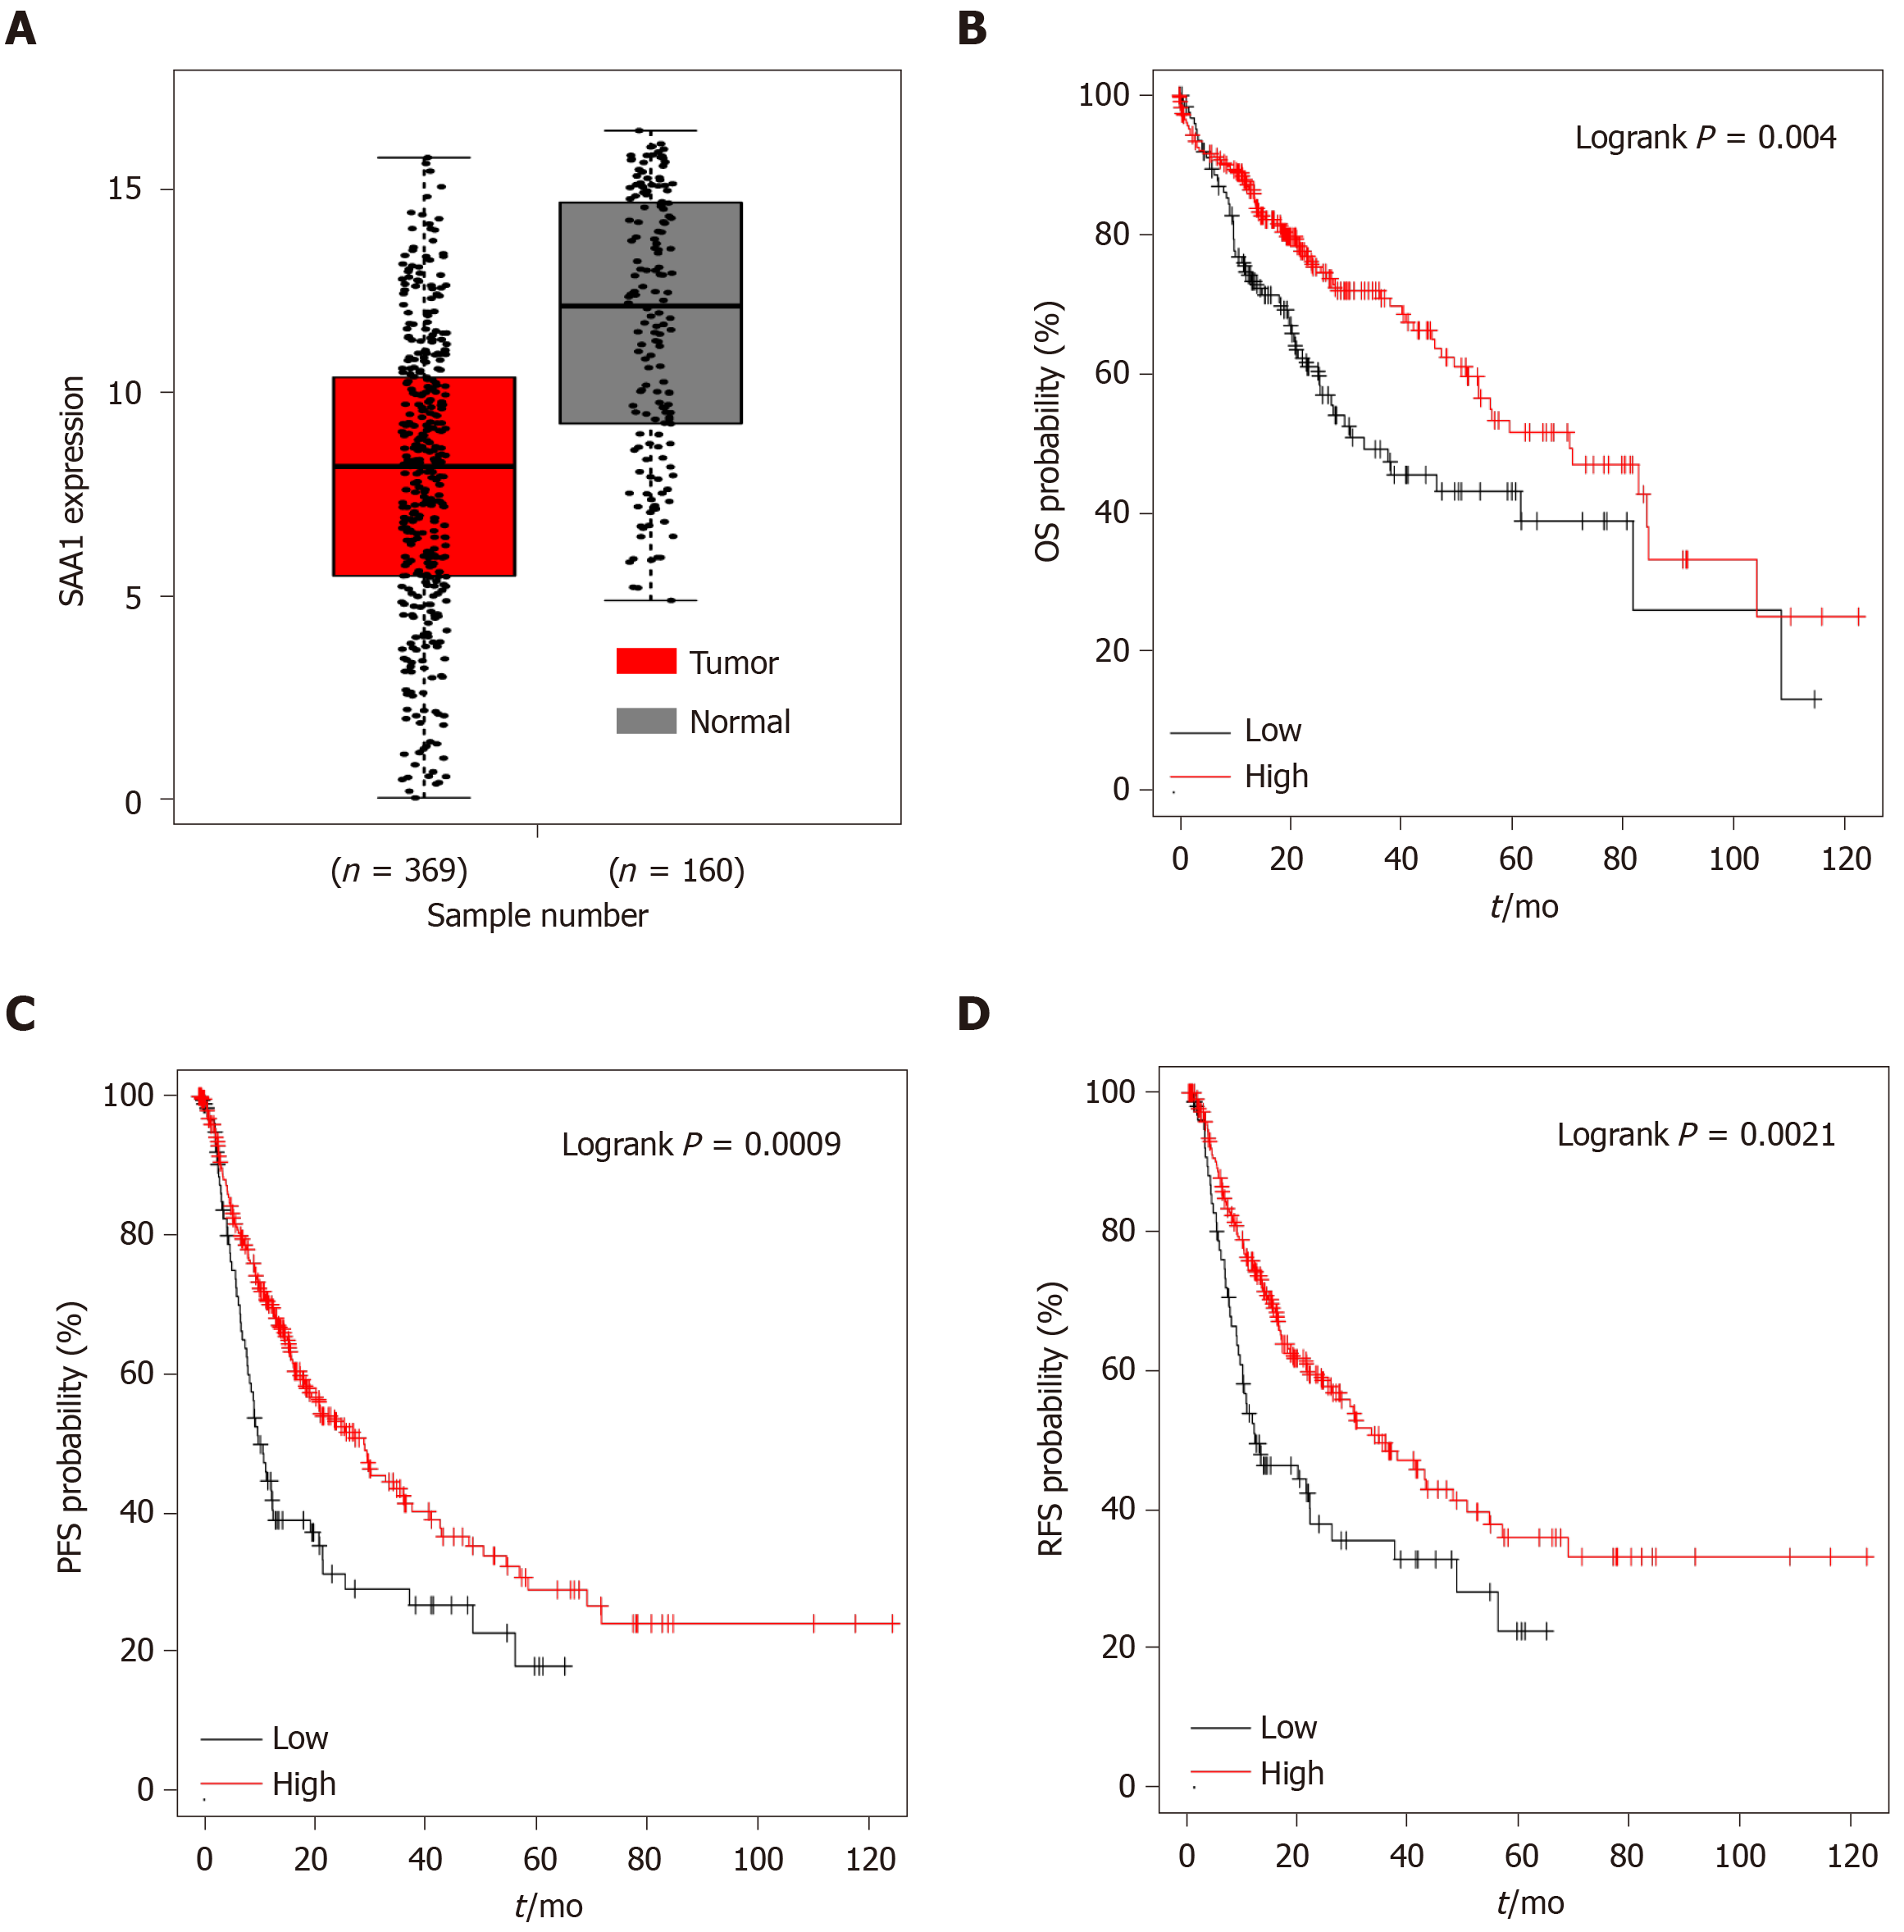
Figure 1 Serum amyloid A1 expression in hepatocellular carcinoma tumor and surrounding non-tumor or genotype-tissue expression liver tissues and its effect on the survival rate of hepatocellular carcinoma patients.
A: A total of 160 hepatocellular carcinoma (HCC) tumor samples and 369 normal liver tissues were included to evaluate the serum amyloid A1 (SAA1) transcript expression level. Normal liver tissues are comprised of surrounding non-tumor and genotype-tissue expression liver tissues; B: HCC patients were divided into two groups based on the SAA1 expression level, and conducted the overall survival (OS); C: Progression-free survival (PFS); D: Recurrence-free survival analysis (RFS). The log-rank P value was subjected to evaluate the statistical difference.
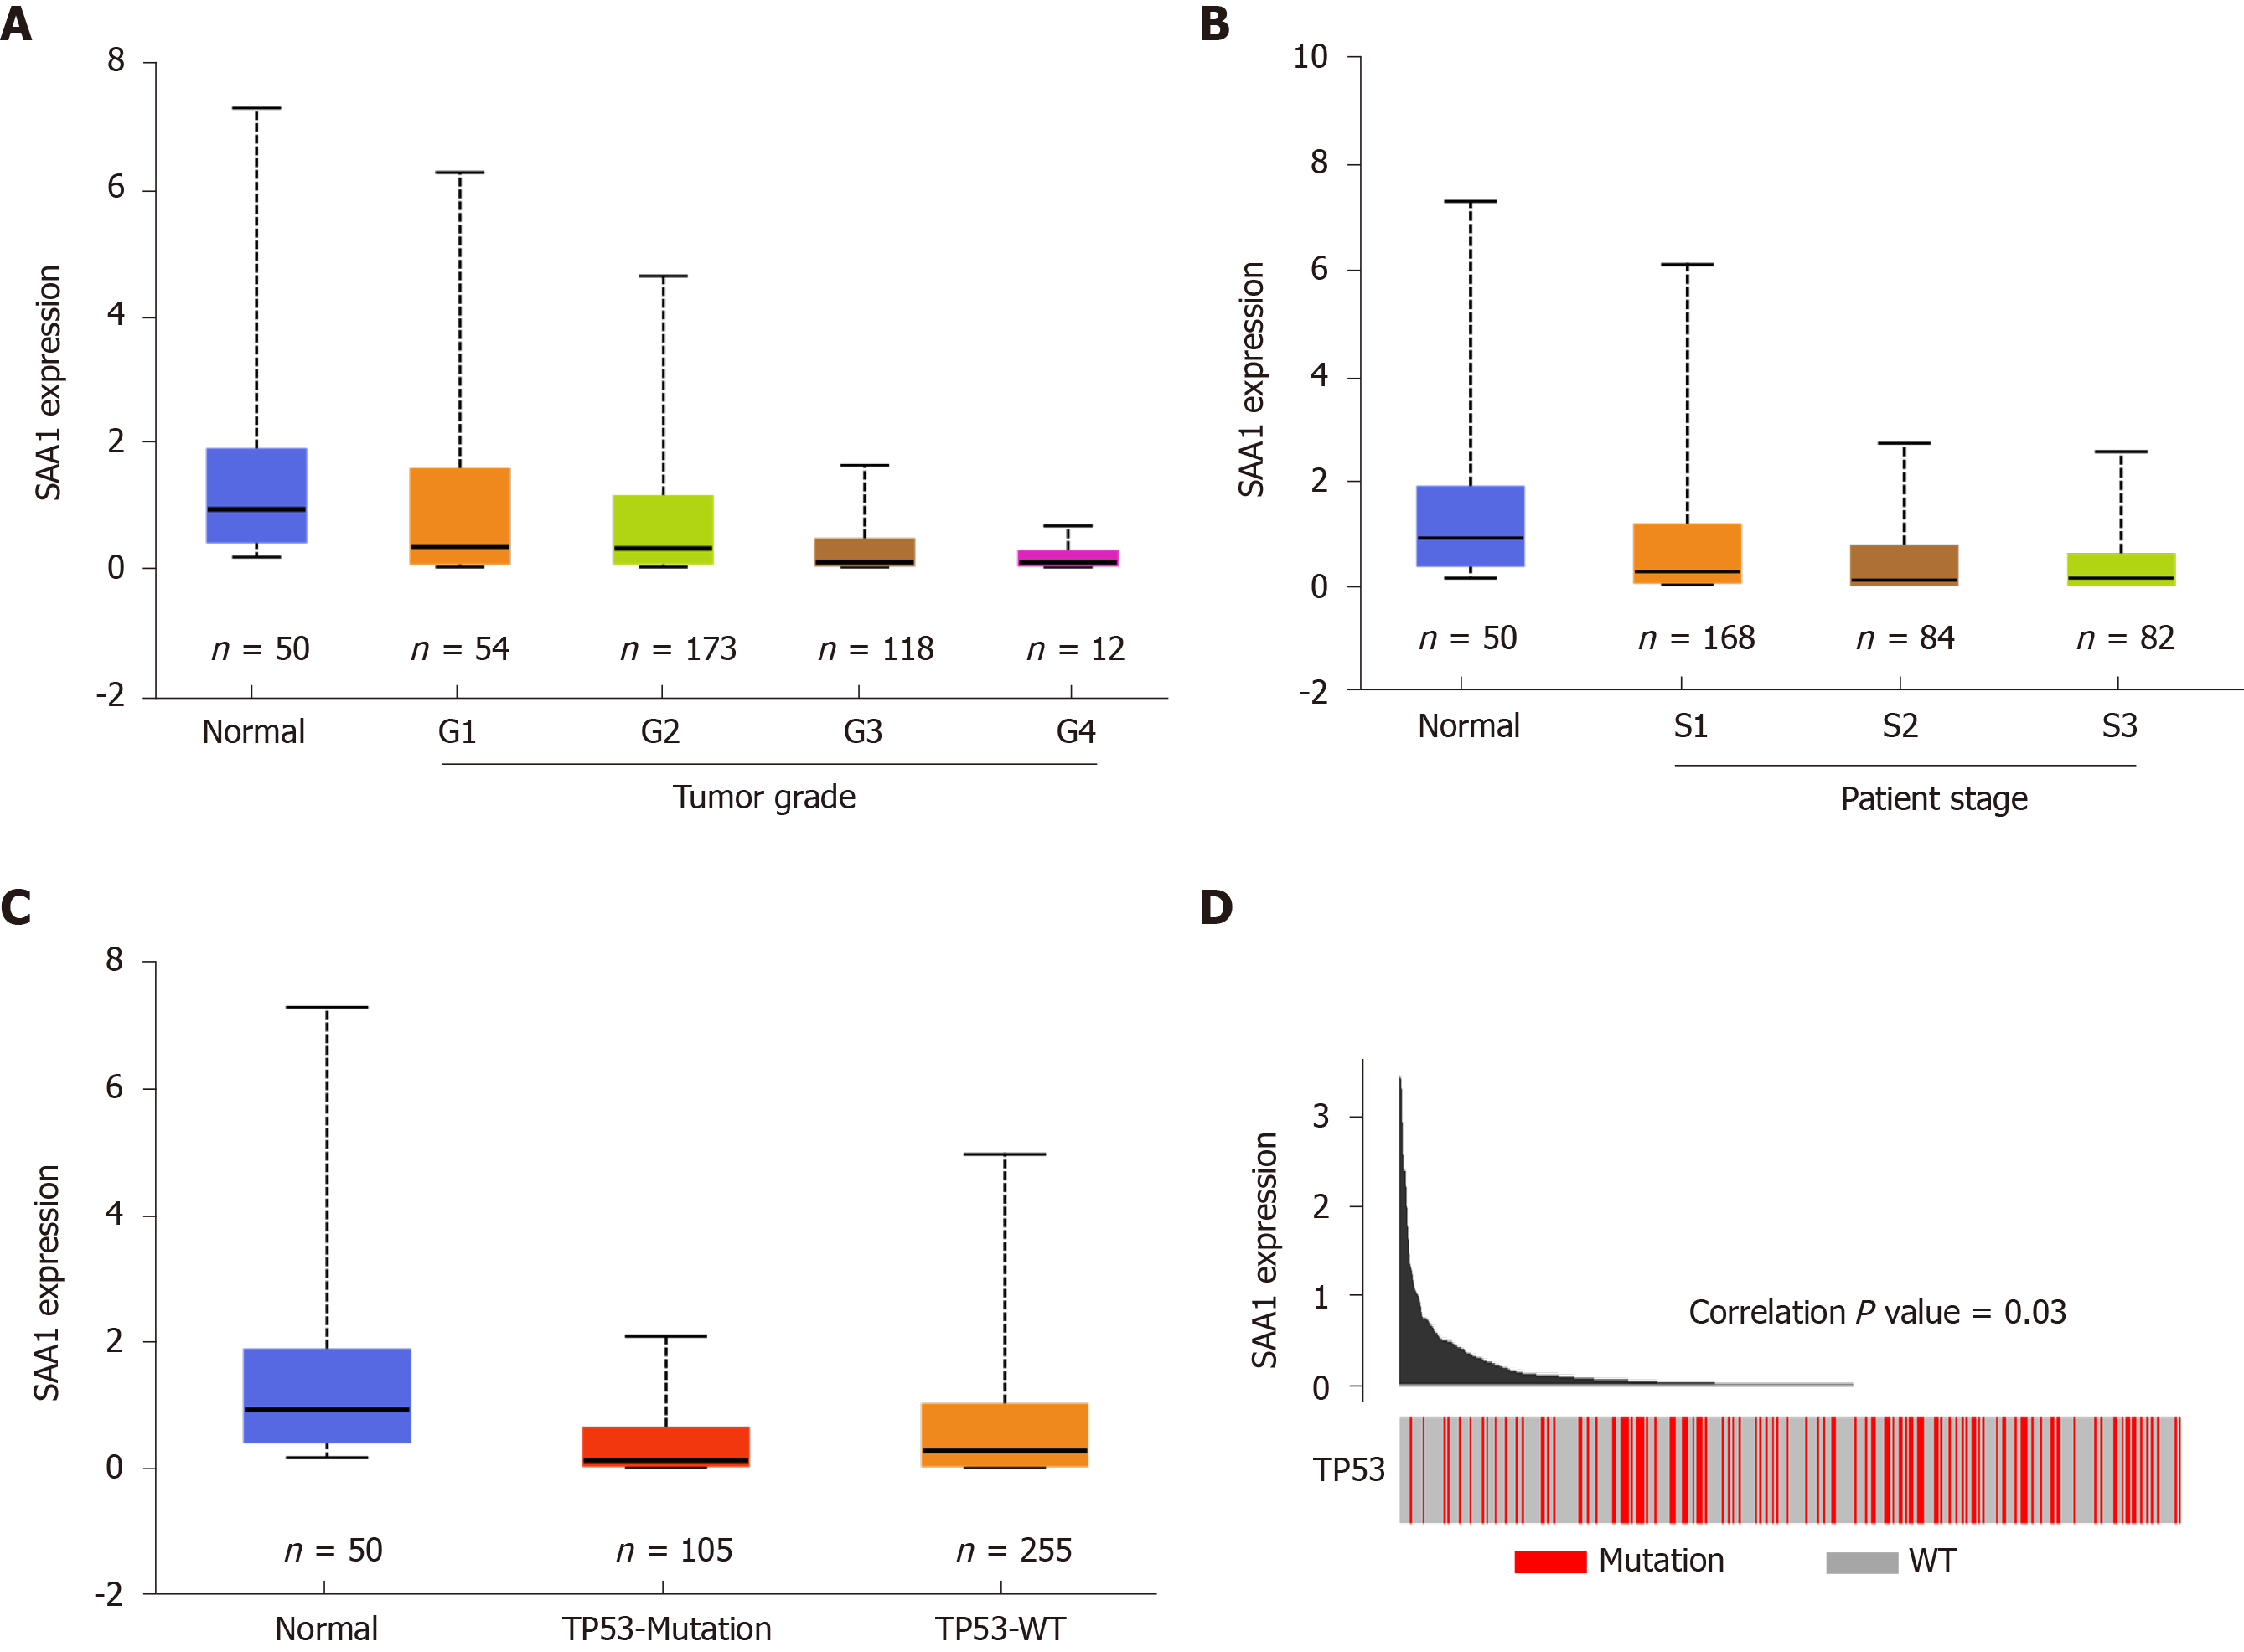
Figure 2 Serum amyloid A1 expression was correlated with hepatocellular carcinoma development.
A: The tumor tissues with different grades and surrounding non-tumor tissues were included to analyze the serum amyloid A1 (SAA1) expression; B: The tumor tissues with different disease stage and non-tumor tissues were conducted with the SAA1 expression analysis; C: The SAA1 expression was analyzed in tumor tissues with TP53 mutation or wild type, the non-tumor tissues were used as control; D: The correlation of SAA1 expression and the TP53 mutation was analyzed in the cancer genome atlas portal. SAA1: Serum amyloid A1; WT: Wild type; G1: Tumor grade 1; G2: Tumor grade 2; G3: Tumor grade 3; G4: Tumor grade 4; S1: Patient disease stage 1; S2: Patient disease stage 2; S3: Patient disease stage 3.
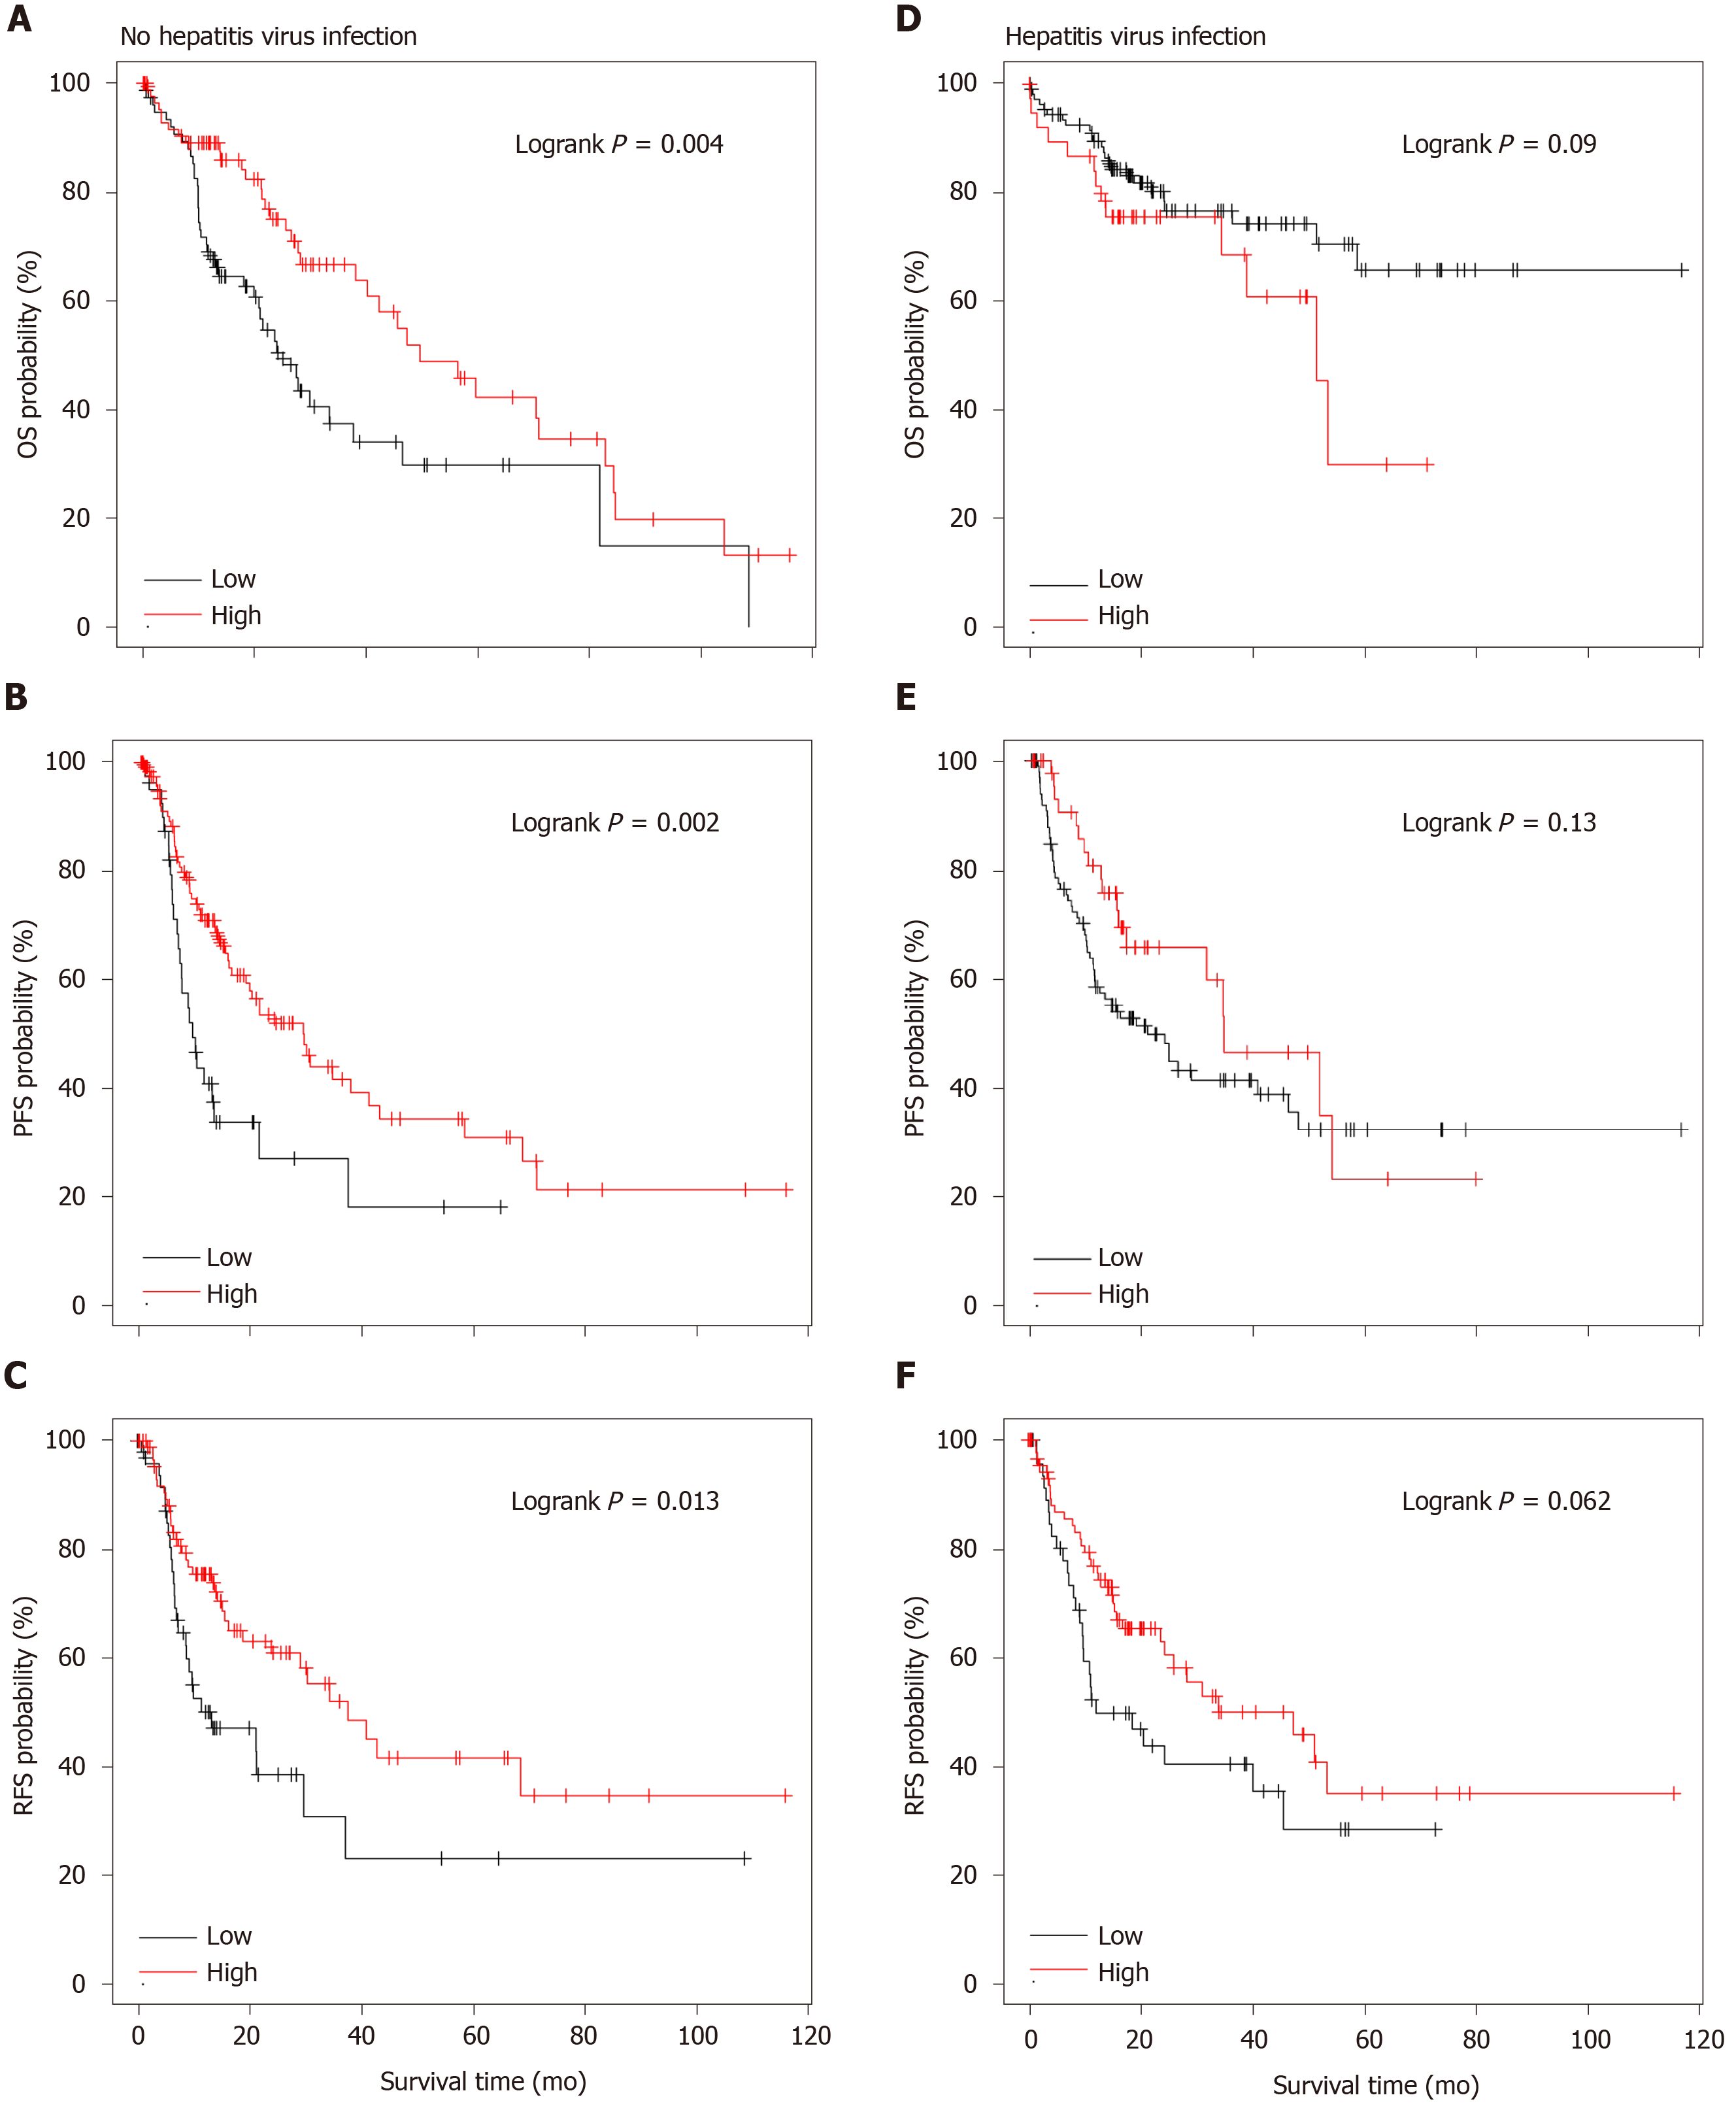
Figure 3 Serum amyloid A1 expression was a specific prognostic biomarker for hepatocellular carcinoma.
A: The patients without hepatitis virus infection were subjected to overall survival (OS); B: Progression-free survival (PFS); C: Recurrence-free survival (RFS) analysis based on SAA1 expression level; D: The patients with hepatitis virus infection were subjected to OS; E: PFS; F: RFS analysis based on SAA1 expression level.
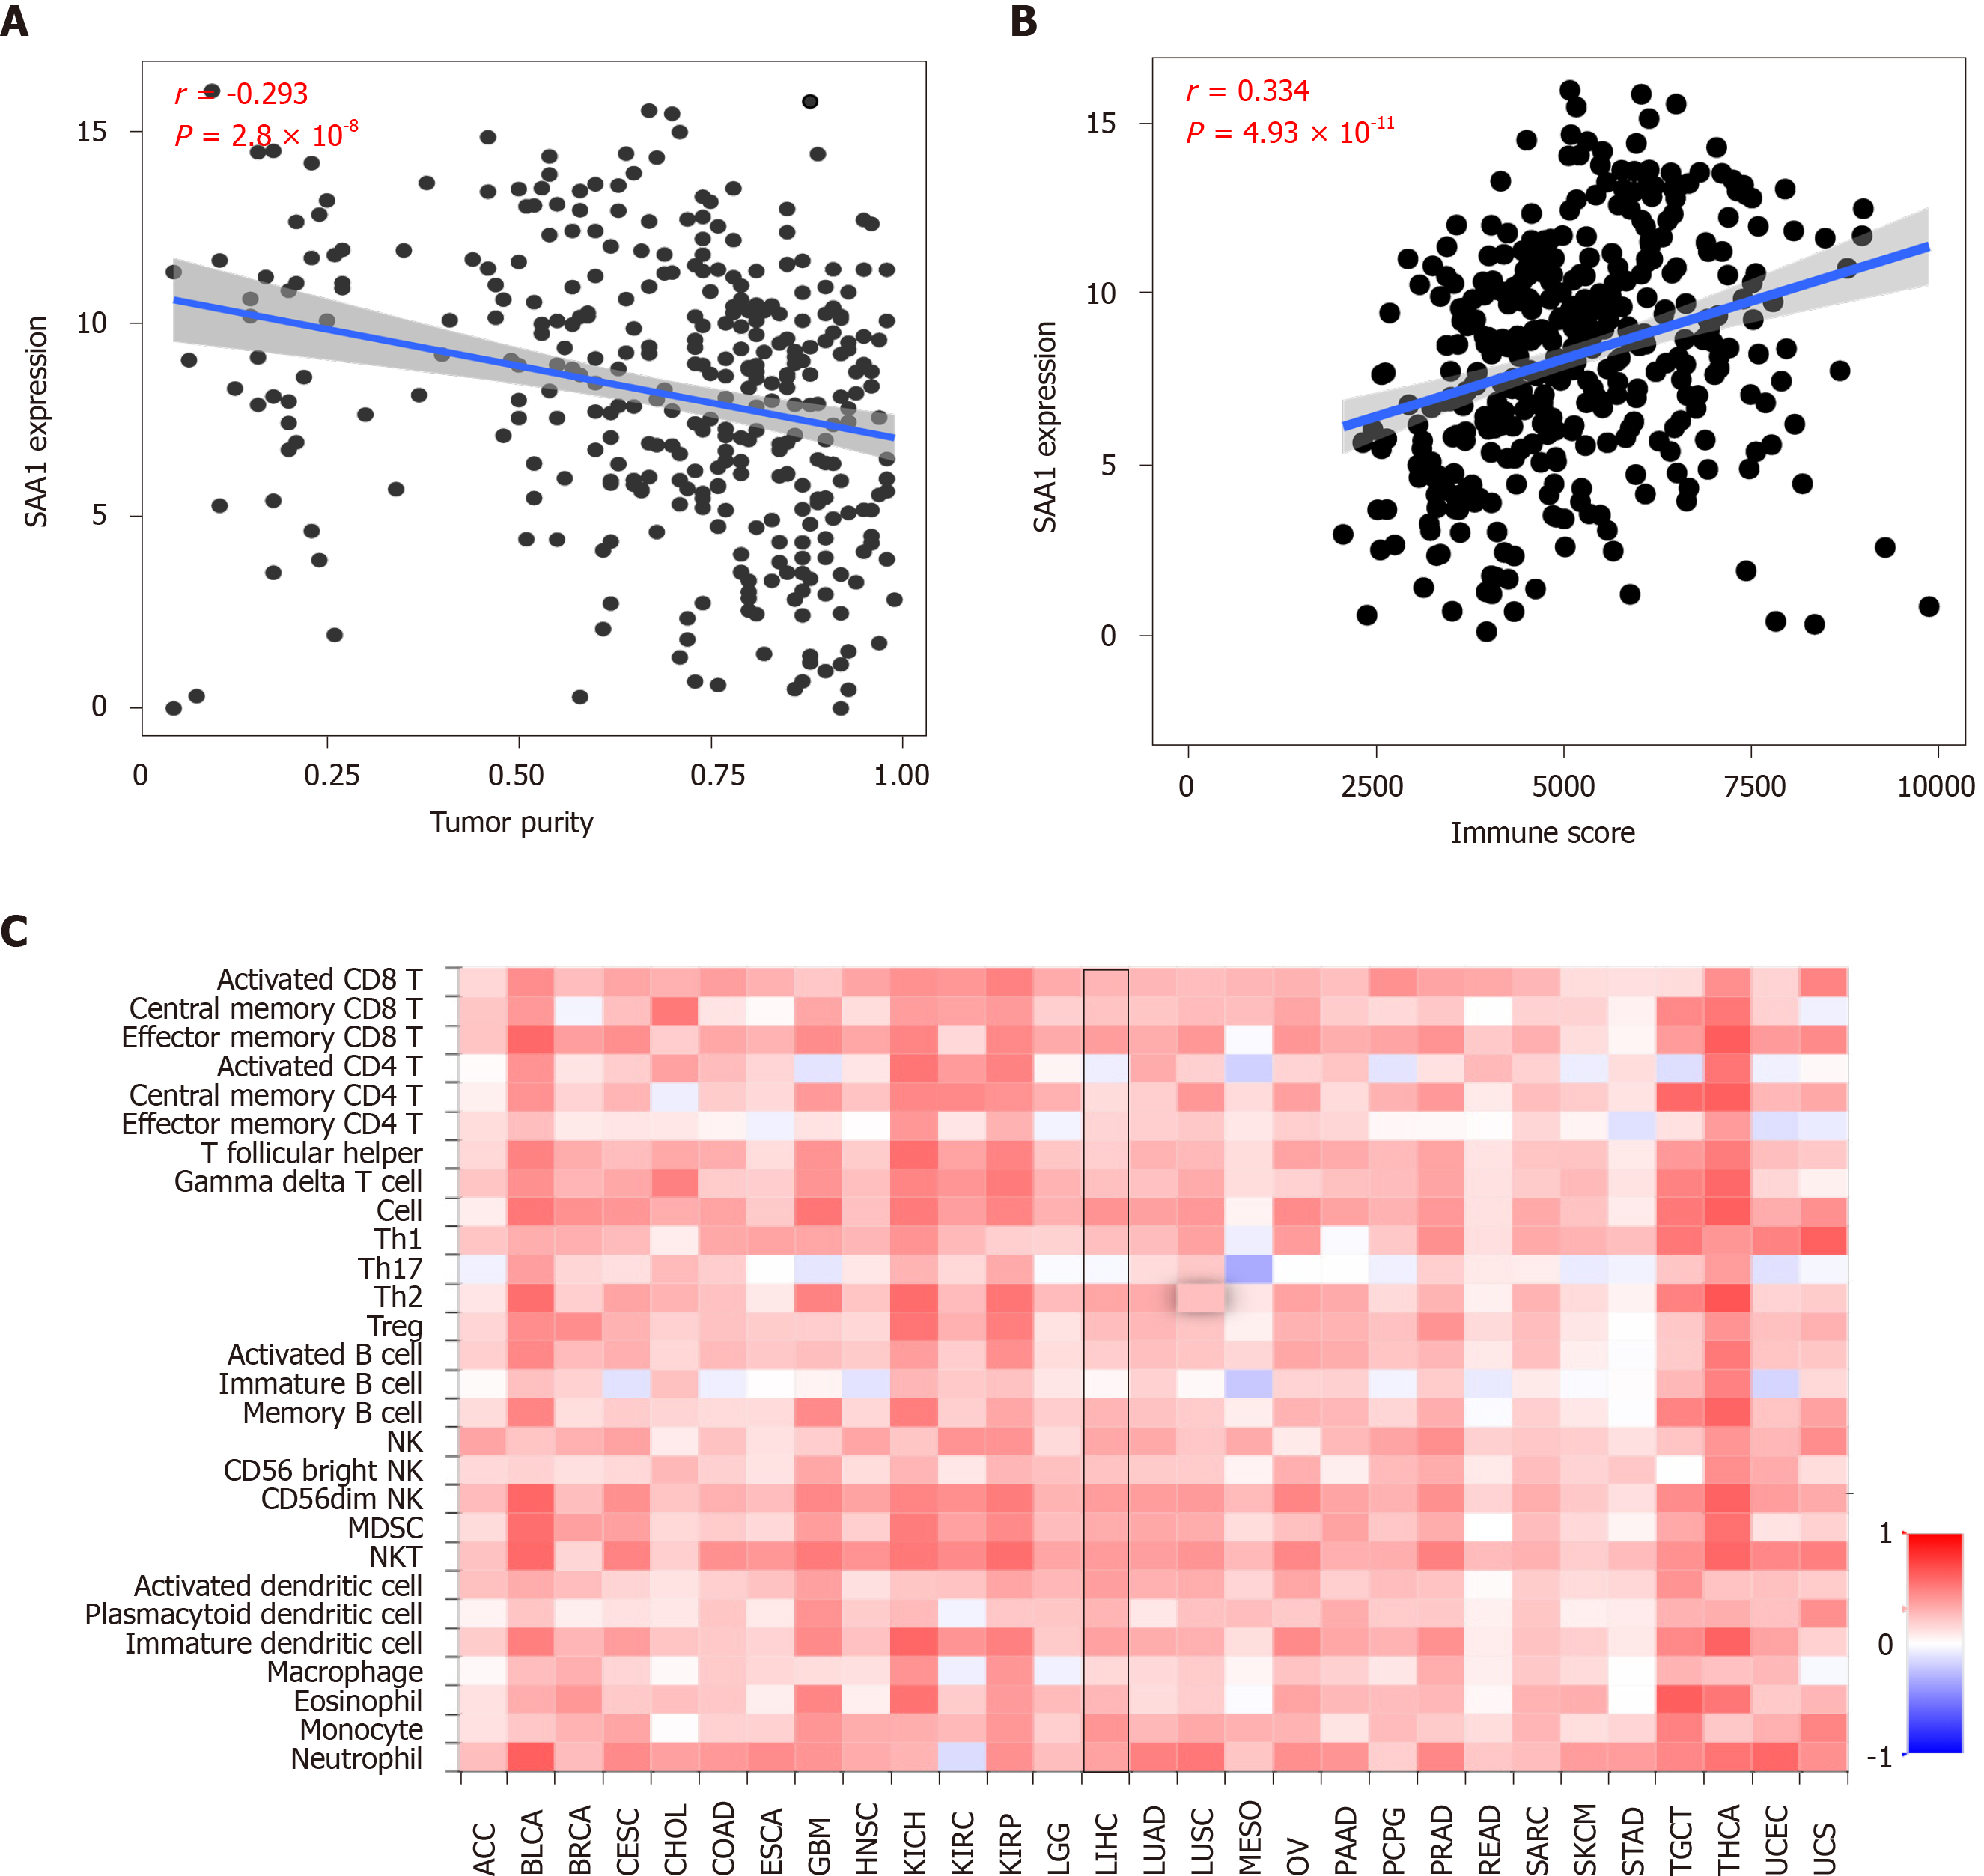
Figure 4 Serum amyloid A1 expression was correlated with immune infiltration in hepatocellular carcinoma.
A: The correlation between serum amyloid A1 (SAA1) expression level and the tumor purity was analyzed with CIBERSORT; B: The correlation between SAA1 expression and the immune score was analyzed with CIBERSORT; C: The correlation between SAA1 expression and tumor-infiltrating lymphocytes across human cancer was conducted in TISIDB with Spearman method. SAA1: Serum amyloid A1; TILs: Tumor-infiltrating lymphocytes; NK: Natural killer cell; NKT: Natural killer T cell; ACC: Adrenocortical carcinoma; BLCA: Bladder Urothelial Carcinoma; BRCA: Breast invasive carcinoma; CESC: Cervical squamous cell carcinoma and endocervical adenocarcinoma; CHOL: Cholangiocarcinoma; COAD: Colon adenocarcinoma; ESCA: Esophageal carcinoma; GBM: Glioblastoma multiforme; HNSC: Head and Neck squamous cell carcinoma; KICH: Kidney chromophobe; KIRC: Kidney renal clear cell carcinoma; KIRP: Kidney renal papillary cell carcinoma; LGG: Brain lower-grade glioma; LIHC: Liver hepatocellular carcinoma; LUAD: Lung adenocarcinoma; LUSC: Lung squamous cell carcinoma; MESO: Mesothelioma; OV: Ovarian serous cystadenocarcinoma; PAAD: Pancreatic adenocarcinoma; PCPG: Pheochromocytoma and paraganglioma; PRAD: Prostate adenocarcinoma; READ: Rectum adenocarcinoma; SARC: Sarcoma; SKCM: Skin cutaneous melanoma; STAD: Stomach adenocarcinoma; TGCT: Testicular germ cell tumors; THCA: Thyroid carcinoma; UCEC: Uterine corpus endometrial carcinoma; UCS: Uterine carcinosarcoma.
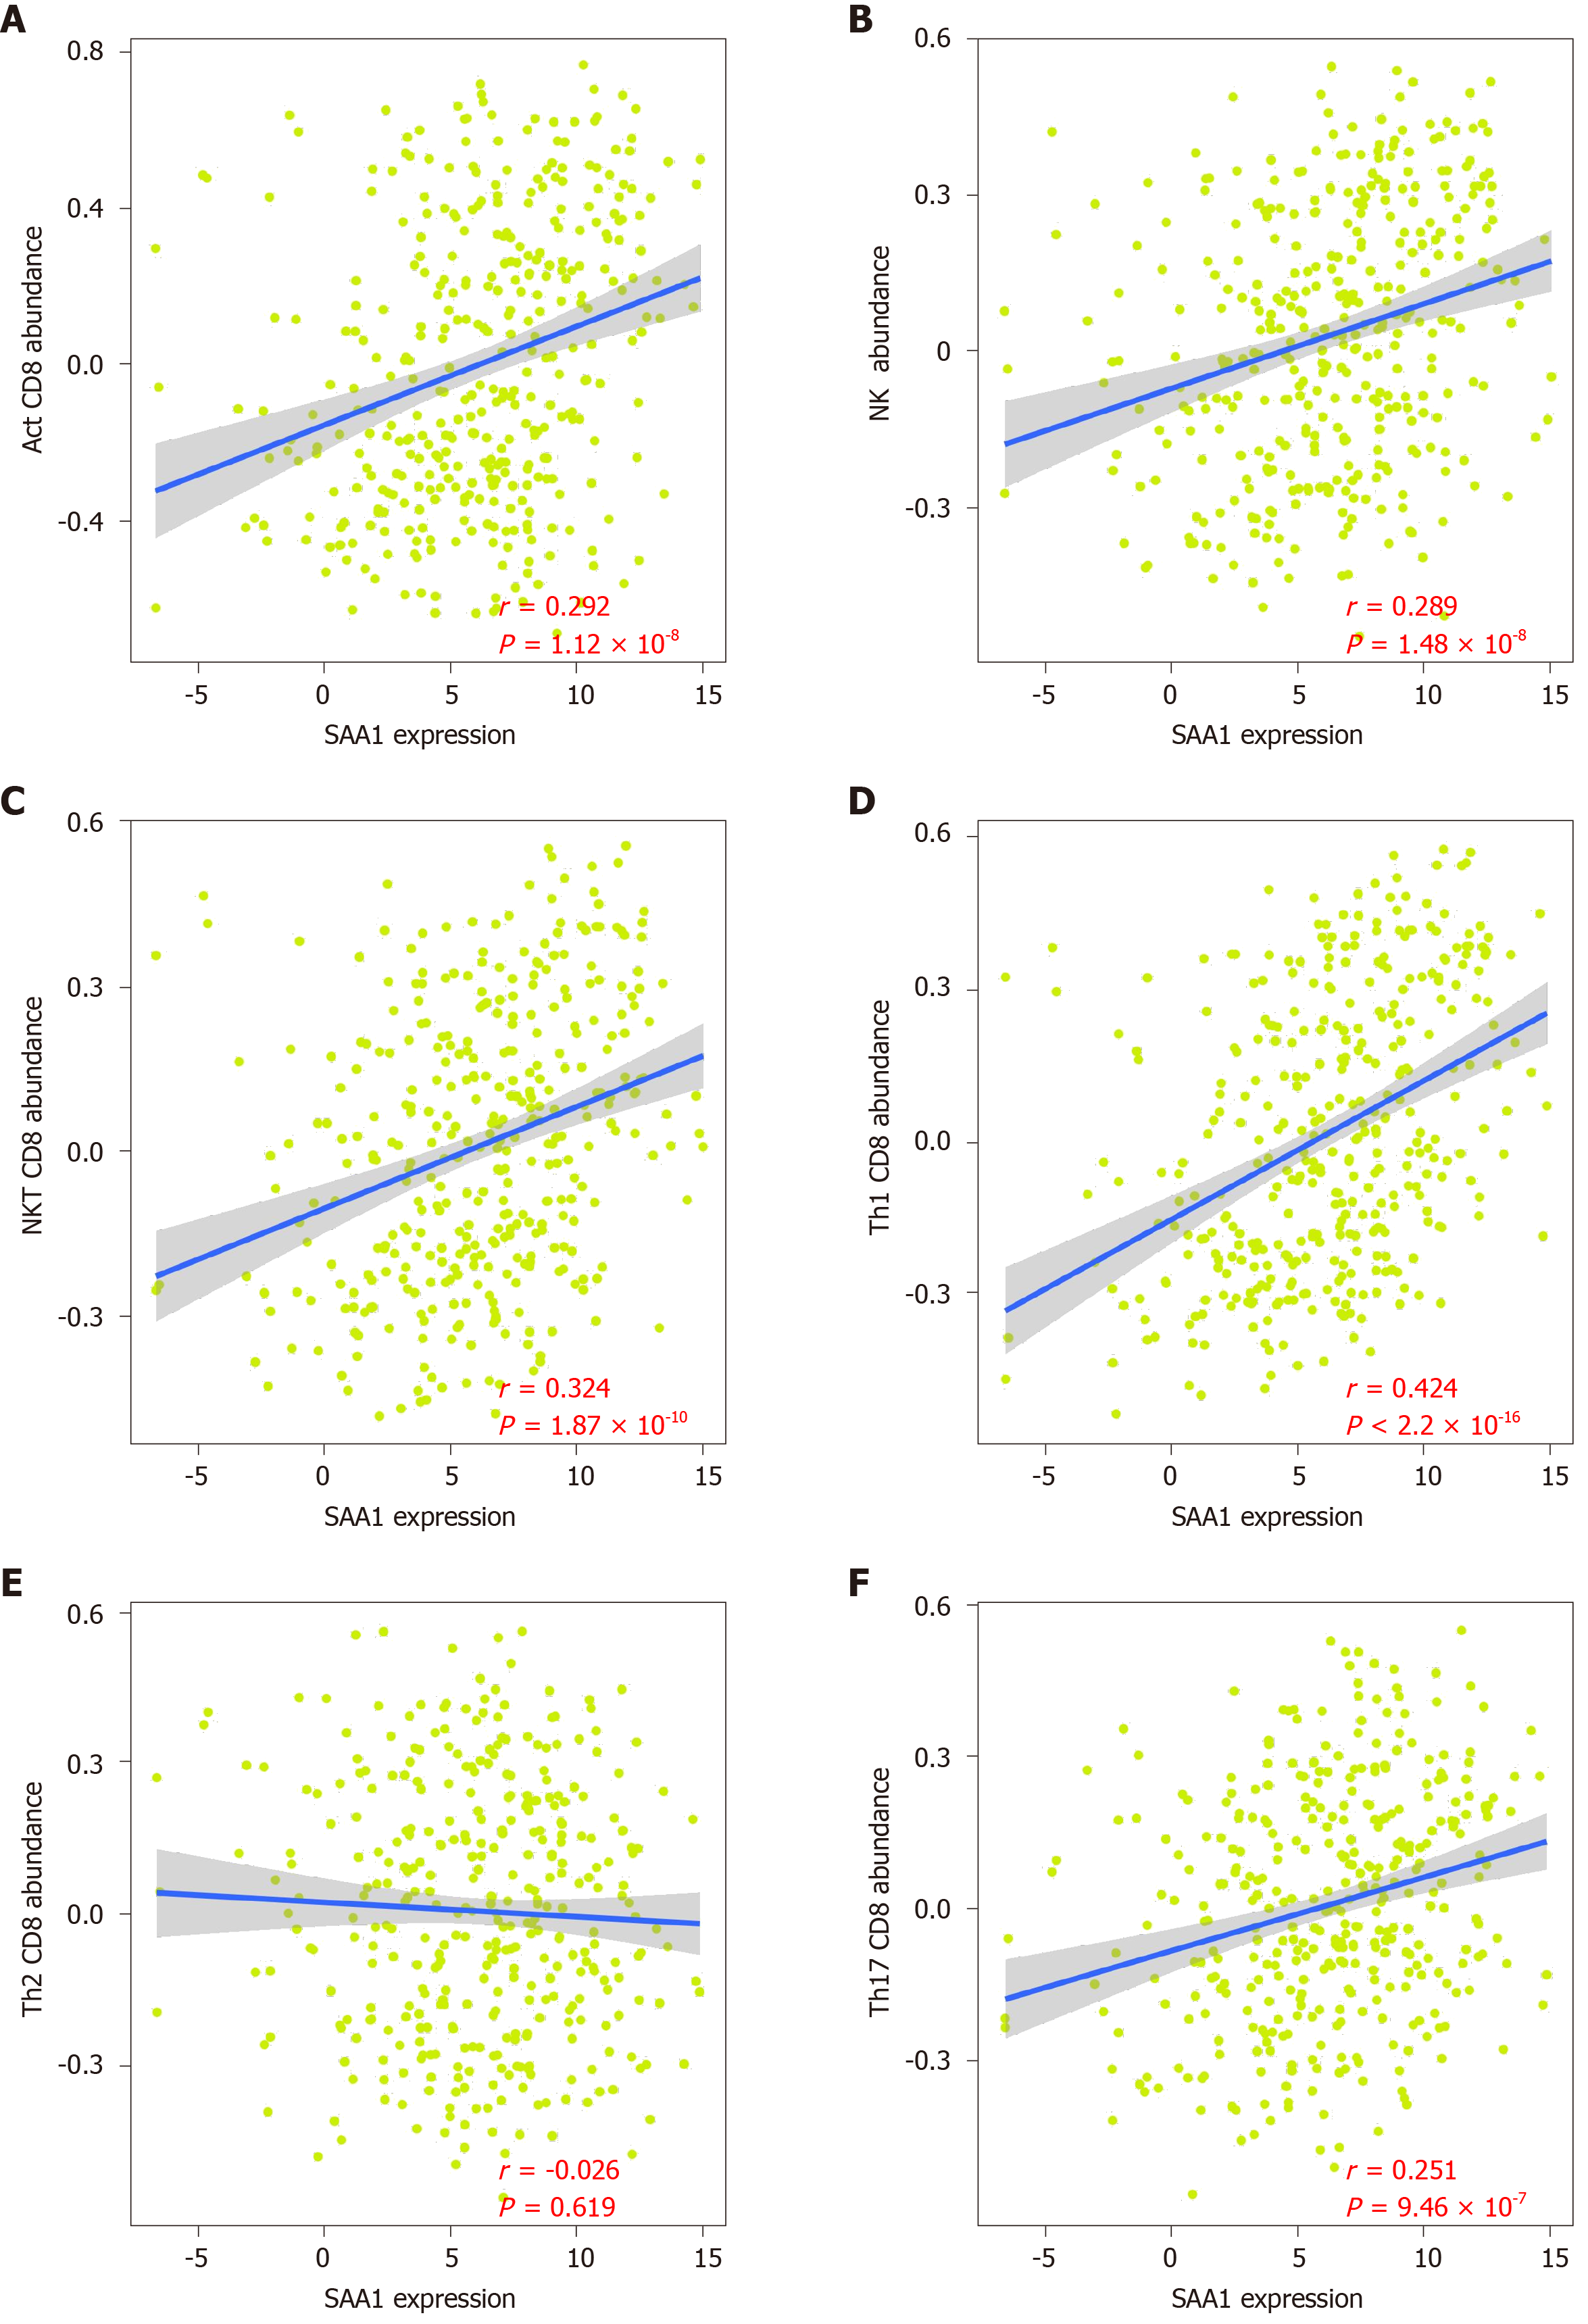
Figure 5 The association between serum amyloid A1 expression and immune cell abundance in hepatocellular carcinoma.
A: A total of 373 hepatocellular carcinoma samples were included to analyze the correlation between SAA1 expression and activated CD8 T cell; B: Natural killer (NK) cell; C: Natural killer T (NKT) cell; D: Th1; E: Th2; F: Th17 cells abundance. SAA1: Serum amyloid A1.
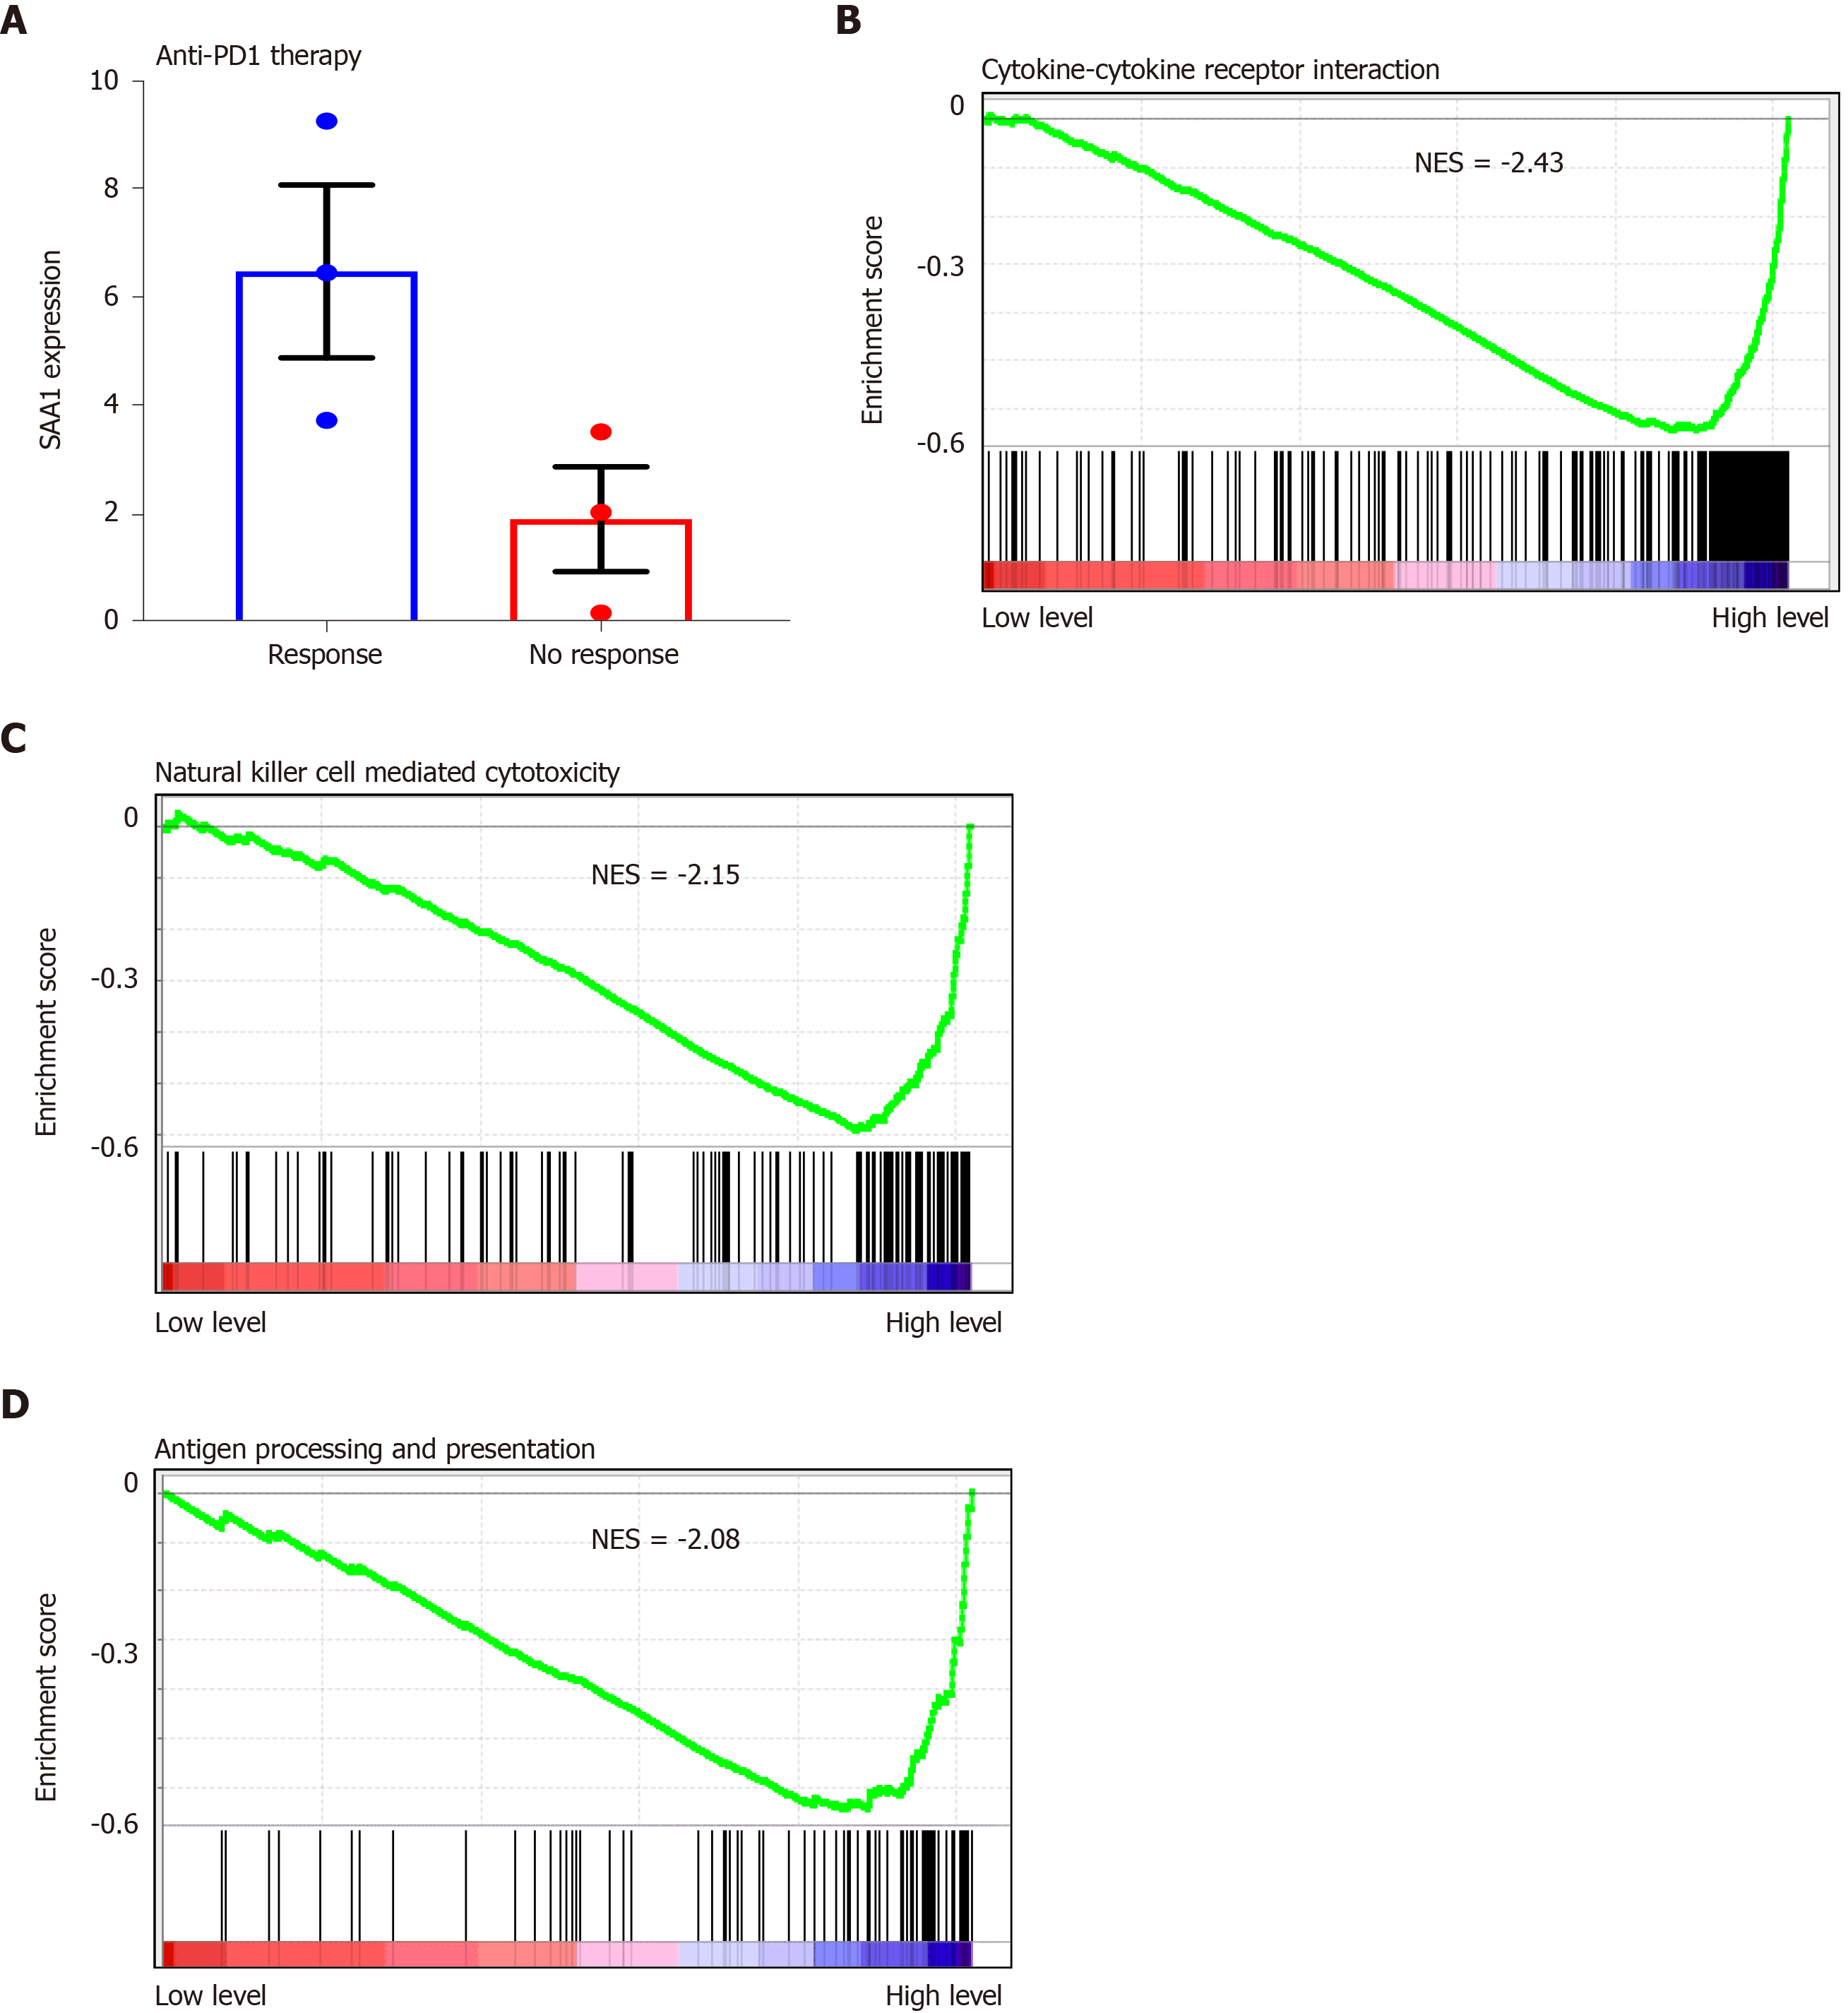
Figure 6 Low serum amyloid A1 expression was negatively correlated with the anti-immunity signaling.
A: GSE125336 was used to evaluate the serum amyloid A1 expression in patients who were responsive and resistant to the anti-PD1 antibody; B-D: The gene set enrichment analysis in hepatocellular carcinoma revealed the top three pathways with KEGG. SAA1: Serum amyloid A1; NES: Normalized enrichment score; GSEA: Gene set enrichment analysis.
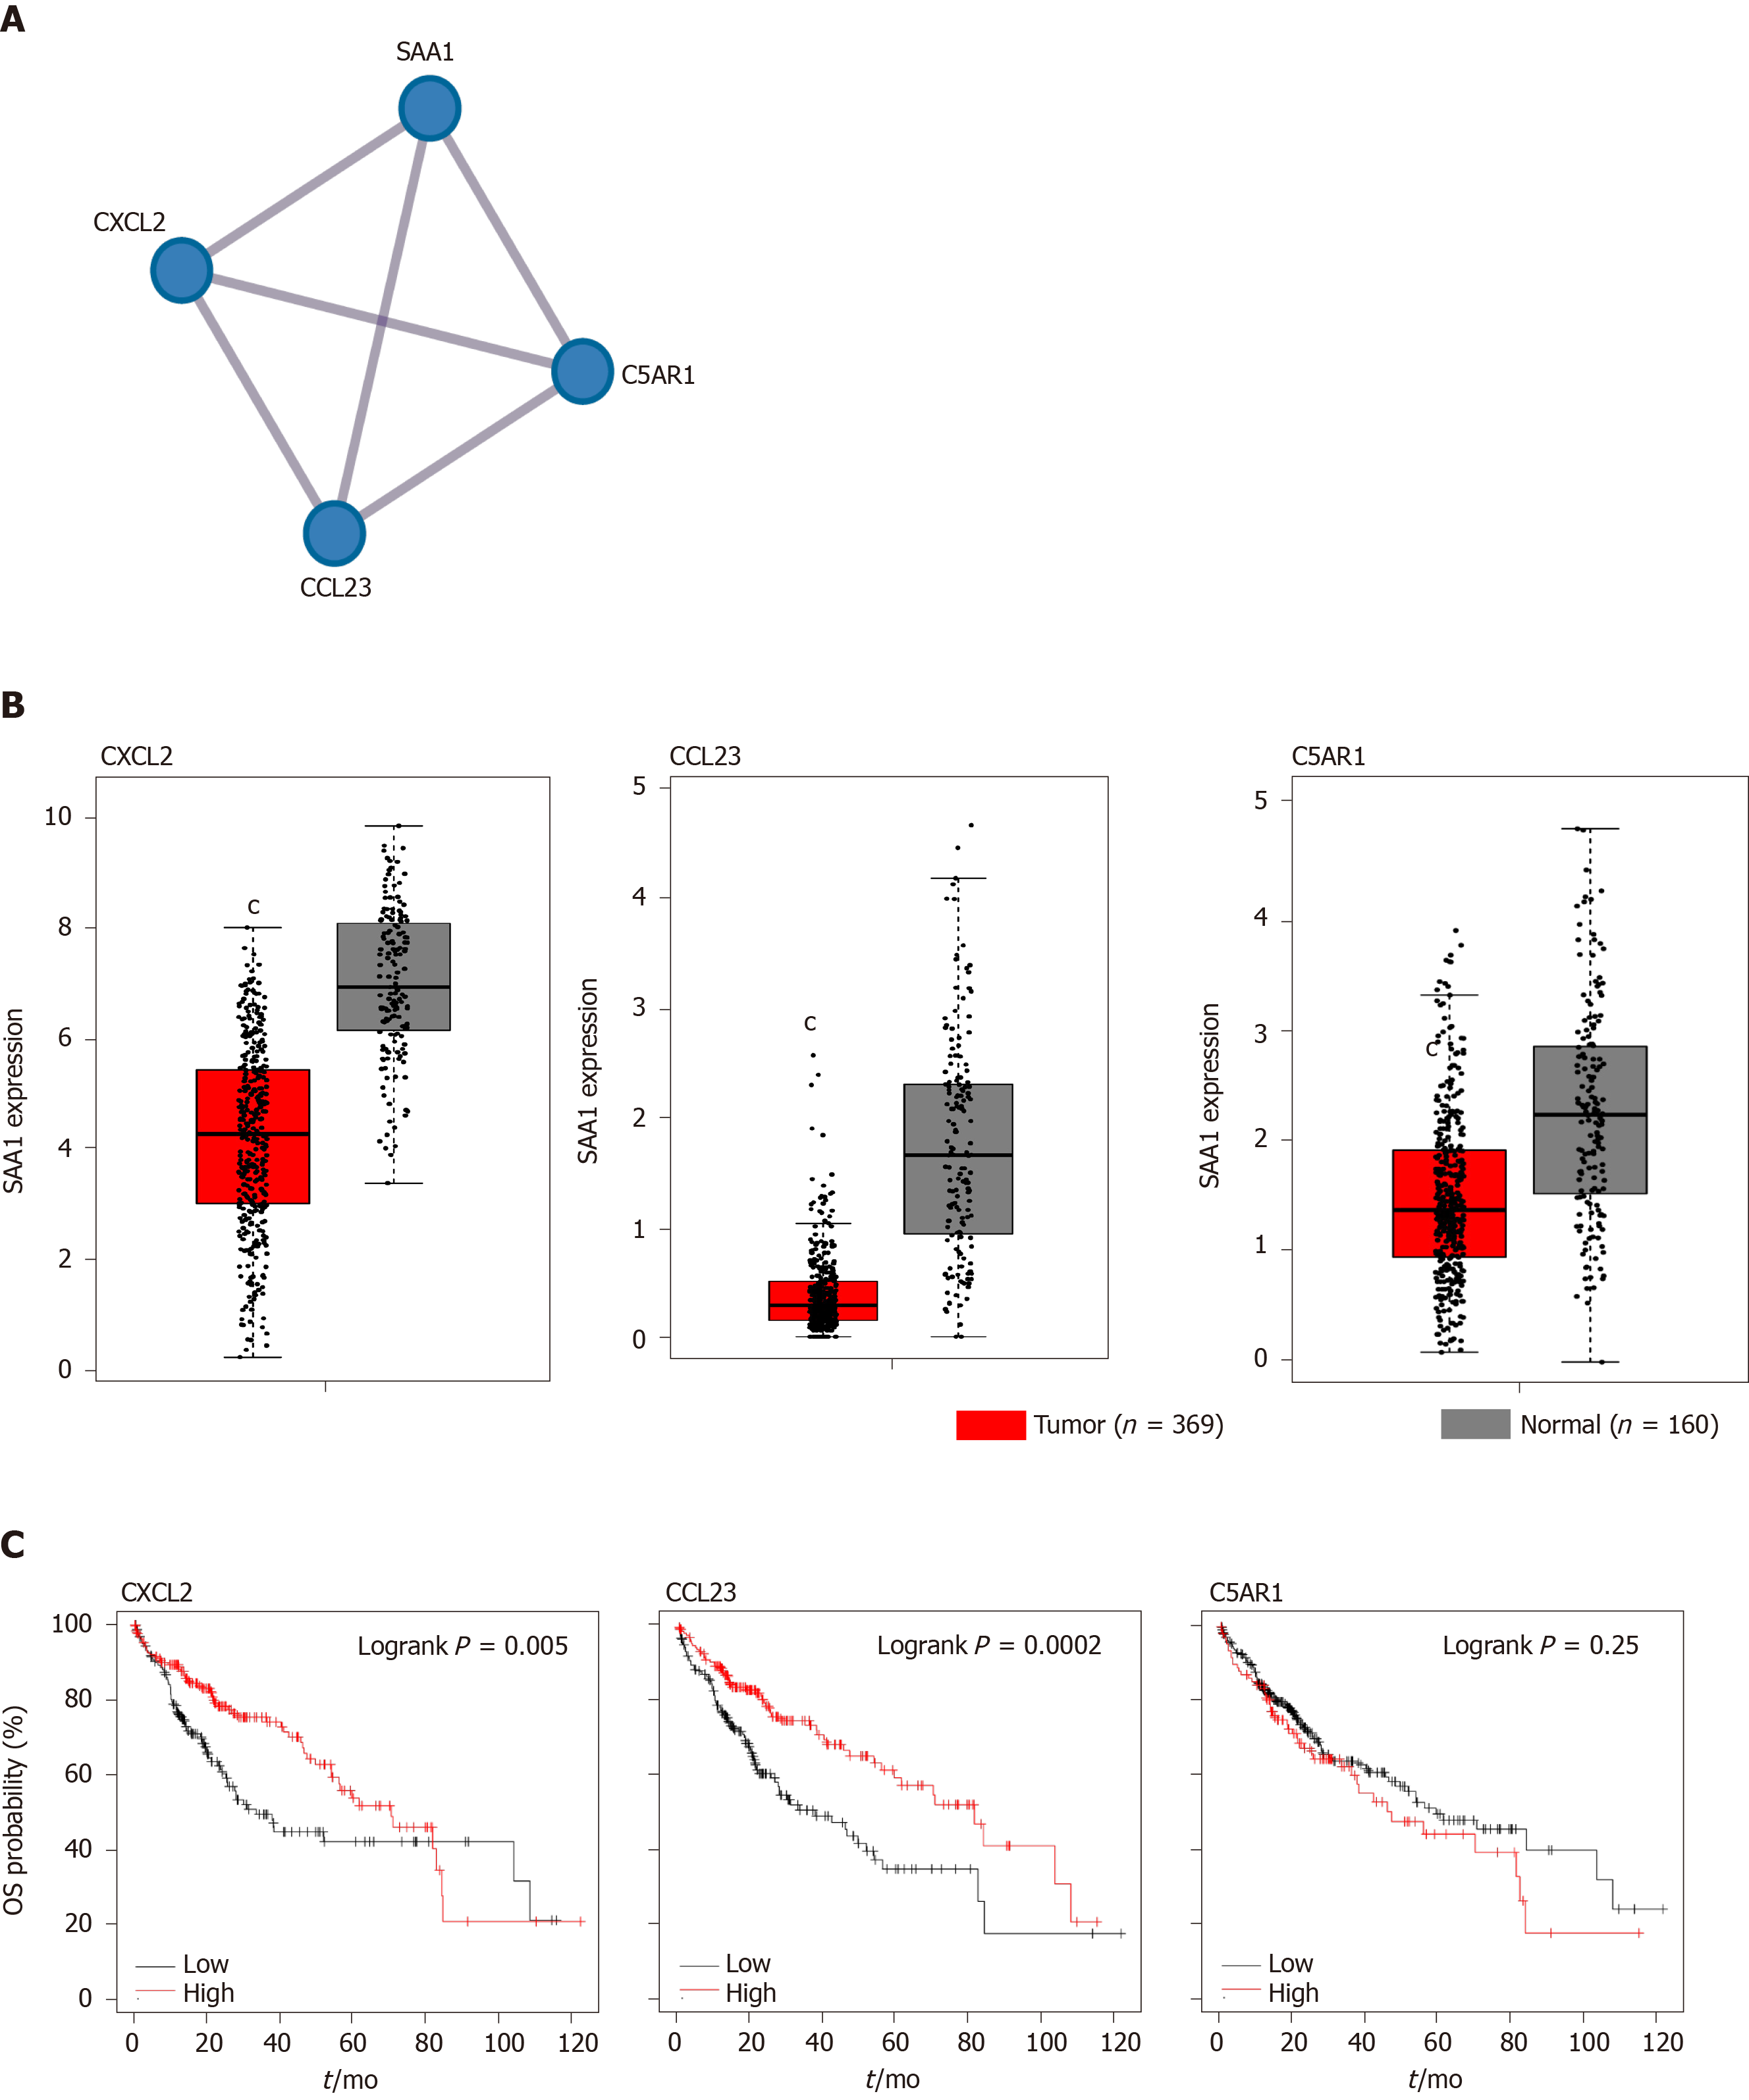
Figure 7 The two signature genes interacted with serum amyloid A1 and acted as a prognostic marker for hepatocellular carcinoma.
A: The similar genes of serum amyloid A1 were achieved in GEPIA, and the similar genes were conducted in protein-protein interaction analysis; B: The expression of CXCL12, CCL23, and C5AR1 in hepatocellular carcinoma and non-tumor tissues were analyzed in GEPIA portal; C: The overall survival analysis was conducted based on the expression level of CXCL12, CCL23, and C5AR1. SAA1: Serum amyloid A1; OS: Overall survival; CXCL2: C-X-C motif chemokine ligand 2; CCL23: C-C motif chemokine ligand 23; C5AR1: Complement C5a receptor 1.
- Citation: Zhang W, Kong HF, Gao XD, Dong Z, Lu Y, Huang JG, Li H, Yang YP. Immune infiltration-associated serum amyloid A1 predicts favorable prognosis for hepatocellular carcinoma. World J Gastroenterol 2020; 26(35): 5287-5301
- URL: https://www.wjgnet.com/1007-9327/full/v26/i35/5287.htm
- DOI: https://dx.doi.org/10.3748/wjg.v26.i35.5287


