Copyright
©The Author(s) 2020.
World J Gastroenterol. Aug 7, 2020; 26(29): 4302-4315
Published online Aug 7, 2020. doi: 10.3748/wjg.v26.i29.4302
Published online Aug 7, 2020. doi: 10.3748/wjg.v26.i29.4302
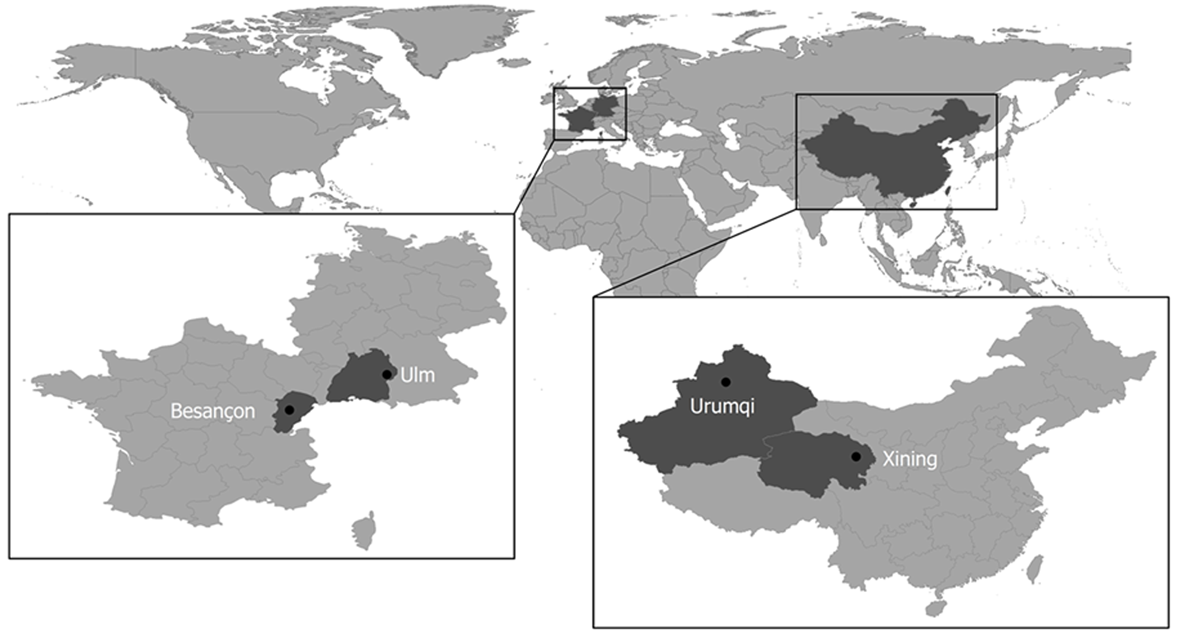
Figure 1 Geographical locations of the centres.
The map shows the four centers in China and Europe: Xining in central China and Urumqi in the northwest of the country; Besançon in eastern France, and Ulm in southwestern Germany.
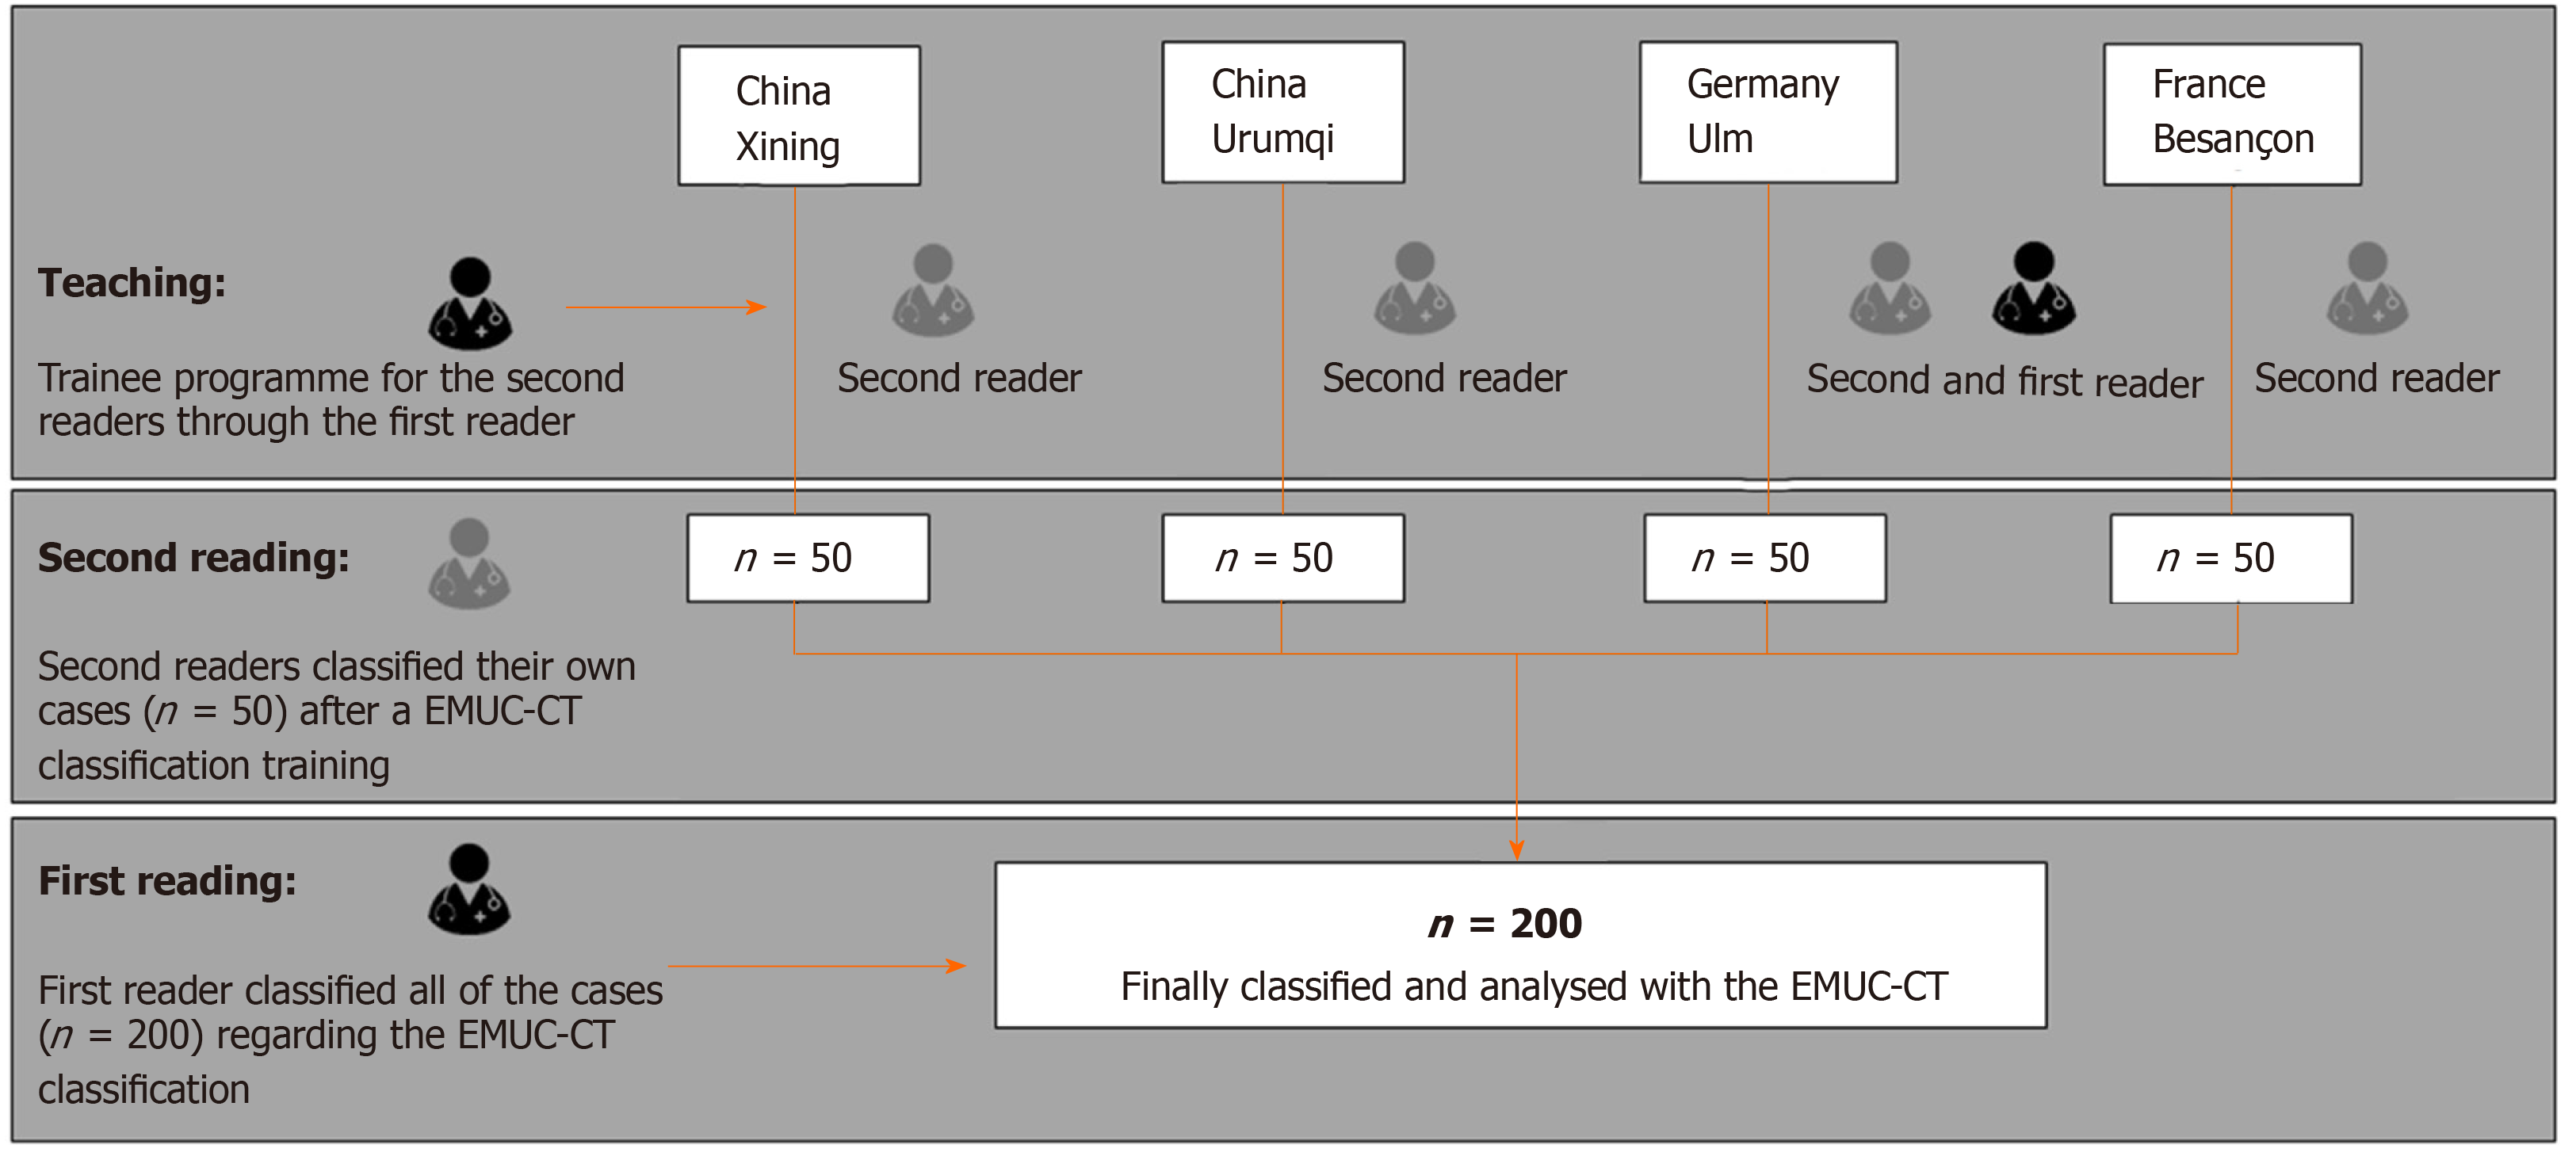
Figure 2 Flowchart and study design.
EMUC-CT: Echinococcus multilocularis Ulm classification-computed tomography.
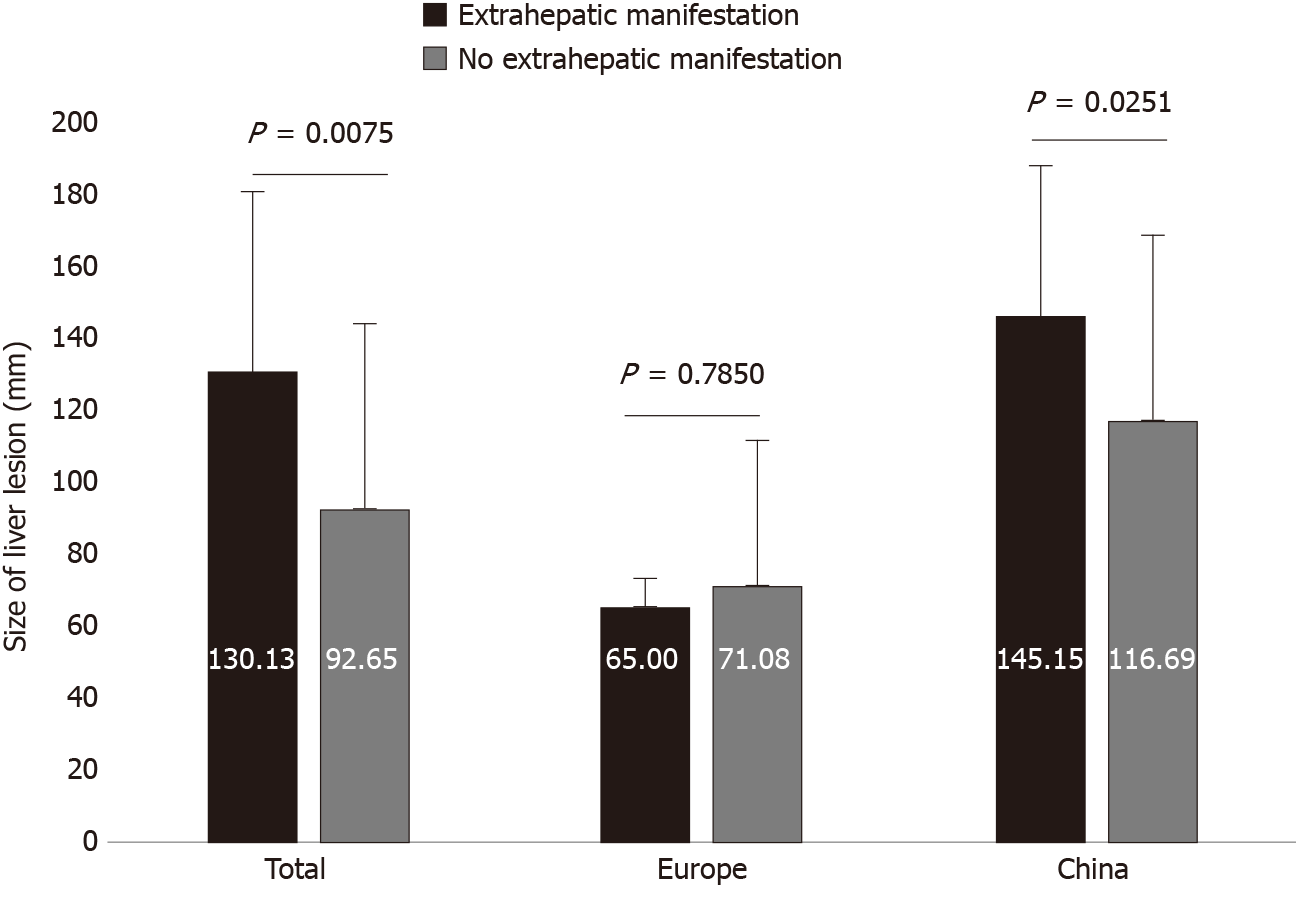
Figure 3 Measure of dispersion for liver lesion sizes stratified according to extrahepatic manifestation in China vs Europe.
P < 0.05 was evaluated as statistically significant.
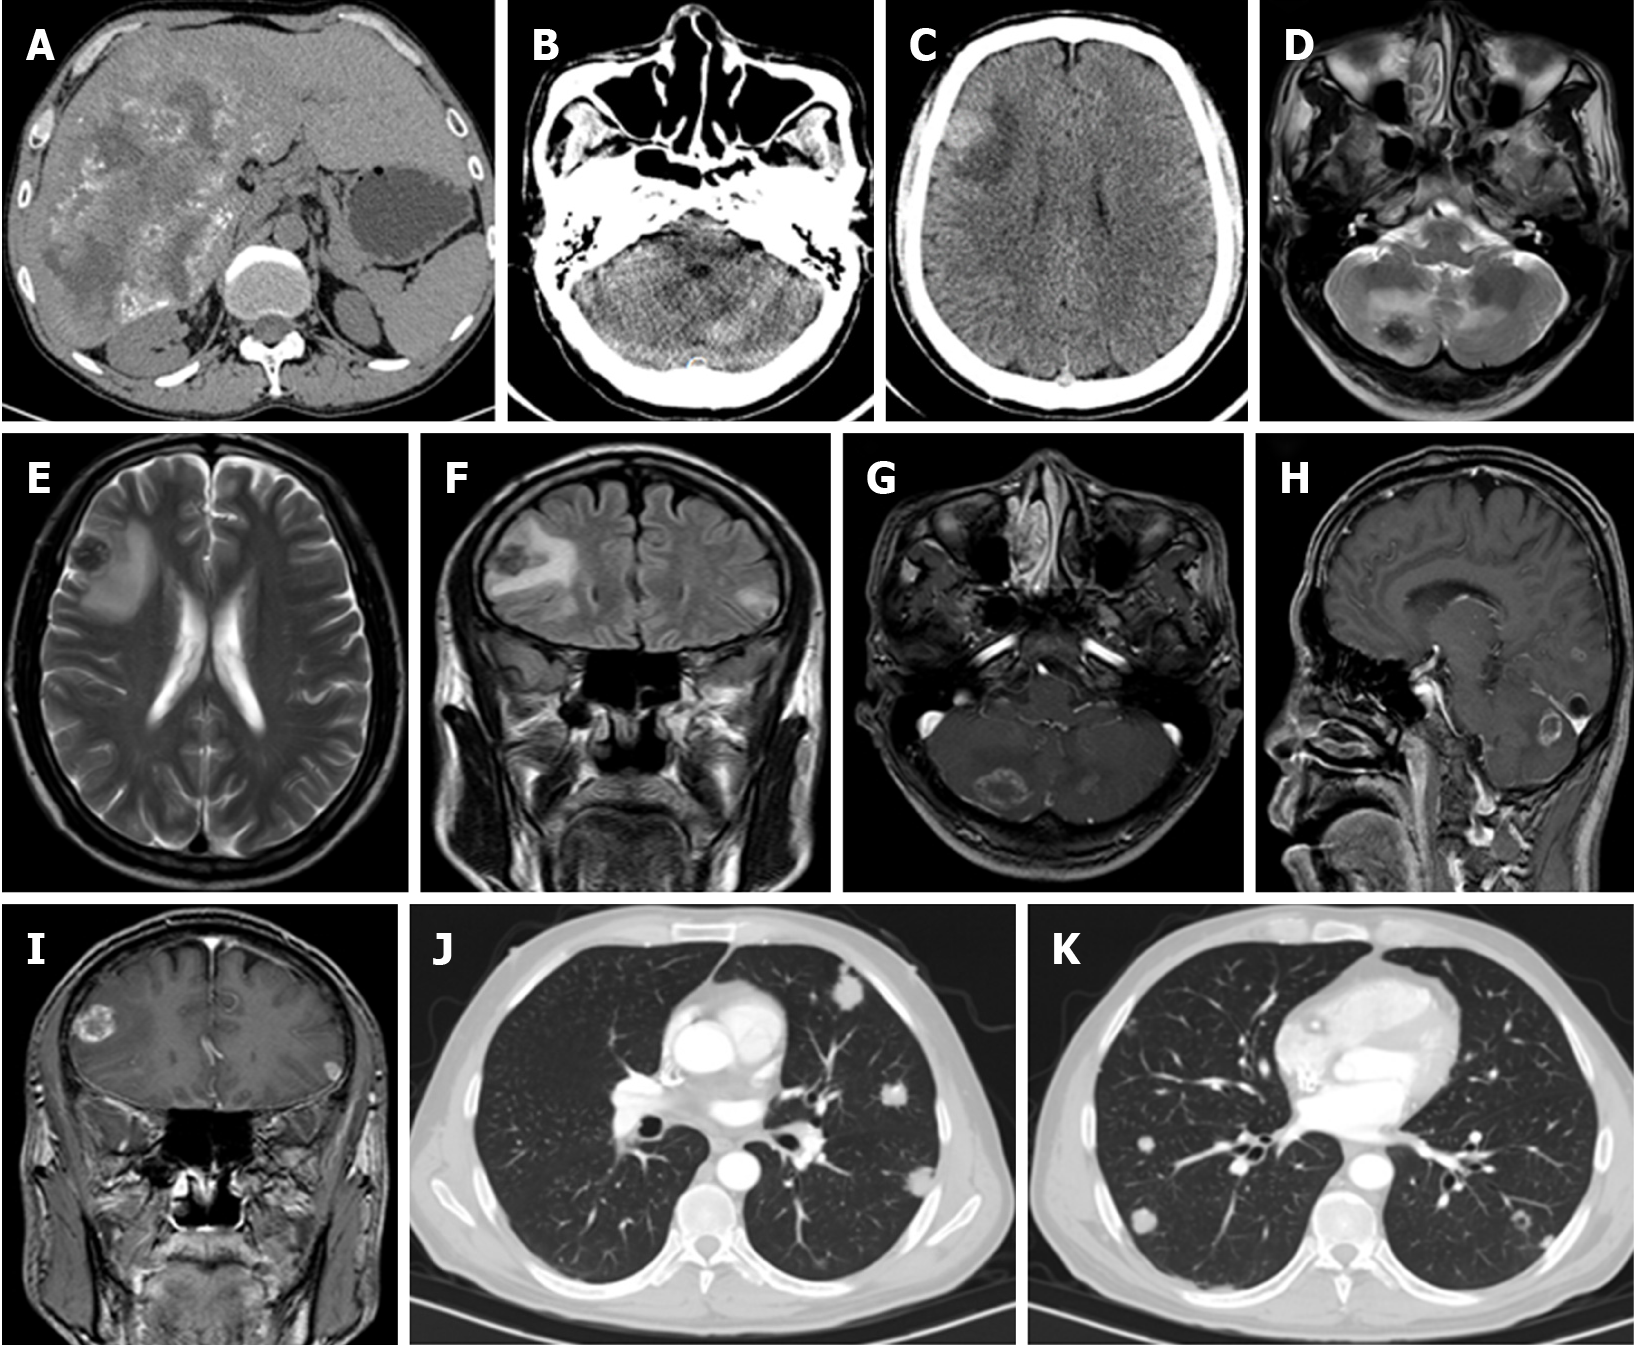
Figure 4 Male, age 52 years, Han Chinese.
A: Abdominal computed tomography (CT) showing the hepatic alveolar echinococcosis lesion in the right liver lobe. echinococcus multilocularis Ulm classification-CT Type IIIb with more solid portions at the edge; B, C: Cranial CT scan showing multiple bilateral cerebellar hemisphere and frontal lobe calcified masses with surrounding edema; D, E: Coronal T2-weighted magnetic resonance imaging (MRI) showing multiple lesions with associated edema; F: Fluid-attenuated inversion recovery MRI showing two lesions with low signal intensity and surrounding edema; G-I: T1-weighted contrast-enhanced MRI showing nodular enhancement of the lesion; J, K: Chest CT scan showing multiple irregular solid nodules in both lungs and some lesions with “empty bubble sign” .
Figure 5 Male, age 53 years, Tibetan.
A, B: Echinococcus multilocularis Ulm classification-computed tomography type IIIb with more solid portions at the edge. The images indicate invasion of the right hepatic vein and inferior vena cava. middle hepatic vein and bile duct at the primary and secondary hilum porta hepatis; C: Multiple cysts surrounded by necrosis and an intense granulomatous reaction characterized by epithelioid cells, multinucleated giant cells, and infiltration by lymphocytes (hematoxylin and eosin, original magnification 40 x).
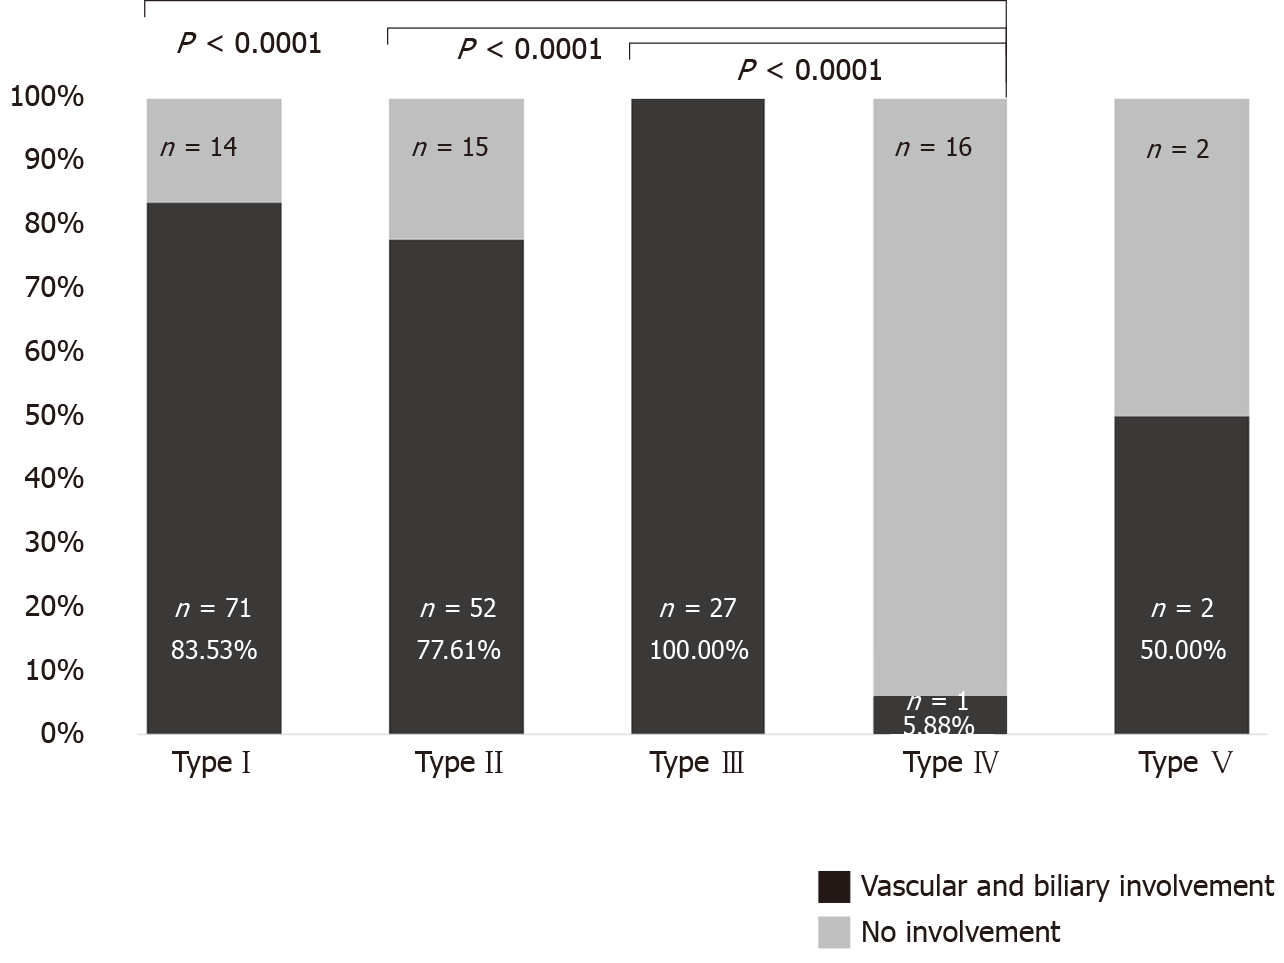
Figure 6 Distribution of primary morphology types depending on vascular and biliary involvement and non-involvement.
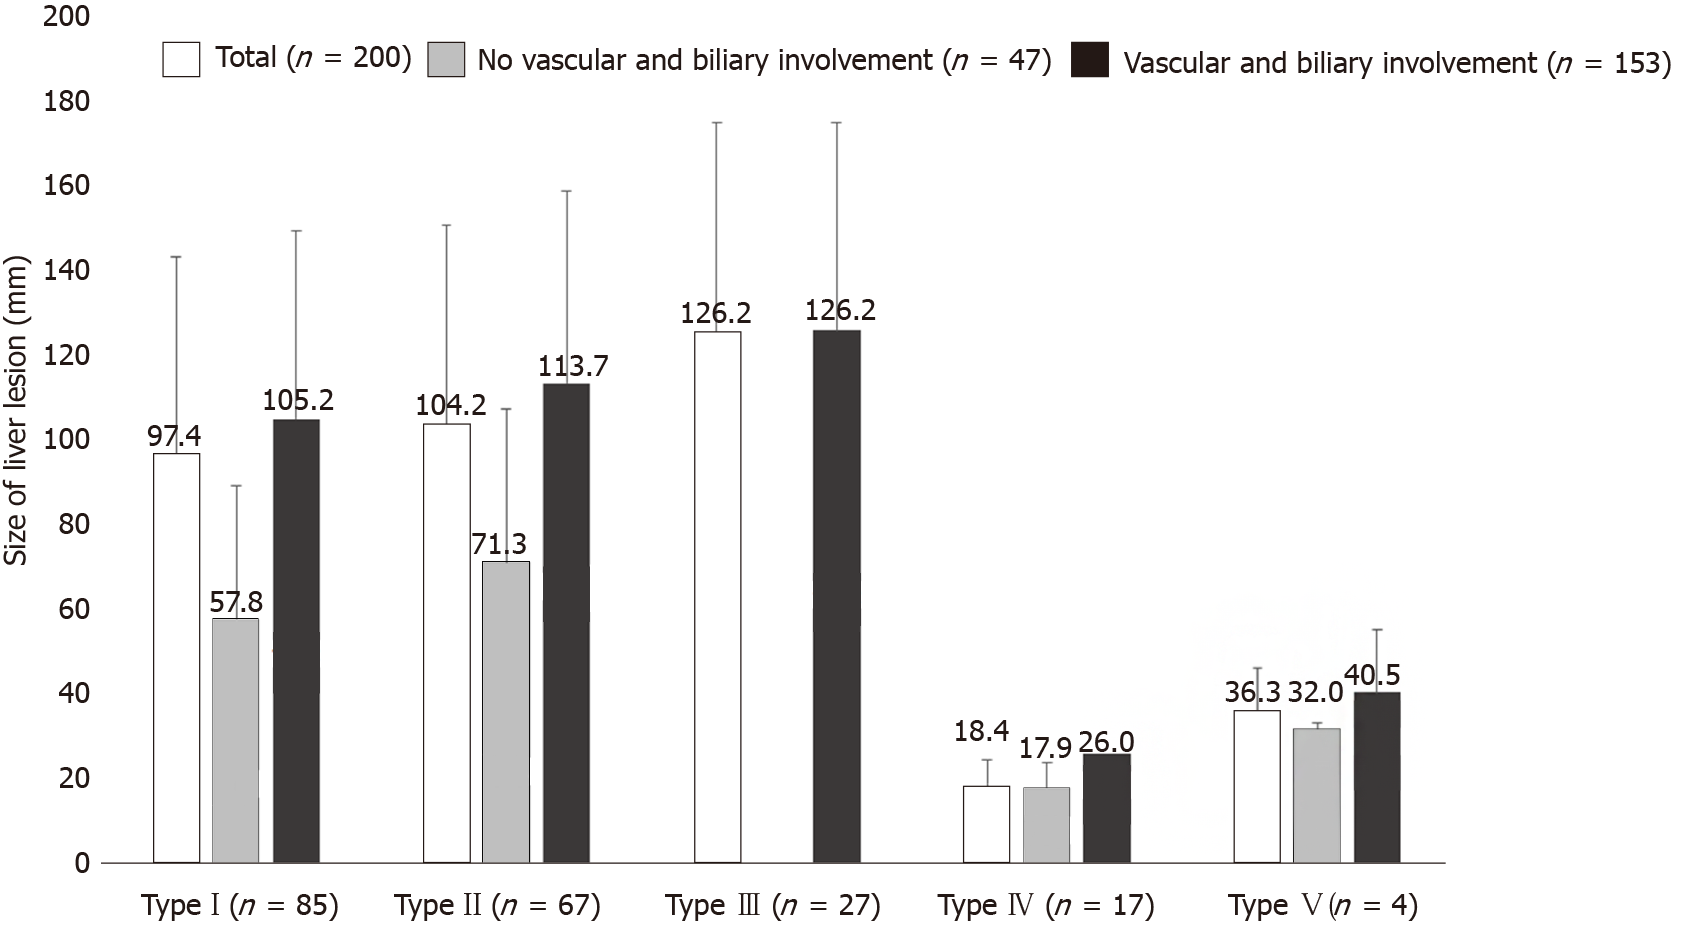
Figure 7 Distribution of primary morphology types depending on vascular and biliary involvement and non-involvement considering the lesion size.
- Citation: Graeter T, Bao HH, Shi R, Liu WY, Li WX, Jiang Y, Schmidberger J, Brumpt E, Delabrousse E, Kratzer W, the XUUB Consortium. Evaluation of intrahepatic manifestation and distant extrahepatic disease in alveolar echinococcosis. World J Gastroenterol 2020; 26(29): 4302-4315
- URL: https://www.wjgnet.com/1007-9327/full/v26/i29/4302.htm
- DOI: https://dx.doi.org/10.3748/wjg.v26.i29.4302


