Copyright
©The Author(s) 2020.
World J Gastroenterol. Aug 7, 2020; 26(29): 4288-4301
Published online Aug 7, 2020. doi: 10.3748/wjg.v26.i29.4288
Published online Aug 7, 2020. doi: 10.3748/wjg.v26.i29.4288
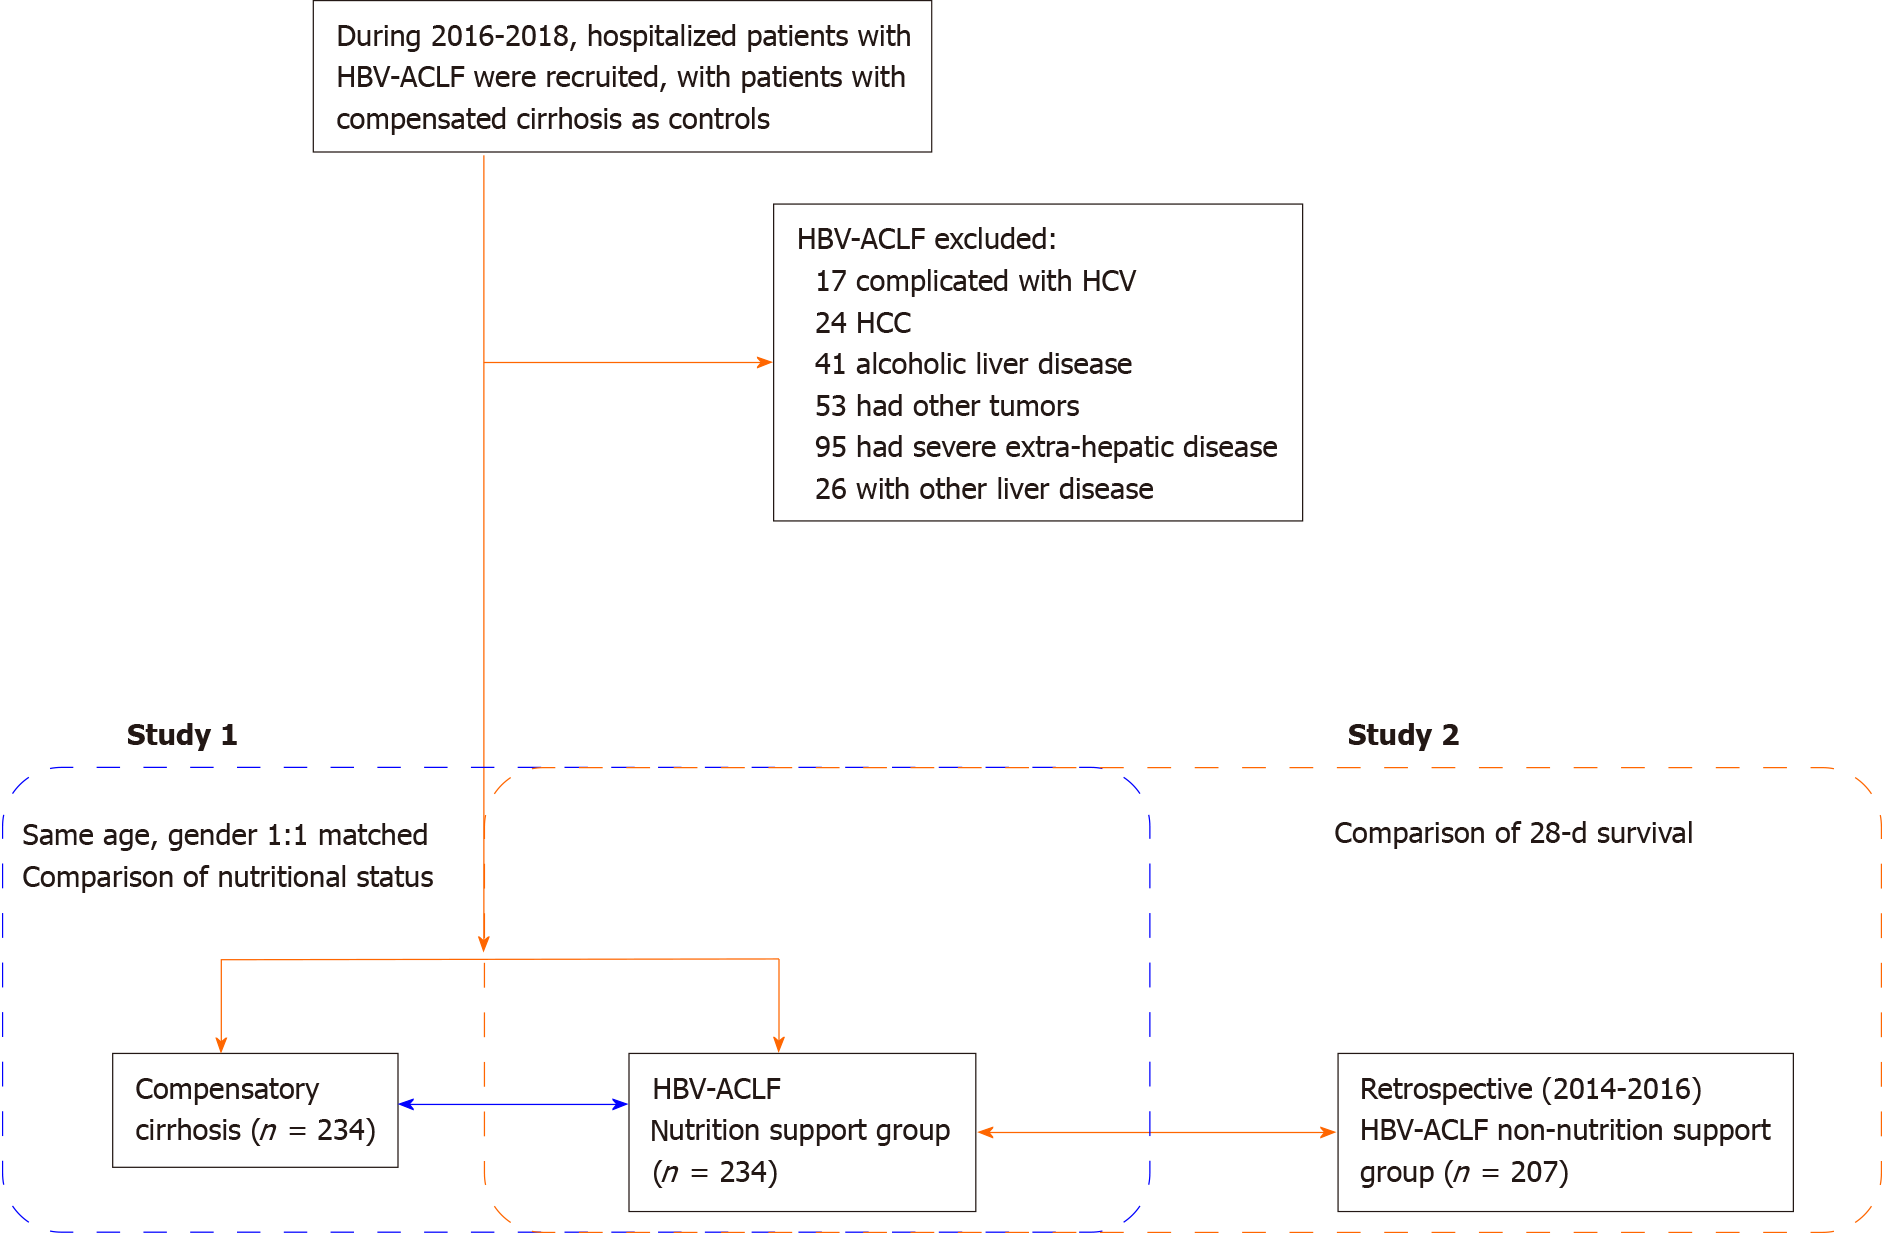
Figure 1 Overview of this study.
HBV-ACLF: Hepatitis B virus-associated acute-on-chronic liver failure; HCV: Hepatitis C virus infection; HCC: Hepatocellular carcinoma.
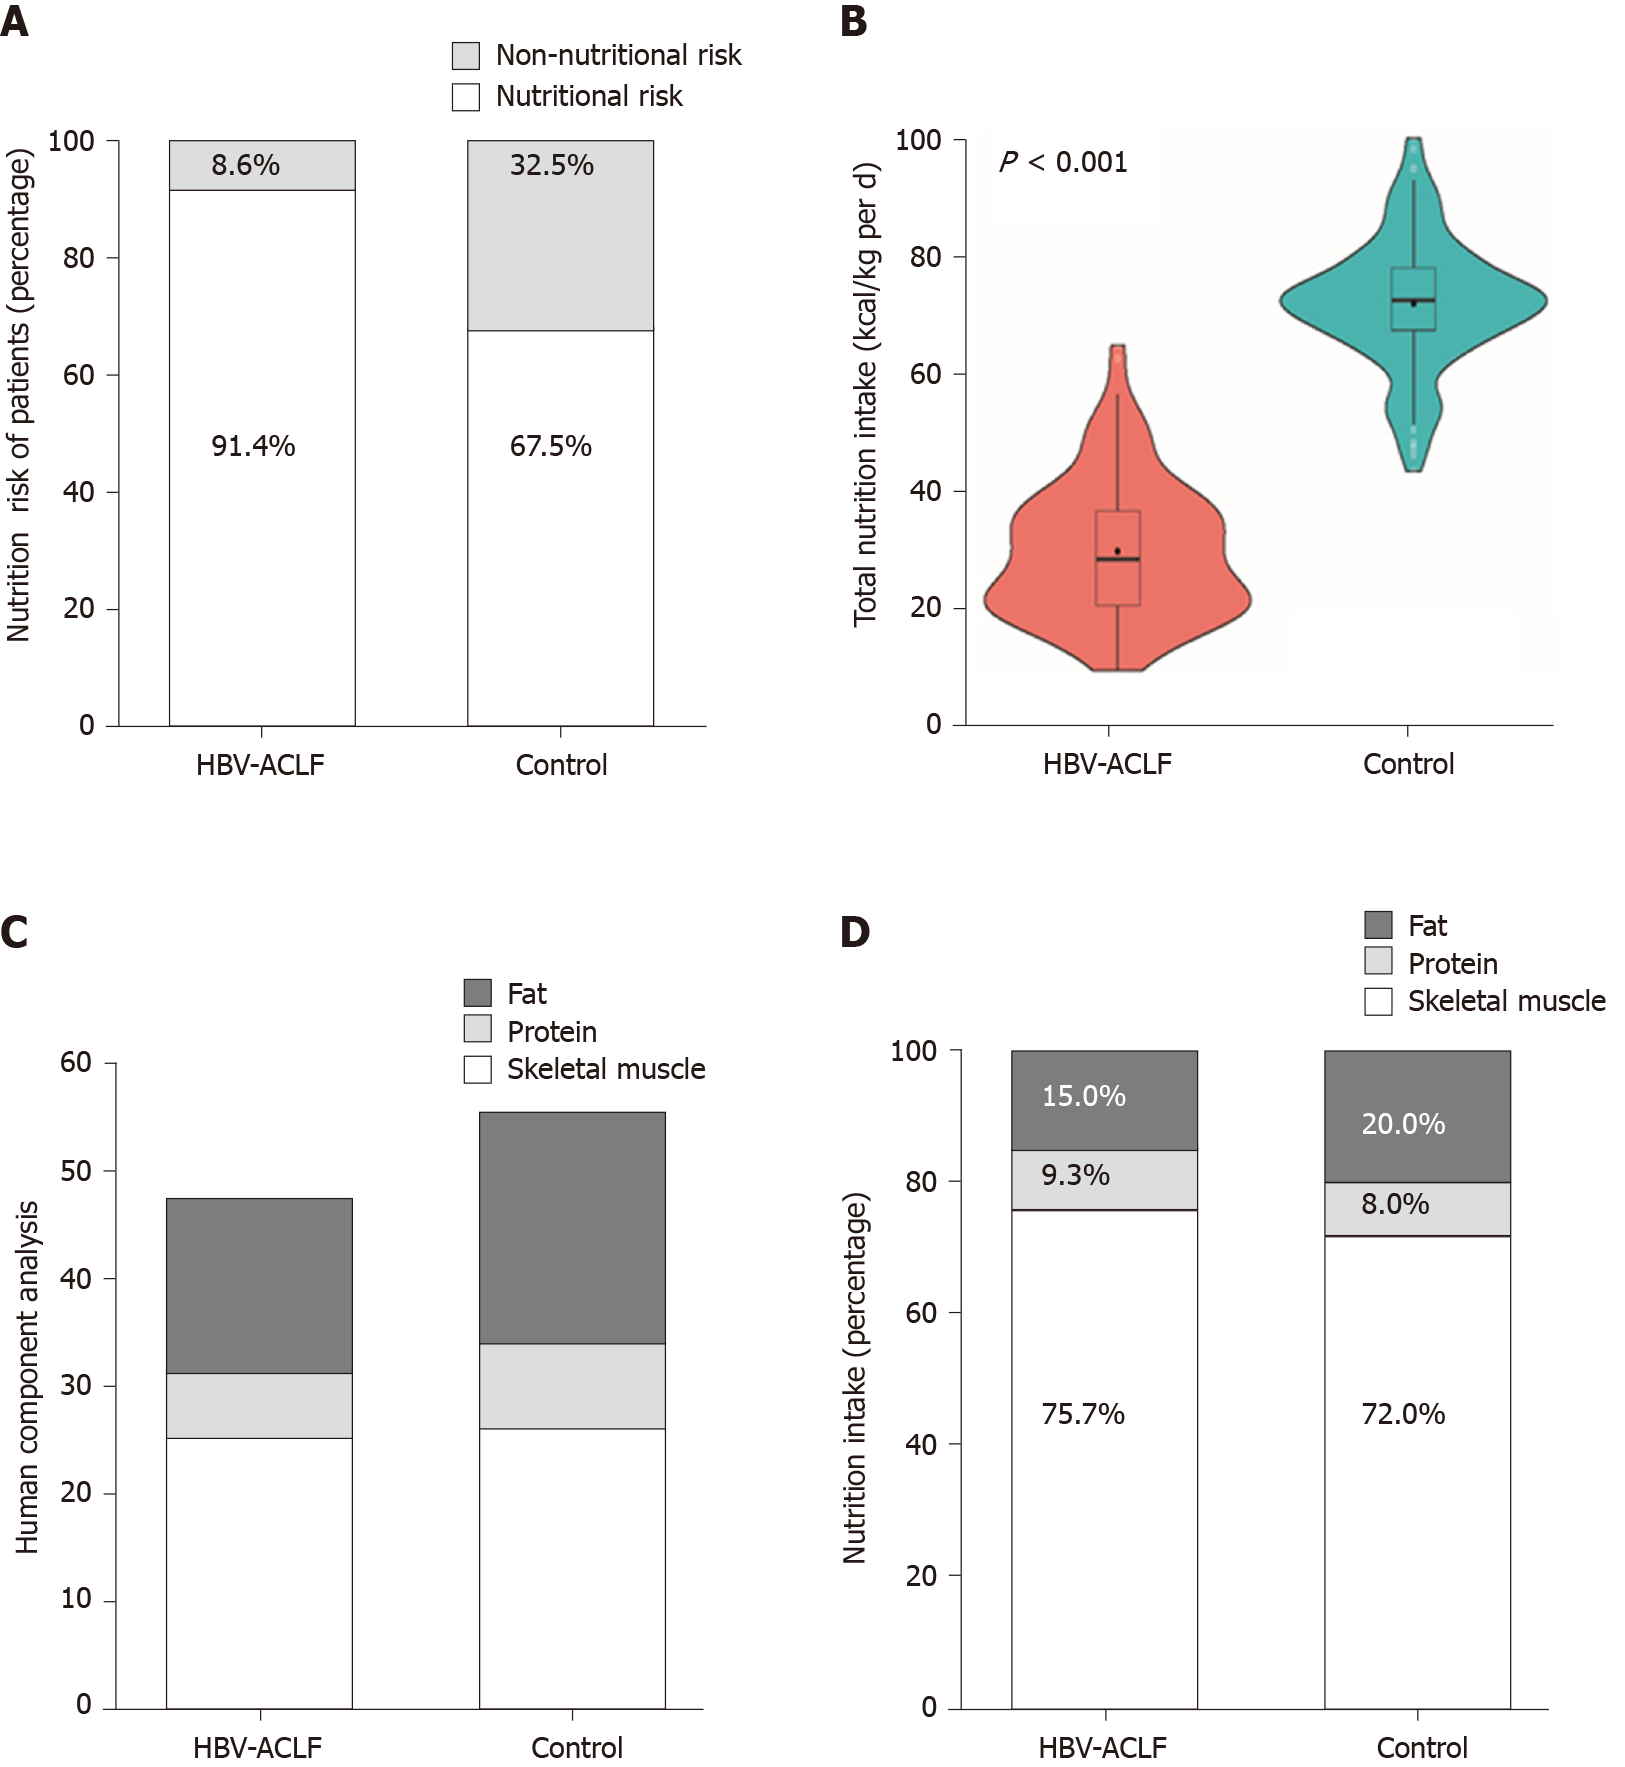
Figure 2 Comparison of nutritional status between the hepatitis B virus-associated acute-on-chronic liver failure group and the control group.
A: According to the Nutritional risk screening 2002 assessment, 91.4% of hepatitis B virus-associated acute-on-chronic liver failure (HBV-ACLF) patients and 67.5% of compensated cirrhosis patients had a nutritional risk; B: The energy intake in HBV-ACLF patients was lower than that in compensated cirrhosis patients (P < 0.001); C: The body composition analysis in HBV-ACLF and control group. Significant decreases in skeletal muscle and fat in HBV-ACLF patients were observed; D: The intake of calories, protein, and fat in HBV-ACLF were lower than those in the control group at hospital admission (P < 0.001). HBV-ACLF: Hepatitis B virus-associated acute-on-chronic liver failure.
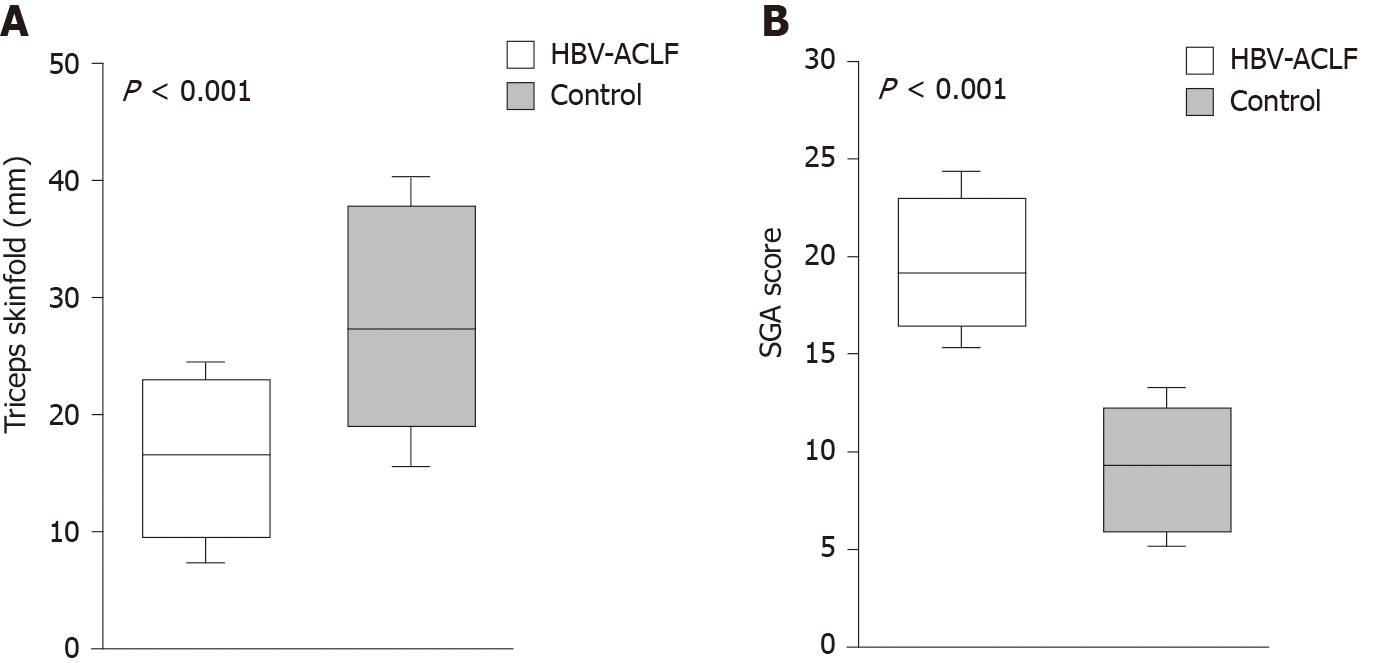
Figure 3 Difference in triceps skinfold thickness and subjective global assessment score.
A: Patients with hepatitis B virus-associated acute-on-chronic liver failure (HBV-ACLF) had a higher subjective global assessment score; B: Patients with HBV-ACLF had a lower triceps skinfold thickness. SGA: Subjective global assessment; HBV-ACLF: Hepatitis B virus-associated acute-on-chronic liver failure.
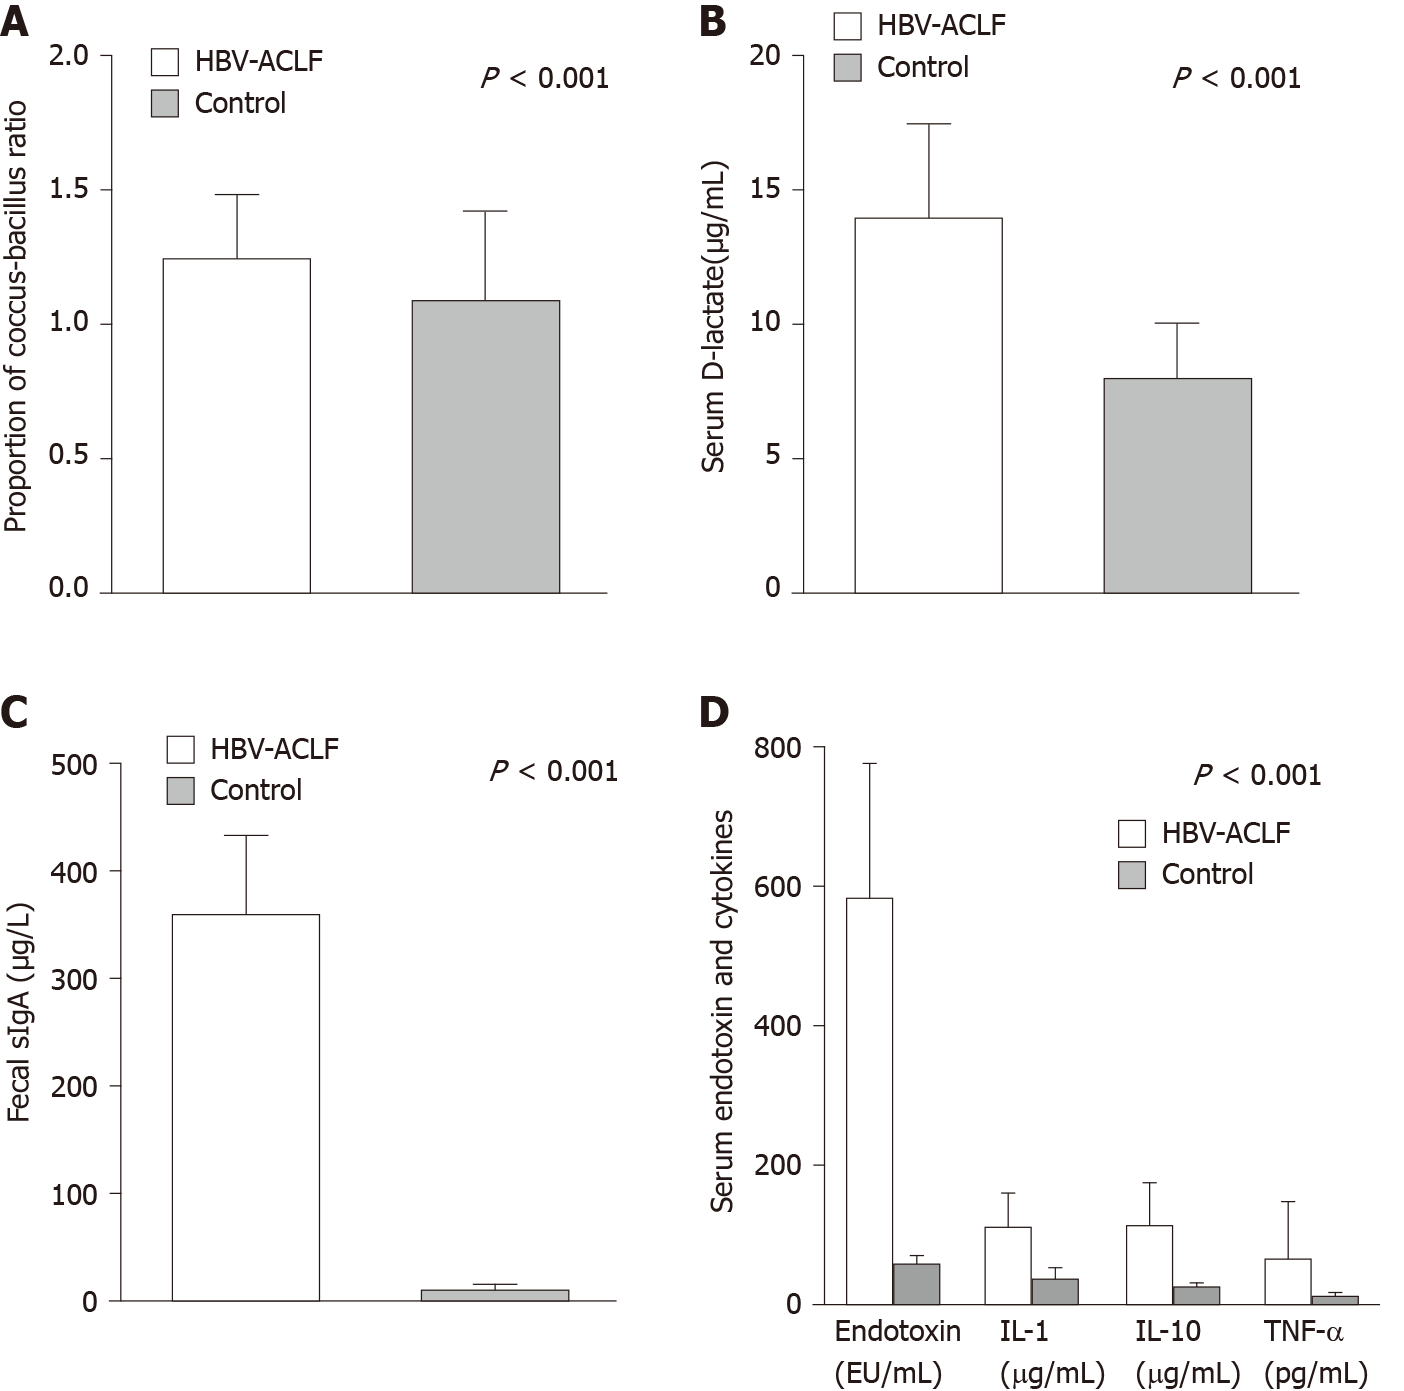
Figure 4 Comparison of biomarkers of the gastrointestinal barrier and inflammation.
A: The coccus-bacillus ratio in feces in the hepatitis B virus-associated acute-on-chronic liver failure (HBV-ACLF) group (1.2 ± 0.2) was higher than that of the control group (1.1 ± 0.3; P < 0.001); B: The level of serum D-lactate in the HBV-ACLF group (358.1 ± 74.6 µg/mL) was higher than that of the control group (8.0 ± 2.1 µg/mL; P < 0.001); C: The level of sIgA in the HBV-ACLF group (358.1 ± 74.6 mg/L) was higher than that of the control group (12.5 ± 4.2) mg/L; P < 0.001); D: The levels of endotoxin, IL-1, IL-10, and TNF-α in HBV-ACLF patients were higher than those in the control group (P < 0.001). HBV-ACLF: Hepatitis B virus-associated acute-on-chronic liver failure; IL-1: Interleukin-1; IL-10: Interleukin-10; TNF-α: Tumor necrosis factor alpha.
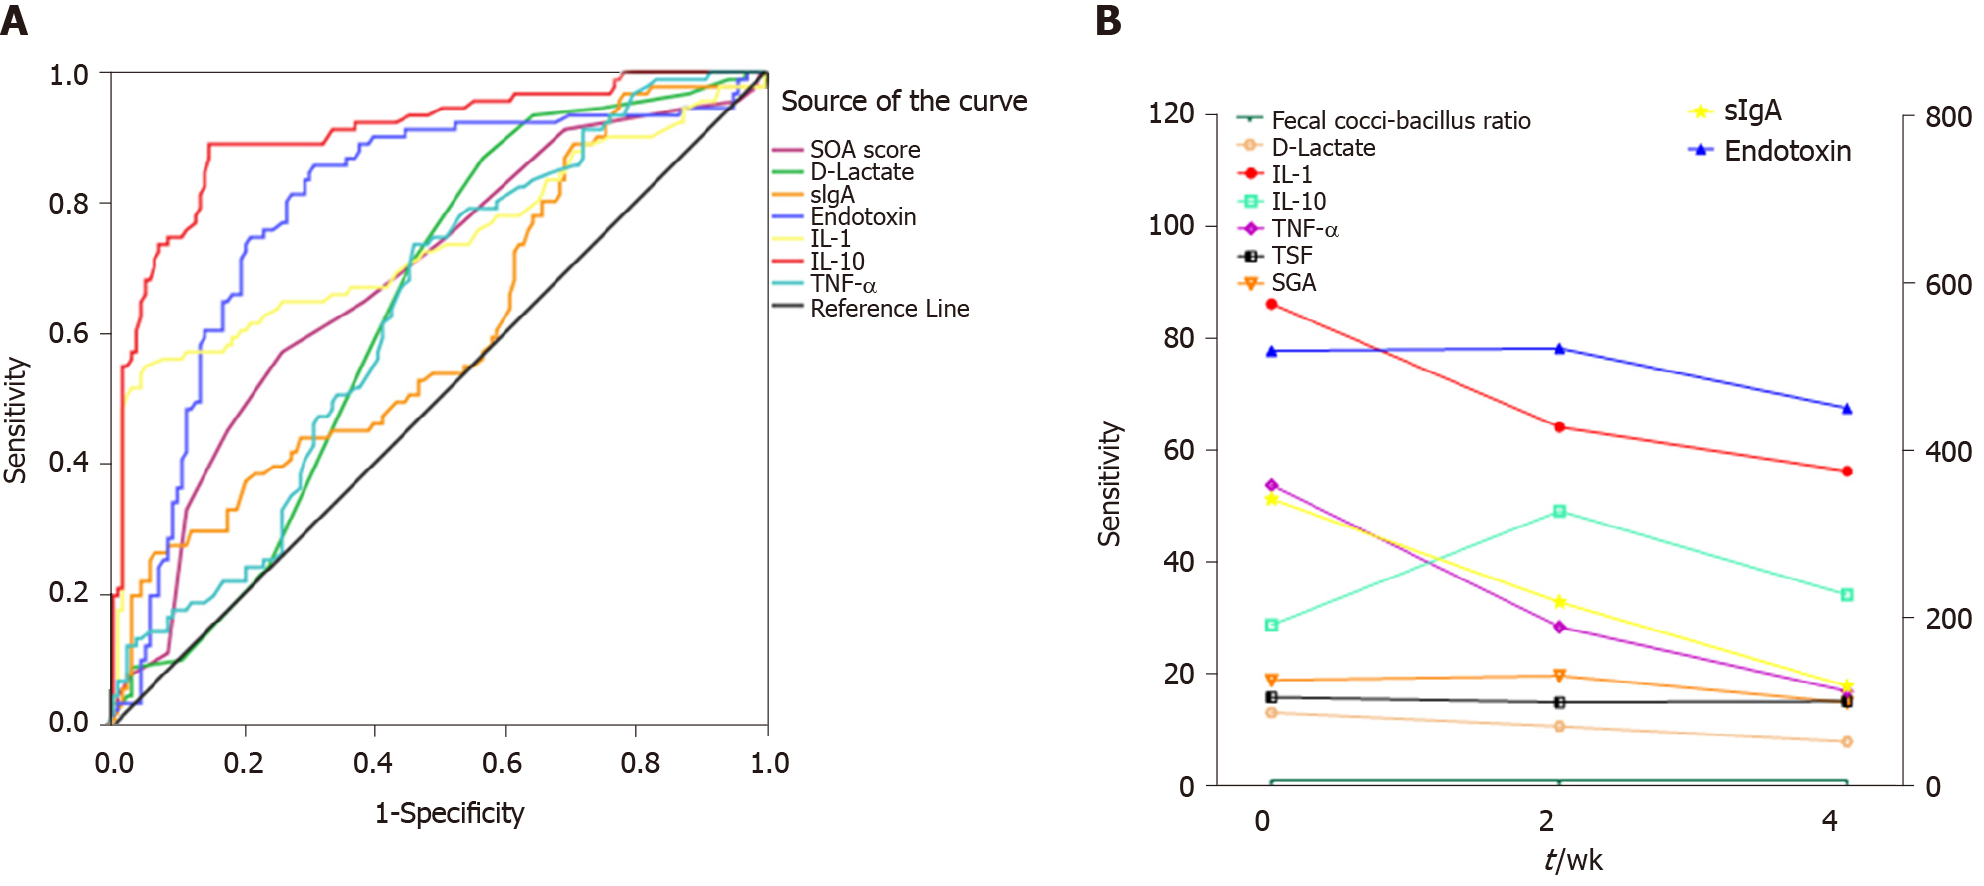
Figure 5 Role of biomarkers in hepatitis B virus-associated acute-on-chronic liver failure patients.
A: Value of biomarkers in predicting death in HBV-ACLF patients. The area under the receiver operating characteristic curve of IL-10 was the largest (area under the curve = 0.907, P < 0.001); B: Trends of biomarkers in survivors. HBV-ACLF: Hepatitis B virus-associated acute-on-chronic liver failure; SGA: Subjective global assessment; SIgA: Secretory immunoglobulin A; IL-1: Interleukin-1; IL-10: Interleukin-10; TNF-α: Tumor necrosis factor alpha.
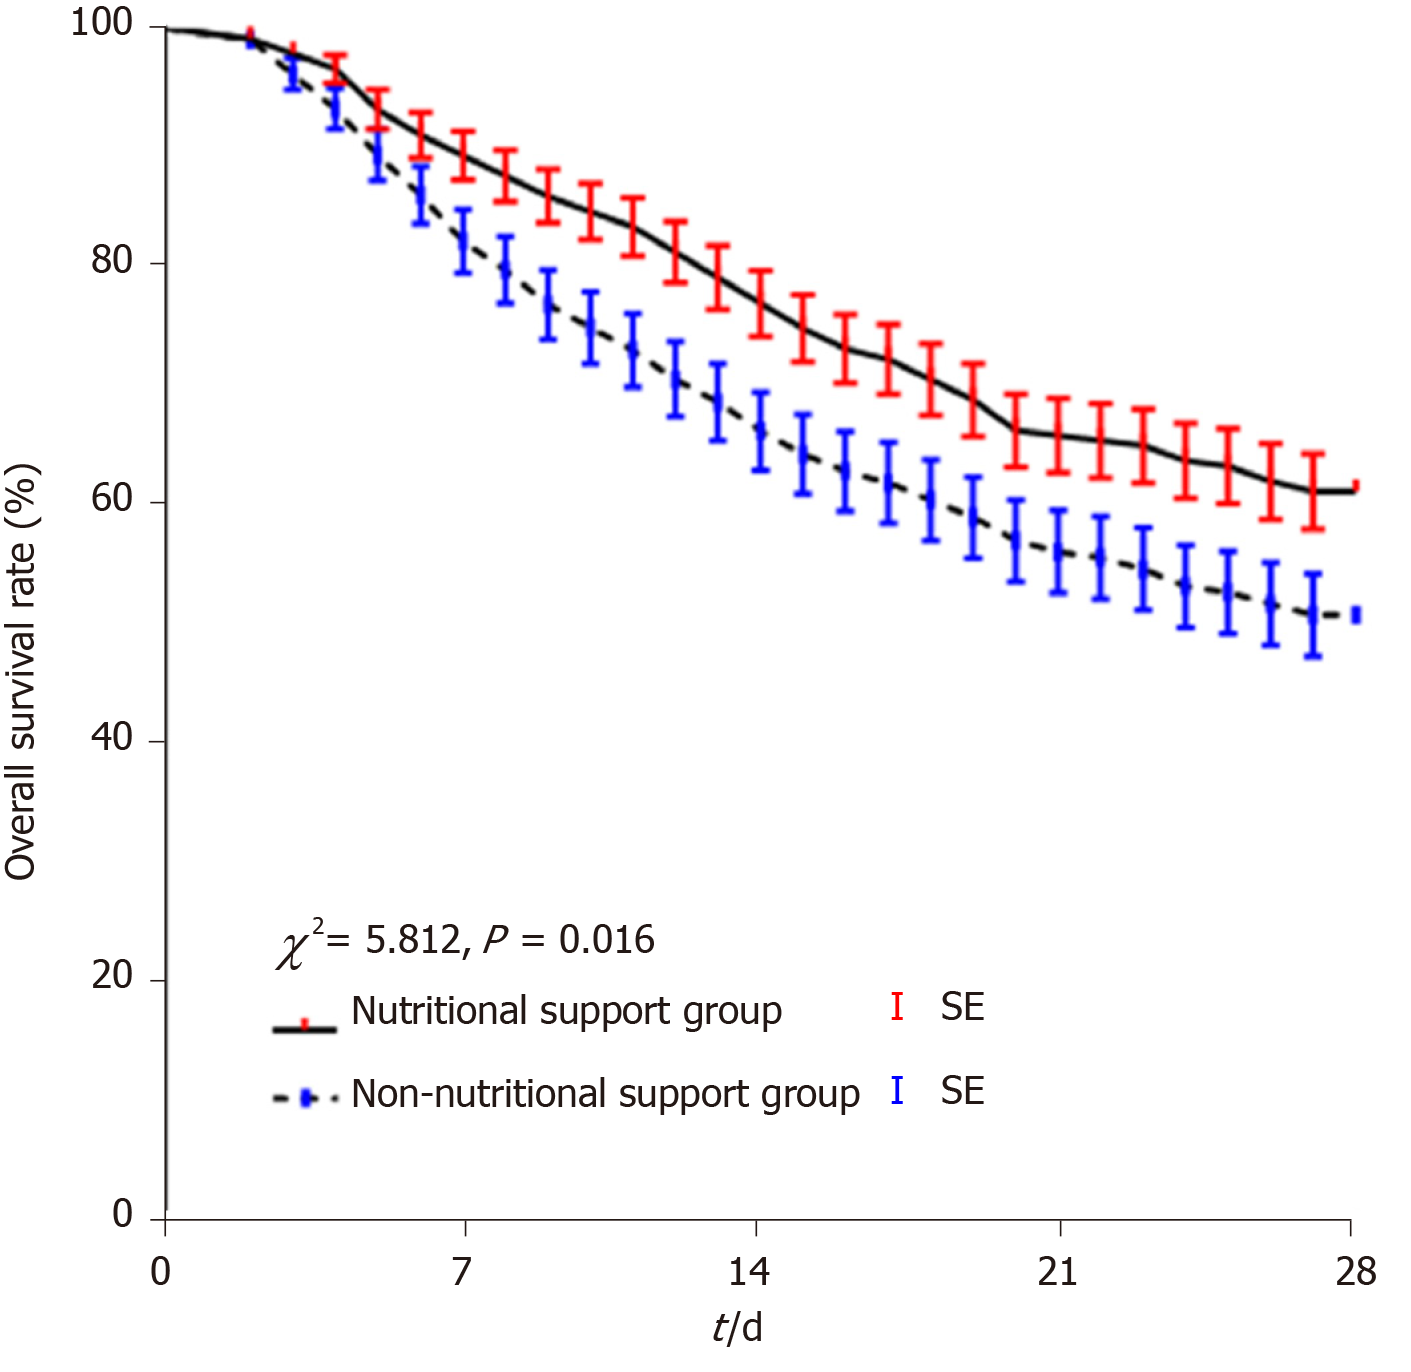
Figure 6 Comparison of 28-d mortality between the nutritional support group and the non-nutritional support group (Kaplan-Meier method).
The hepatitis B virus-associated acute-on-chronic liver failure nutrition support group had a better prognosis than the non-nutrition support group (P = 0.016).
- Citation: Chang Y, Liu QY, Zhang Q, Rong YM, Lu CZ, Li H. Role of nutritional status and nutritional support in outcome of hepatitis B virus-associated acute-on-chronic liver failure. World J Gastroenterol 2020; 26(29): 4288-4301
- URL: https://www.wjgnet.com/1007-9327/full/v26/i29/4288.htm
- DOI: https://dx.doi.org/10.3748/wjg.v26.i29.4288


