Copyright
©The Author(s) 2020.
World J Gastroenterol. Jul 14, 2020; 26(26): 3800-3813
Published online Jul 14, 2020. doi: 10.3748/wjg.v26.i26.3800
Published online Jul 14, 2020. doi: 10.3748/wjg.v26.i26.3800
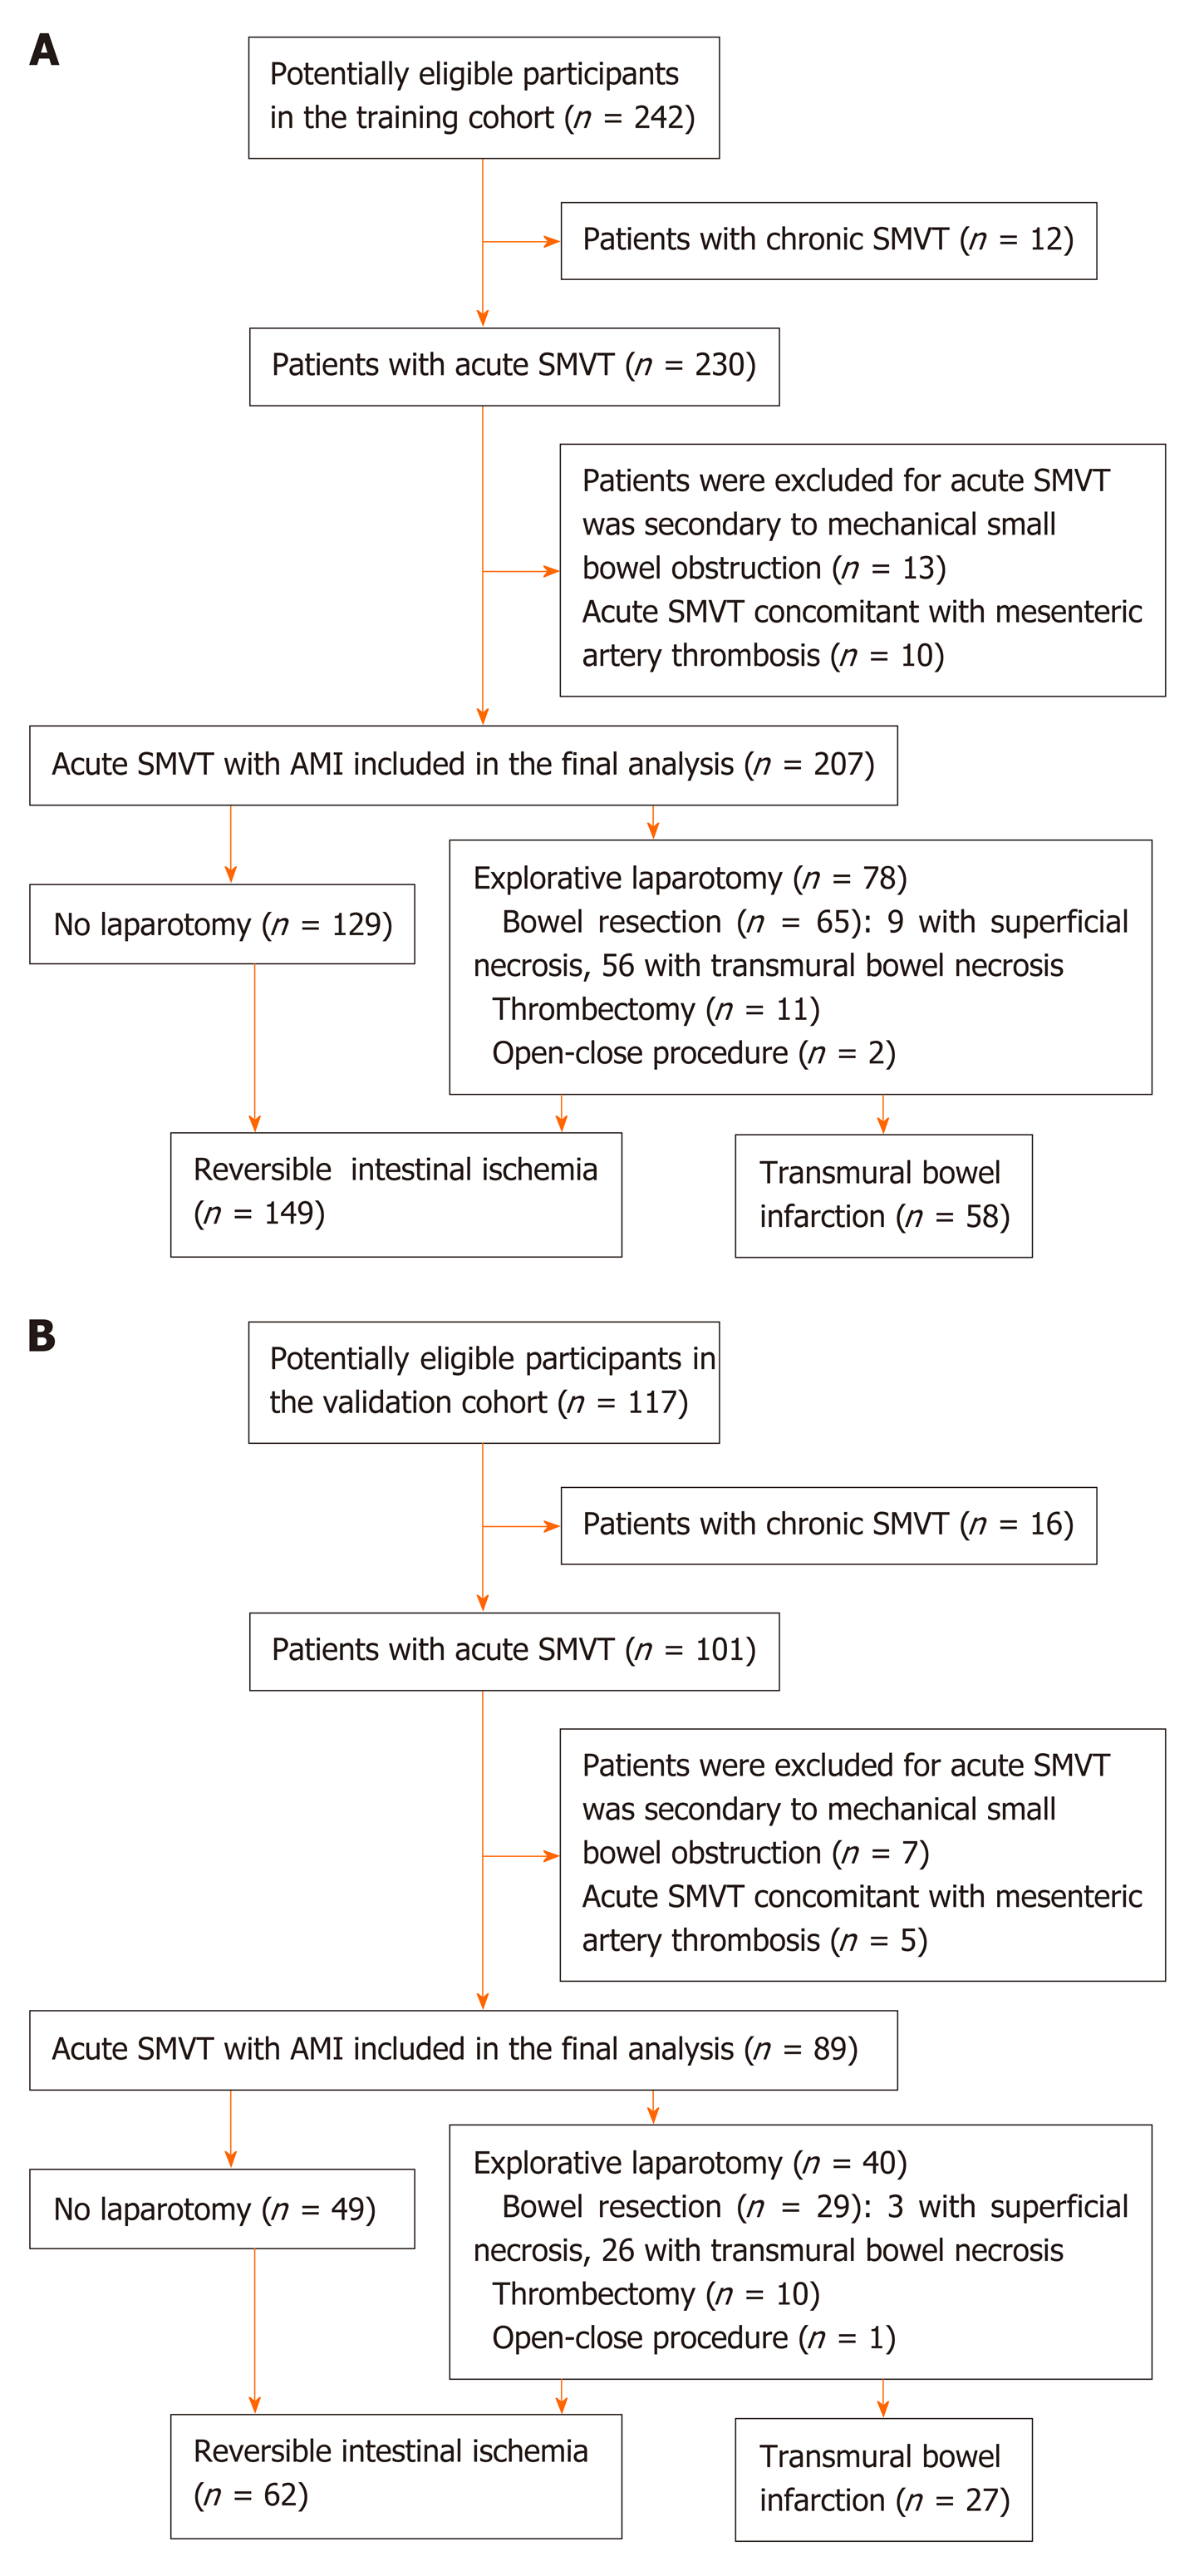
Figure 1 Flow diagram of study populations.
A: Training cohort; B: Validation cohort. SMVT: Superior mesenteric venous thrombosis; AMI: Acute mesenteric ischemia.
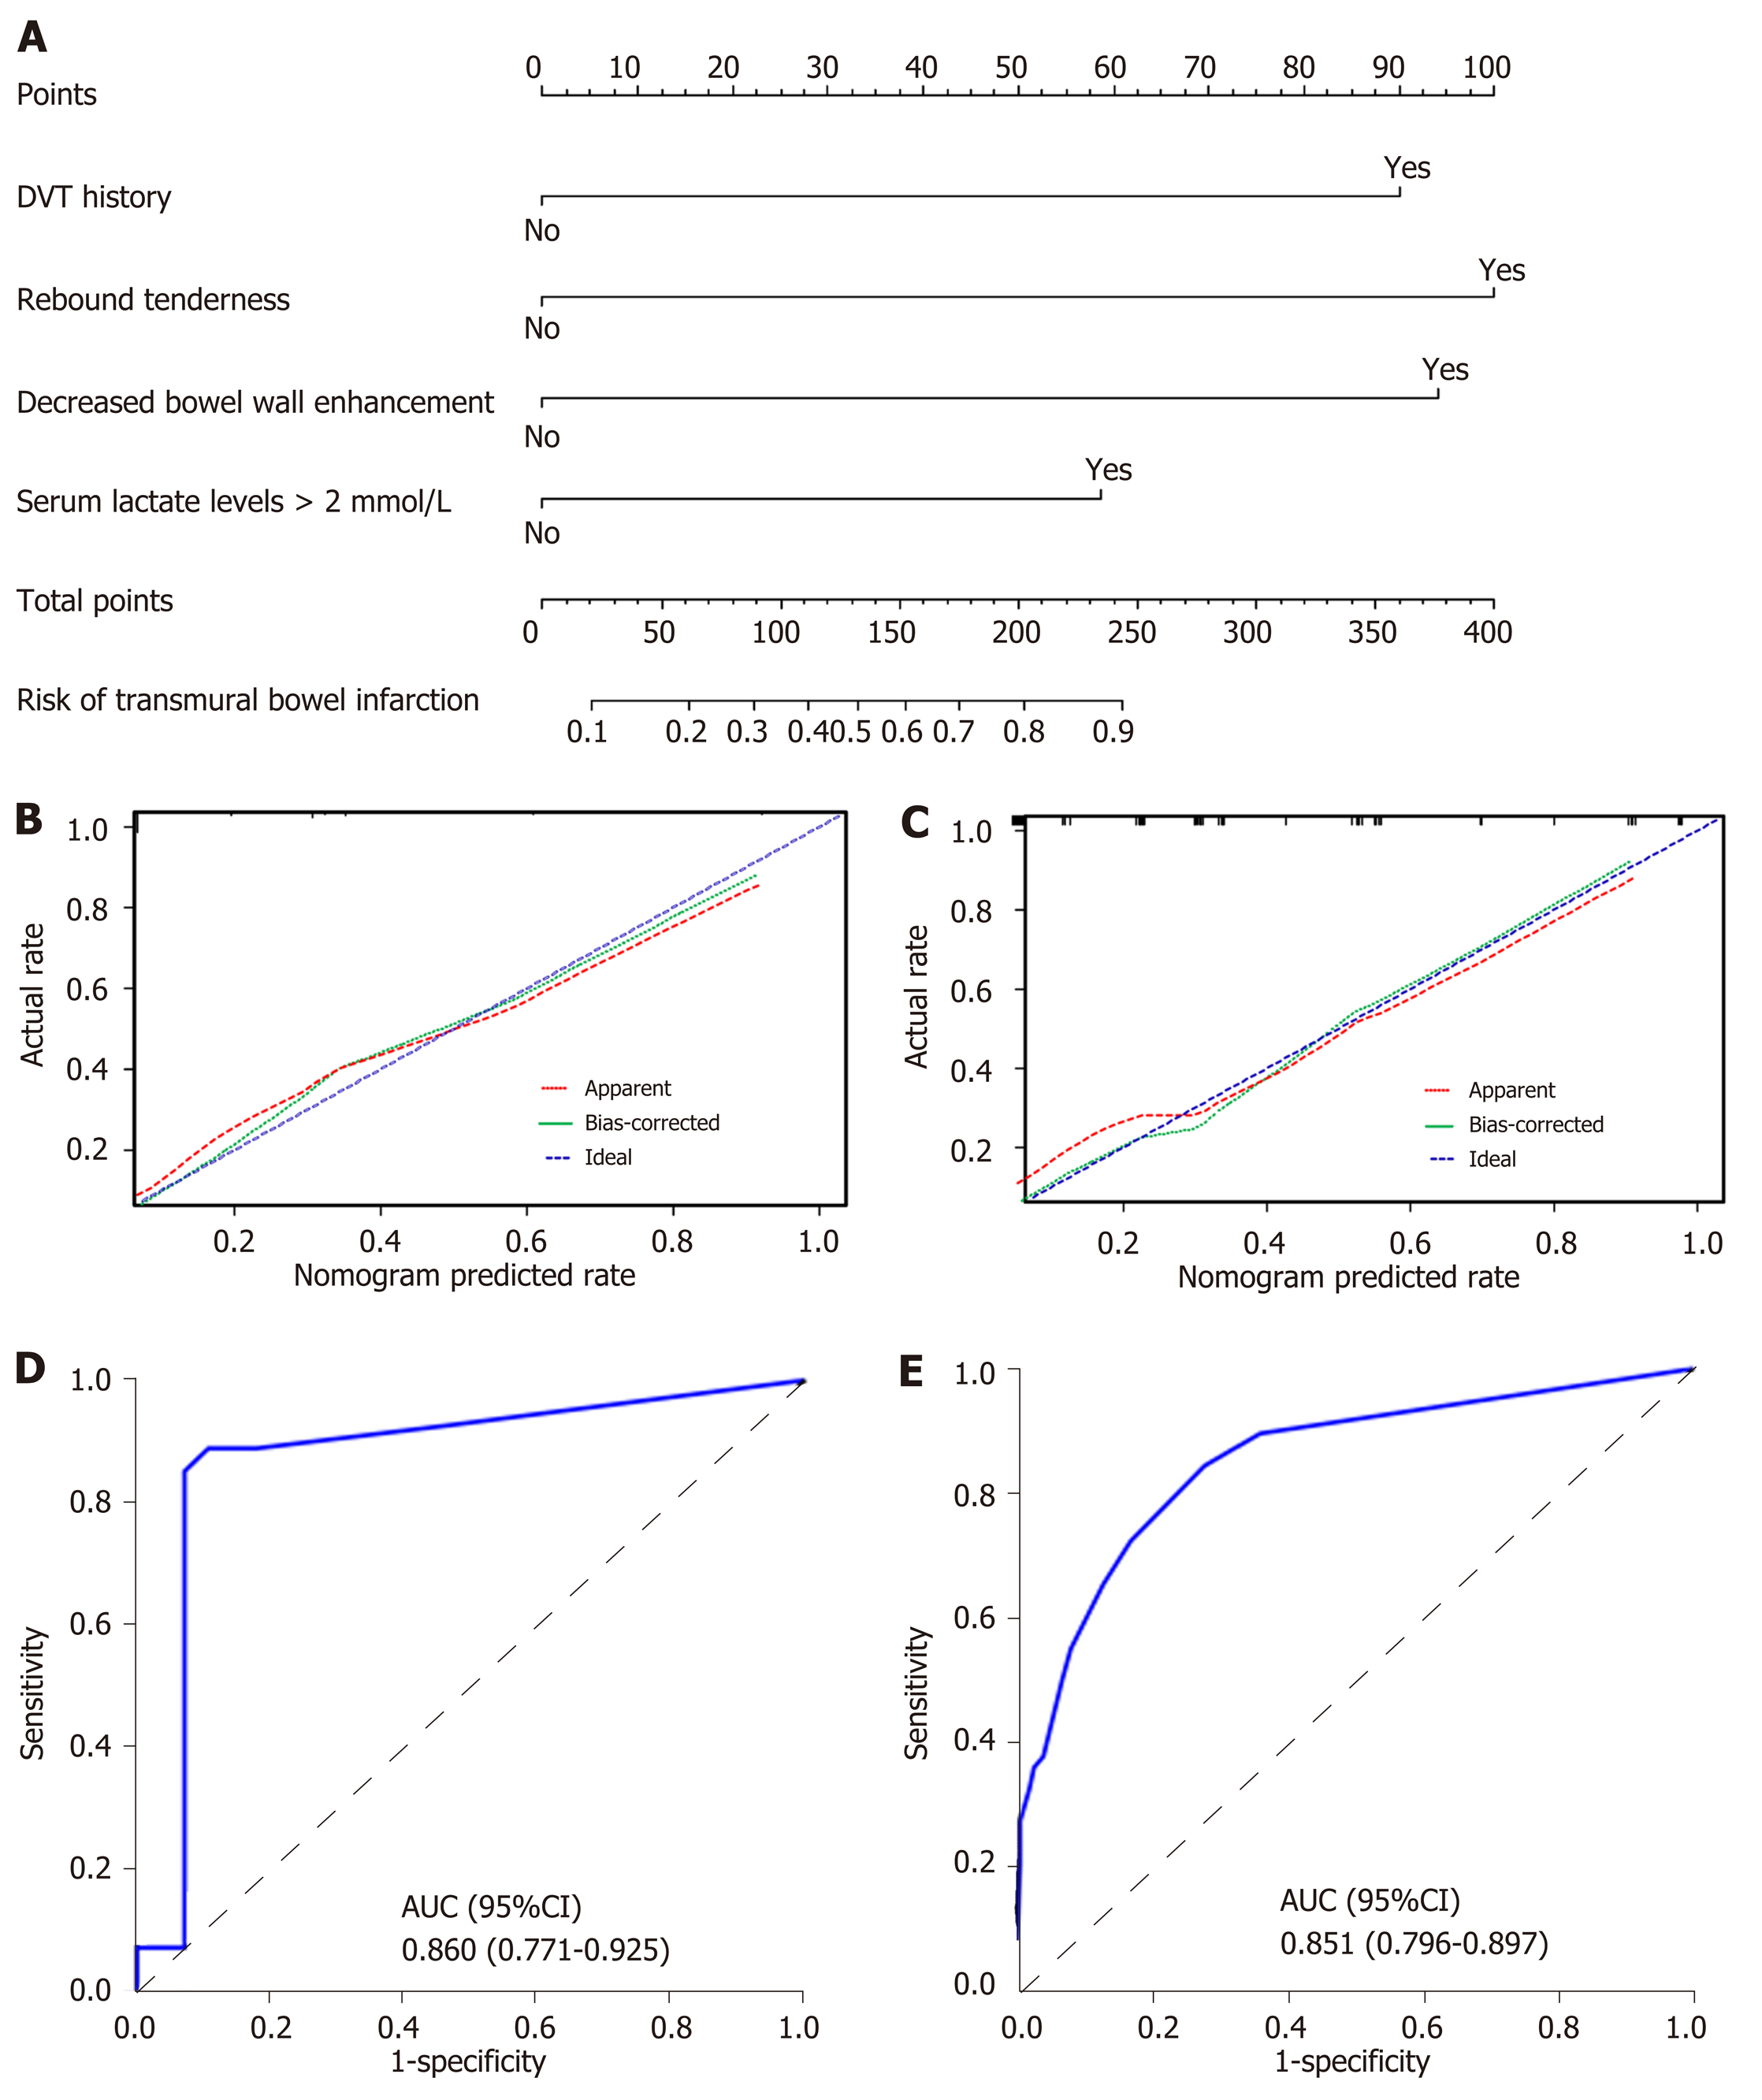
Figure 2 Nomogram for evaluation of transmural bowel infarction risk and its predictive performance.
A: Nomogram for estimating the risk of transmural bowel infarction (TBI) in patients with acute mesenteric ischemia (AMI). The nomogram is used to find the position of each variable on the corresponding axis, draw a line to the points axis for the number of points, add the points from all of the variables, and draw a line from the total points axis to determine the risk of TBI at the lower line of the nomogram. For example, a 30-year-old male patient (have transmural bowel infarction finally) with a previous history of deep venous thrombosis and serum lactate levels > 2 mmol/L, no rebound tenderness and no decreased bowel wall enhancement, has a risk of 59% of TBI calculated by the nomogram; B and C: Calibration curves of the nomogram in the training and validation sets, respectively. Calibration curves depict the calibration of the model in terms of the agreement between the predicted probabilities of TBI and observed outcomes of TBI. The dotted blue line represents an ideal prediction, and the dotted red line represents the predictive ability of the nomogram. The closer the dotted red line fit is to the dotted blue line, the better the predictive accuracy of the nomogram is; D and E: The ROC curves of the nomogram in the training and validation sets, respectively. TBI: Transmural bowel infarction; AMI: Acute mesenteric ischemia; DVT: Deep venous thrombosis; AUC: Area under the receiver operator characteristic curve; ROC: Receiver operator characteristic curve.
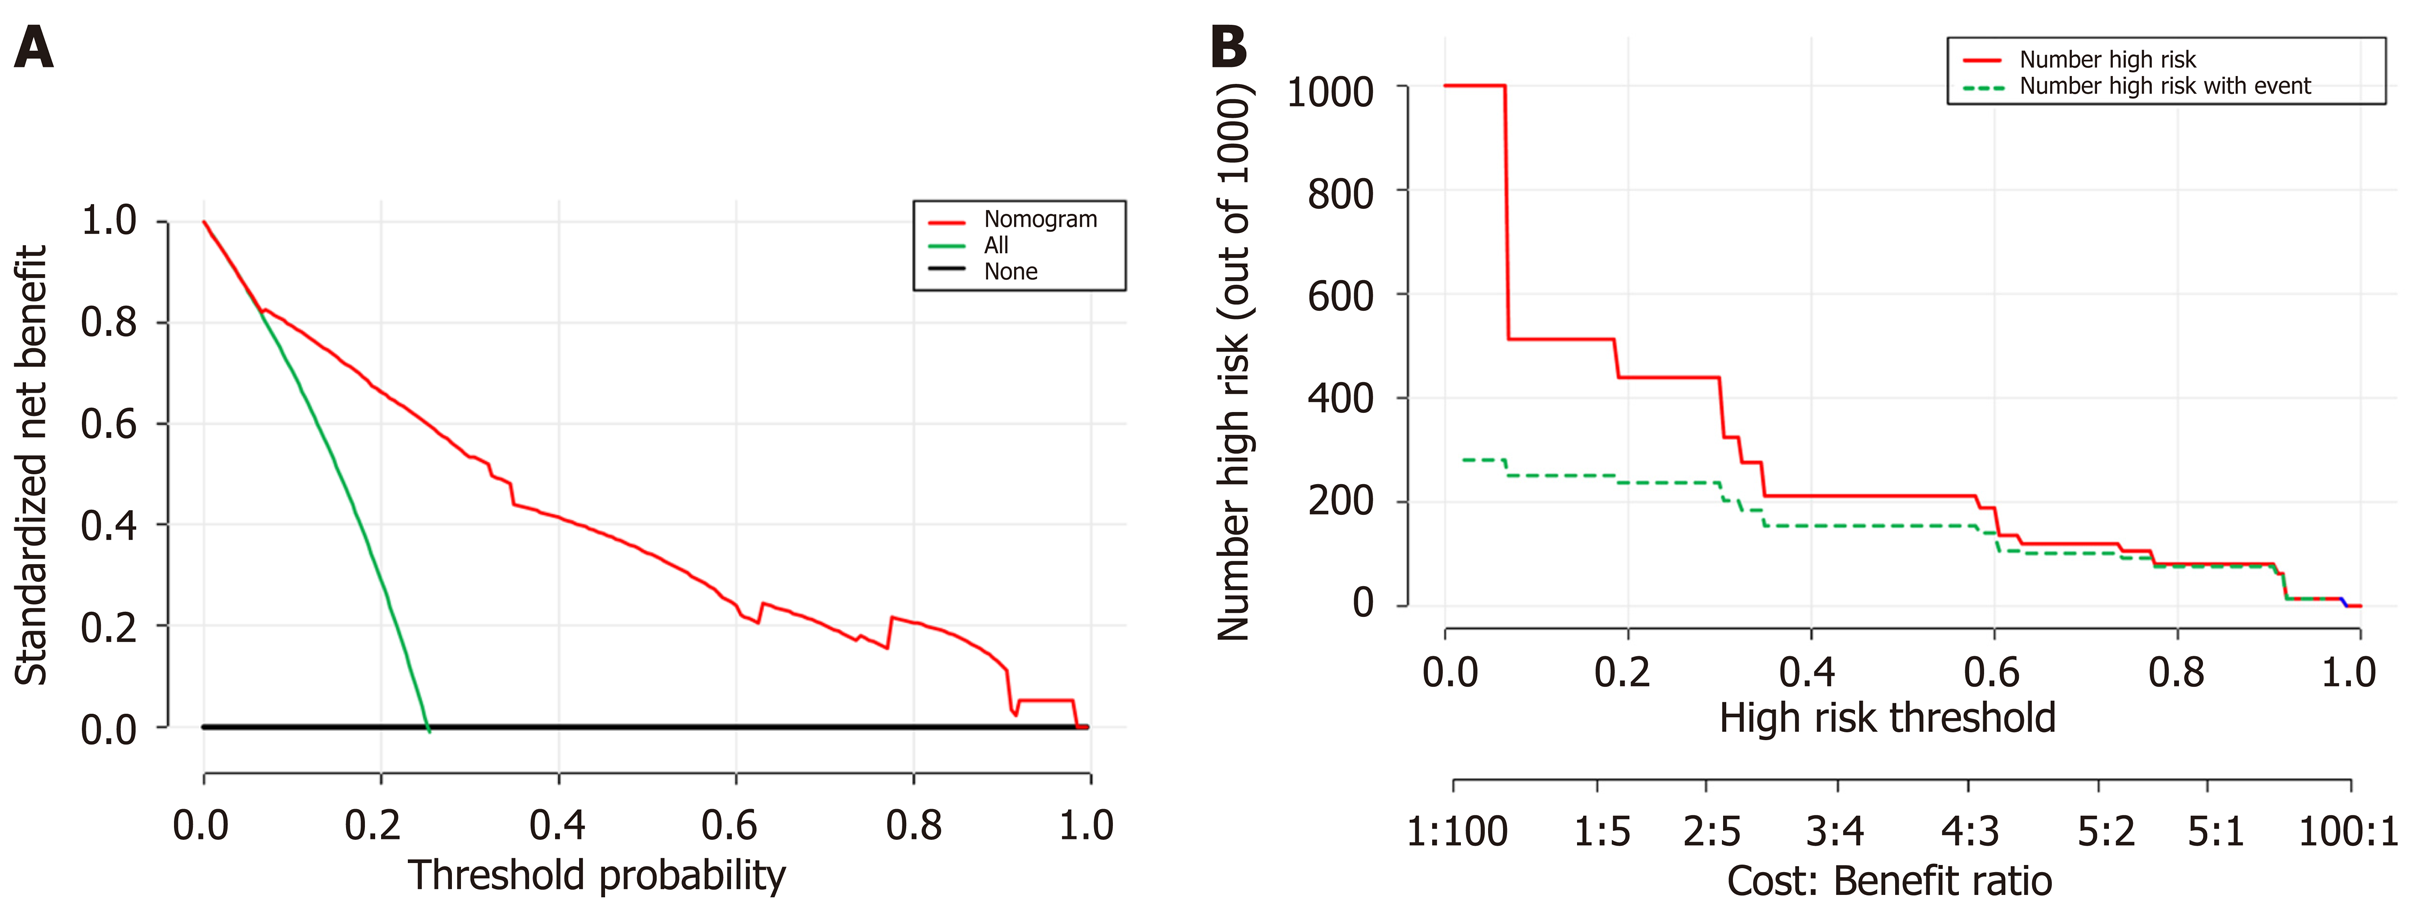
Figure 3 Decision curve analysis for the nomogram.
A: The Y-axis shows the net benefit. The X-axis shows the corresponding risk threshold. The green line represents the assumption that all patients have transmural bowel infarction (TBI). The thin black line represents the assumption that no patients have TBI. The red line represents the nomogram. The decision curve in the validation cohort indicated that if the threshold probability is between 0 and 1.0, then using the nomogram to predict TBI adds more benefit than the treat-all-patients scheme or treat-none scheme; B: Clinical impact curve for the risk model. Of 1000 patients, the red solid line shows the total number who would be deemed at high risk for each risk threshold. The green dashed line shows how many of those would be true positives cases. DCA: Decision curve analysis; TBI: Transmural bowel infarction.
- Citation: Jiang M, Li CL, Pan CQ, Lv WZ, Ren YF, Cui XW, Dietrich CF. Nomogram for predicting transmural bowel infarction in patients with acute superior mesenteric venous thrombosis. World J Gastroenterol 2020; 26(26): 3800-3813
- URL: https://www.wjgnet.com/1007-9327/full/v26/i26/3800.htm
- DOI: https://dx.doi.org/10.3748/wjg.v26.i26.3800


