Copyright
©The Author(s) 2020.
World J Gastroenterol. Jul 7, 2020; 26(25): 3586-3602
Published online Jul 7, 2020. doi: 10.3748/wjg.v26.i25.3586
Published online Jul 7, 2020. doi: 10.3748/wjg.v26.i25.3586
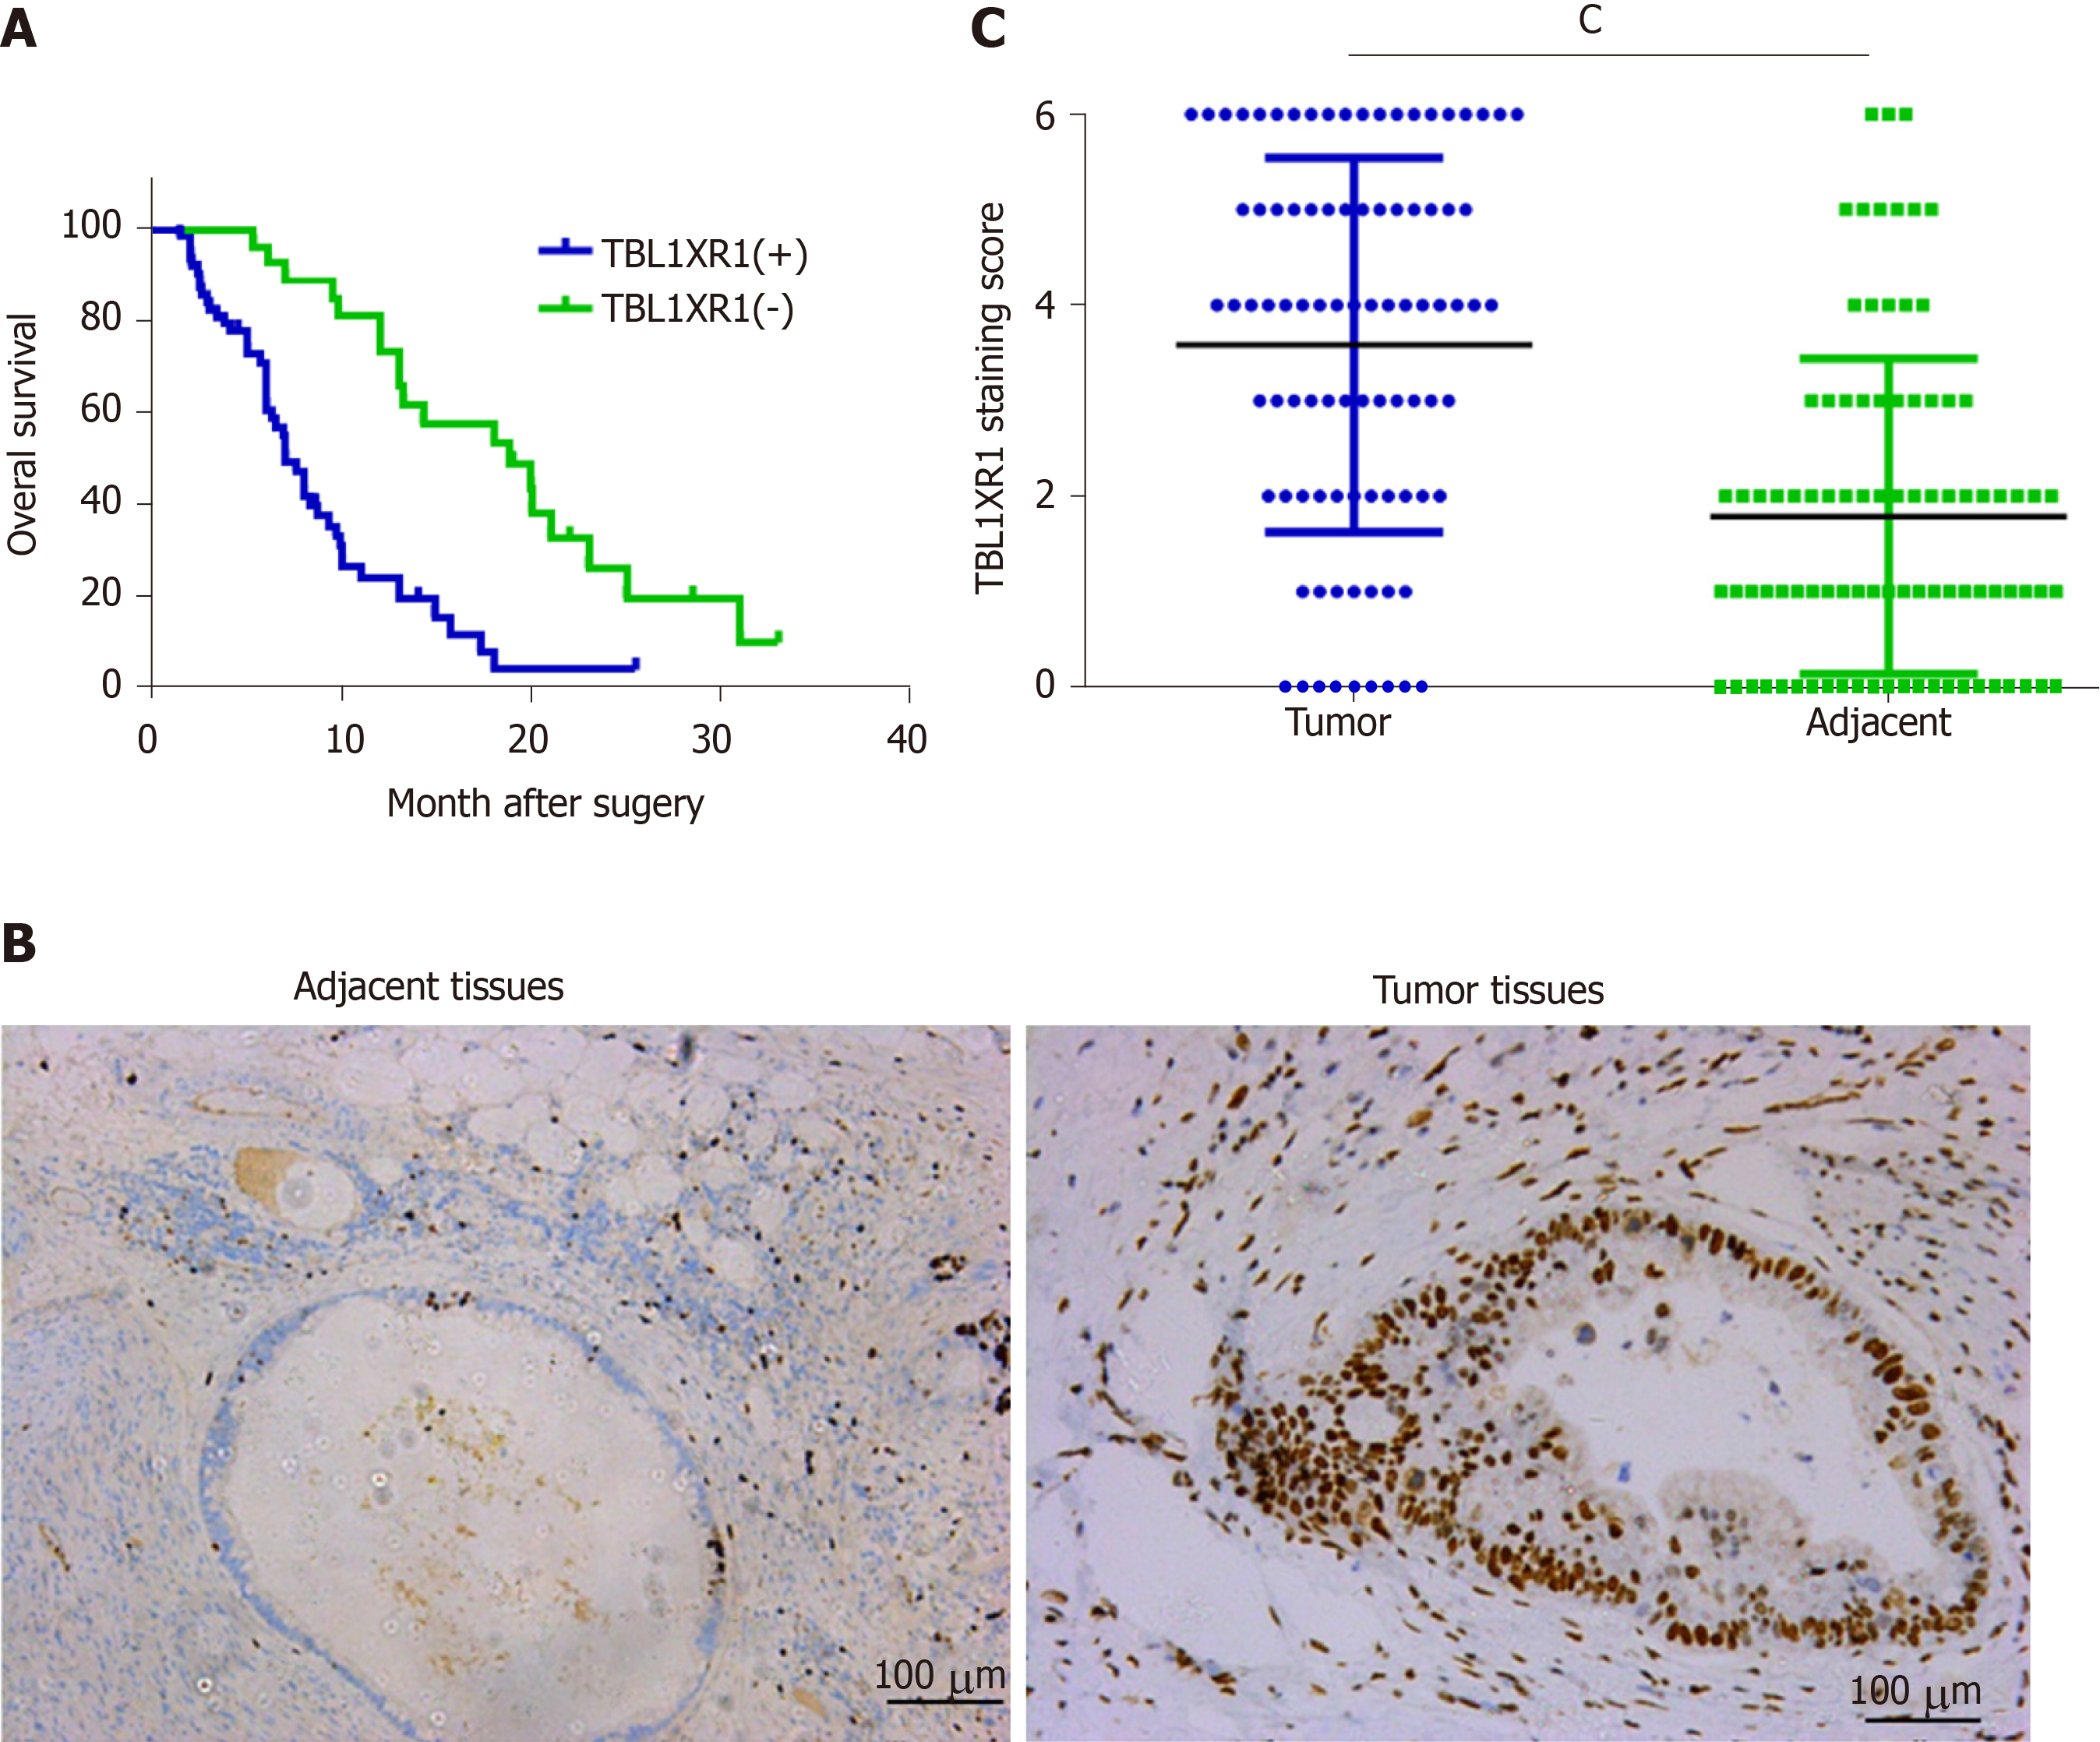
Figure 1 Clinicopathological significance of transducin (β)-like 1 X-linked receptor 1 expression in patients with pancreatic ductal adenocarcinoma.
A: Kaplan–Meier plots of overall survival of pancreatic ductal adenocarcinoma (PDAC) patients with positive and negative transducin (β)-like 1 X-linked receptor 1 (TBL1XR1) expression scores; B: Negative and positive staining of TBL1XR1 in PDAC; C: The average staining scores of TBL1XR1 expression in PDAC tissues and adjacent tissues. cP < 0.001. Scale bar, 100 µm. TBL1XR1: Transducin (β)-like 1 X-linked receptor 1.
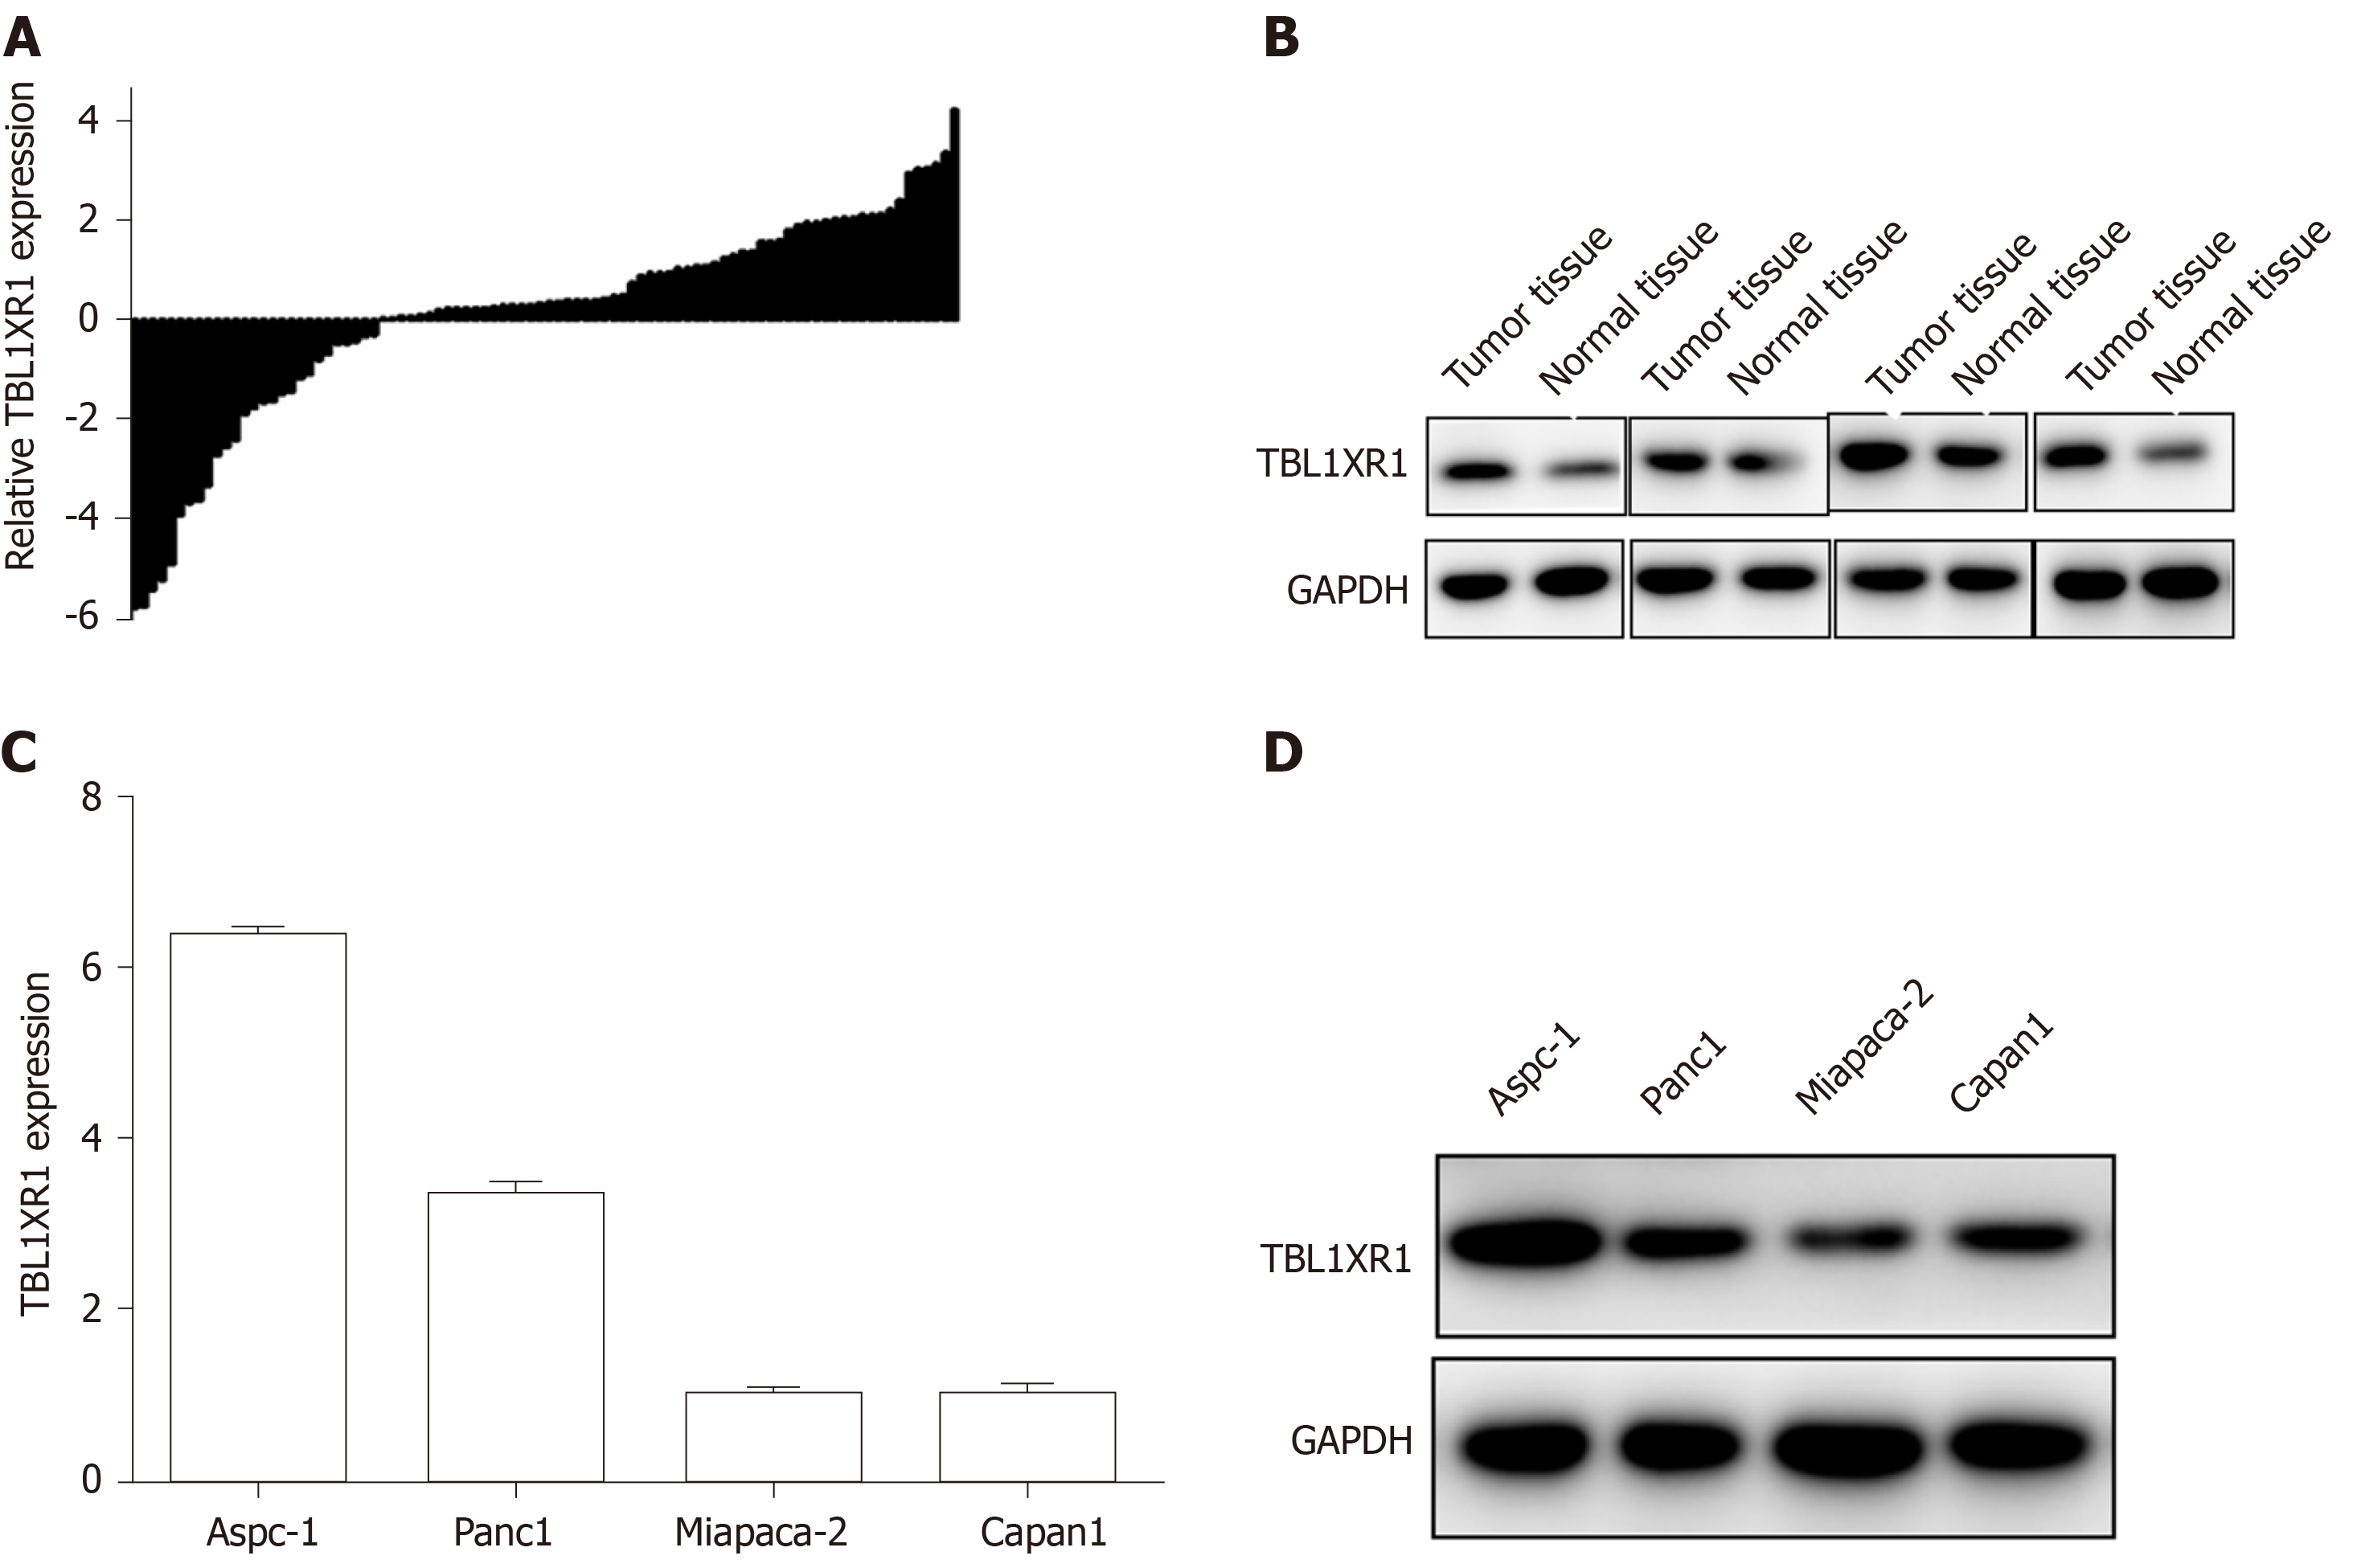
Figure 2 Enhanced expression of transducin (β)-like 1 X-linked receptor 1 in pancreatic ductal adenocarcinoma tissues and cell lines.
A and B: The mRNA and protein expression of transducin (β)-like 1 X-linked receptor 1 (TBL1XR1) in pancreatic ductal adenocarcinoma tissues and adjacent nontumor tissues; C and D: The mRNA and protein expression of TBL1XR1 in pancreatic ductal adenocarcinoma cells. GAPDH: Glyceraldehyde-3-phosphate dehydrogenase; TBL1XR1: Transducin (β)-like 1 X-linked receptor 1.
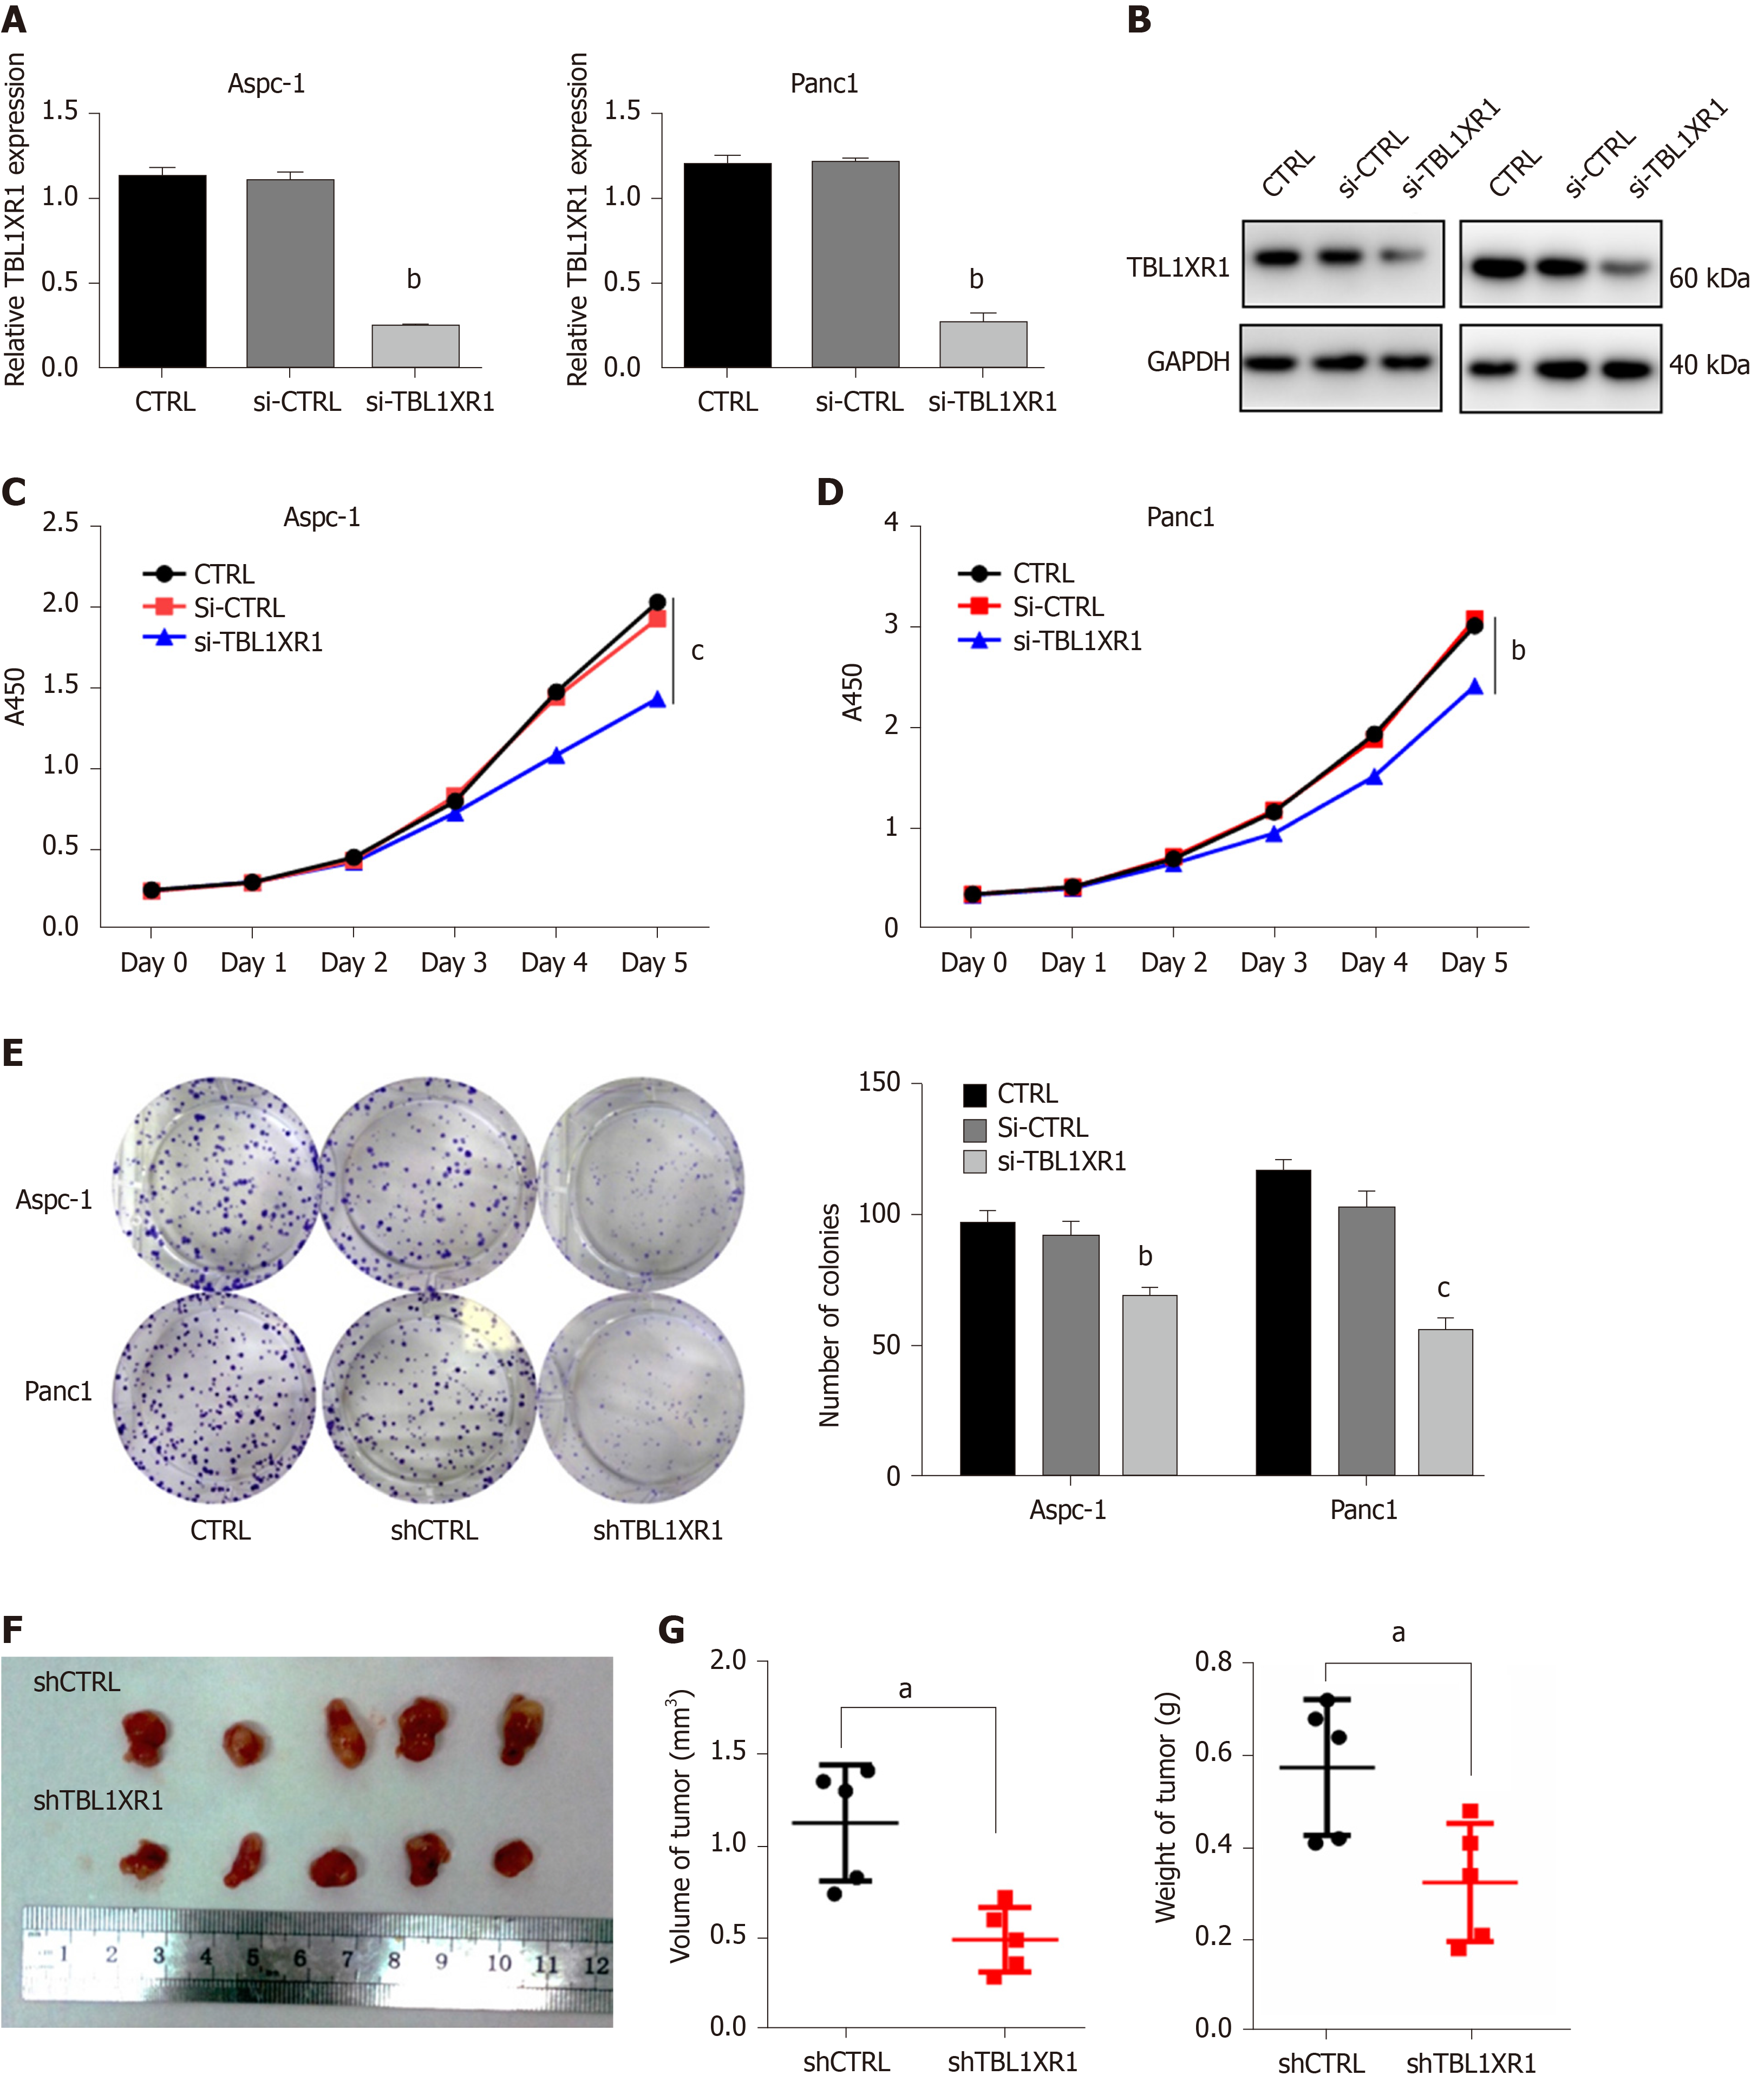
Figure 3 Transducin (β)-like 1 X-linked receptor 1 exhibited oncogenic properties in pancreatic ductal adenocarcinoma cell lines.
A: The transfection efficiency of transducin (β)-like 1 X-linked receptor 1 (TBL1XR1) in pancreatic ductal adenocarcinoma (PDAC) cells by quantitative real-time PCR; B: The transfection efficiency of TBL1XR1 in PDAC cells by western blots; C and D: Cellular proliferation of untransfected or transfected Aspc-1 and Panc1 cells was measured using a CCK8 assay daily for 5 d; E: Aspc-1 and Panc1 cells were seeded at 500 cells/well, and the cells were allowed to form colonies. Colony numbers were counted and recorded; F: Mice were treated with Lv-shCTRL and Lv-shTBL1XR1 PDAC cells; G: Tumor volumes and weights were measured. aP < 0.05, bP < 0.01, cP < 0.001. GAPDH: Glyceraldehyde-3-phosphate dehydrogenase; TBL1XR1: Transducin (β)-like 1 X-linked receptor 1; CTRL: Control; Si-CTRL: CTRL siRNA; Si-TBL1XR1: TBL1XR1 siRNA; ShRNA: Short hairpin RNA; ShCTRL: CTRL shRNA; ShTBL1XR1: TBL1XR1 shRNA.
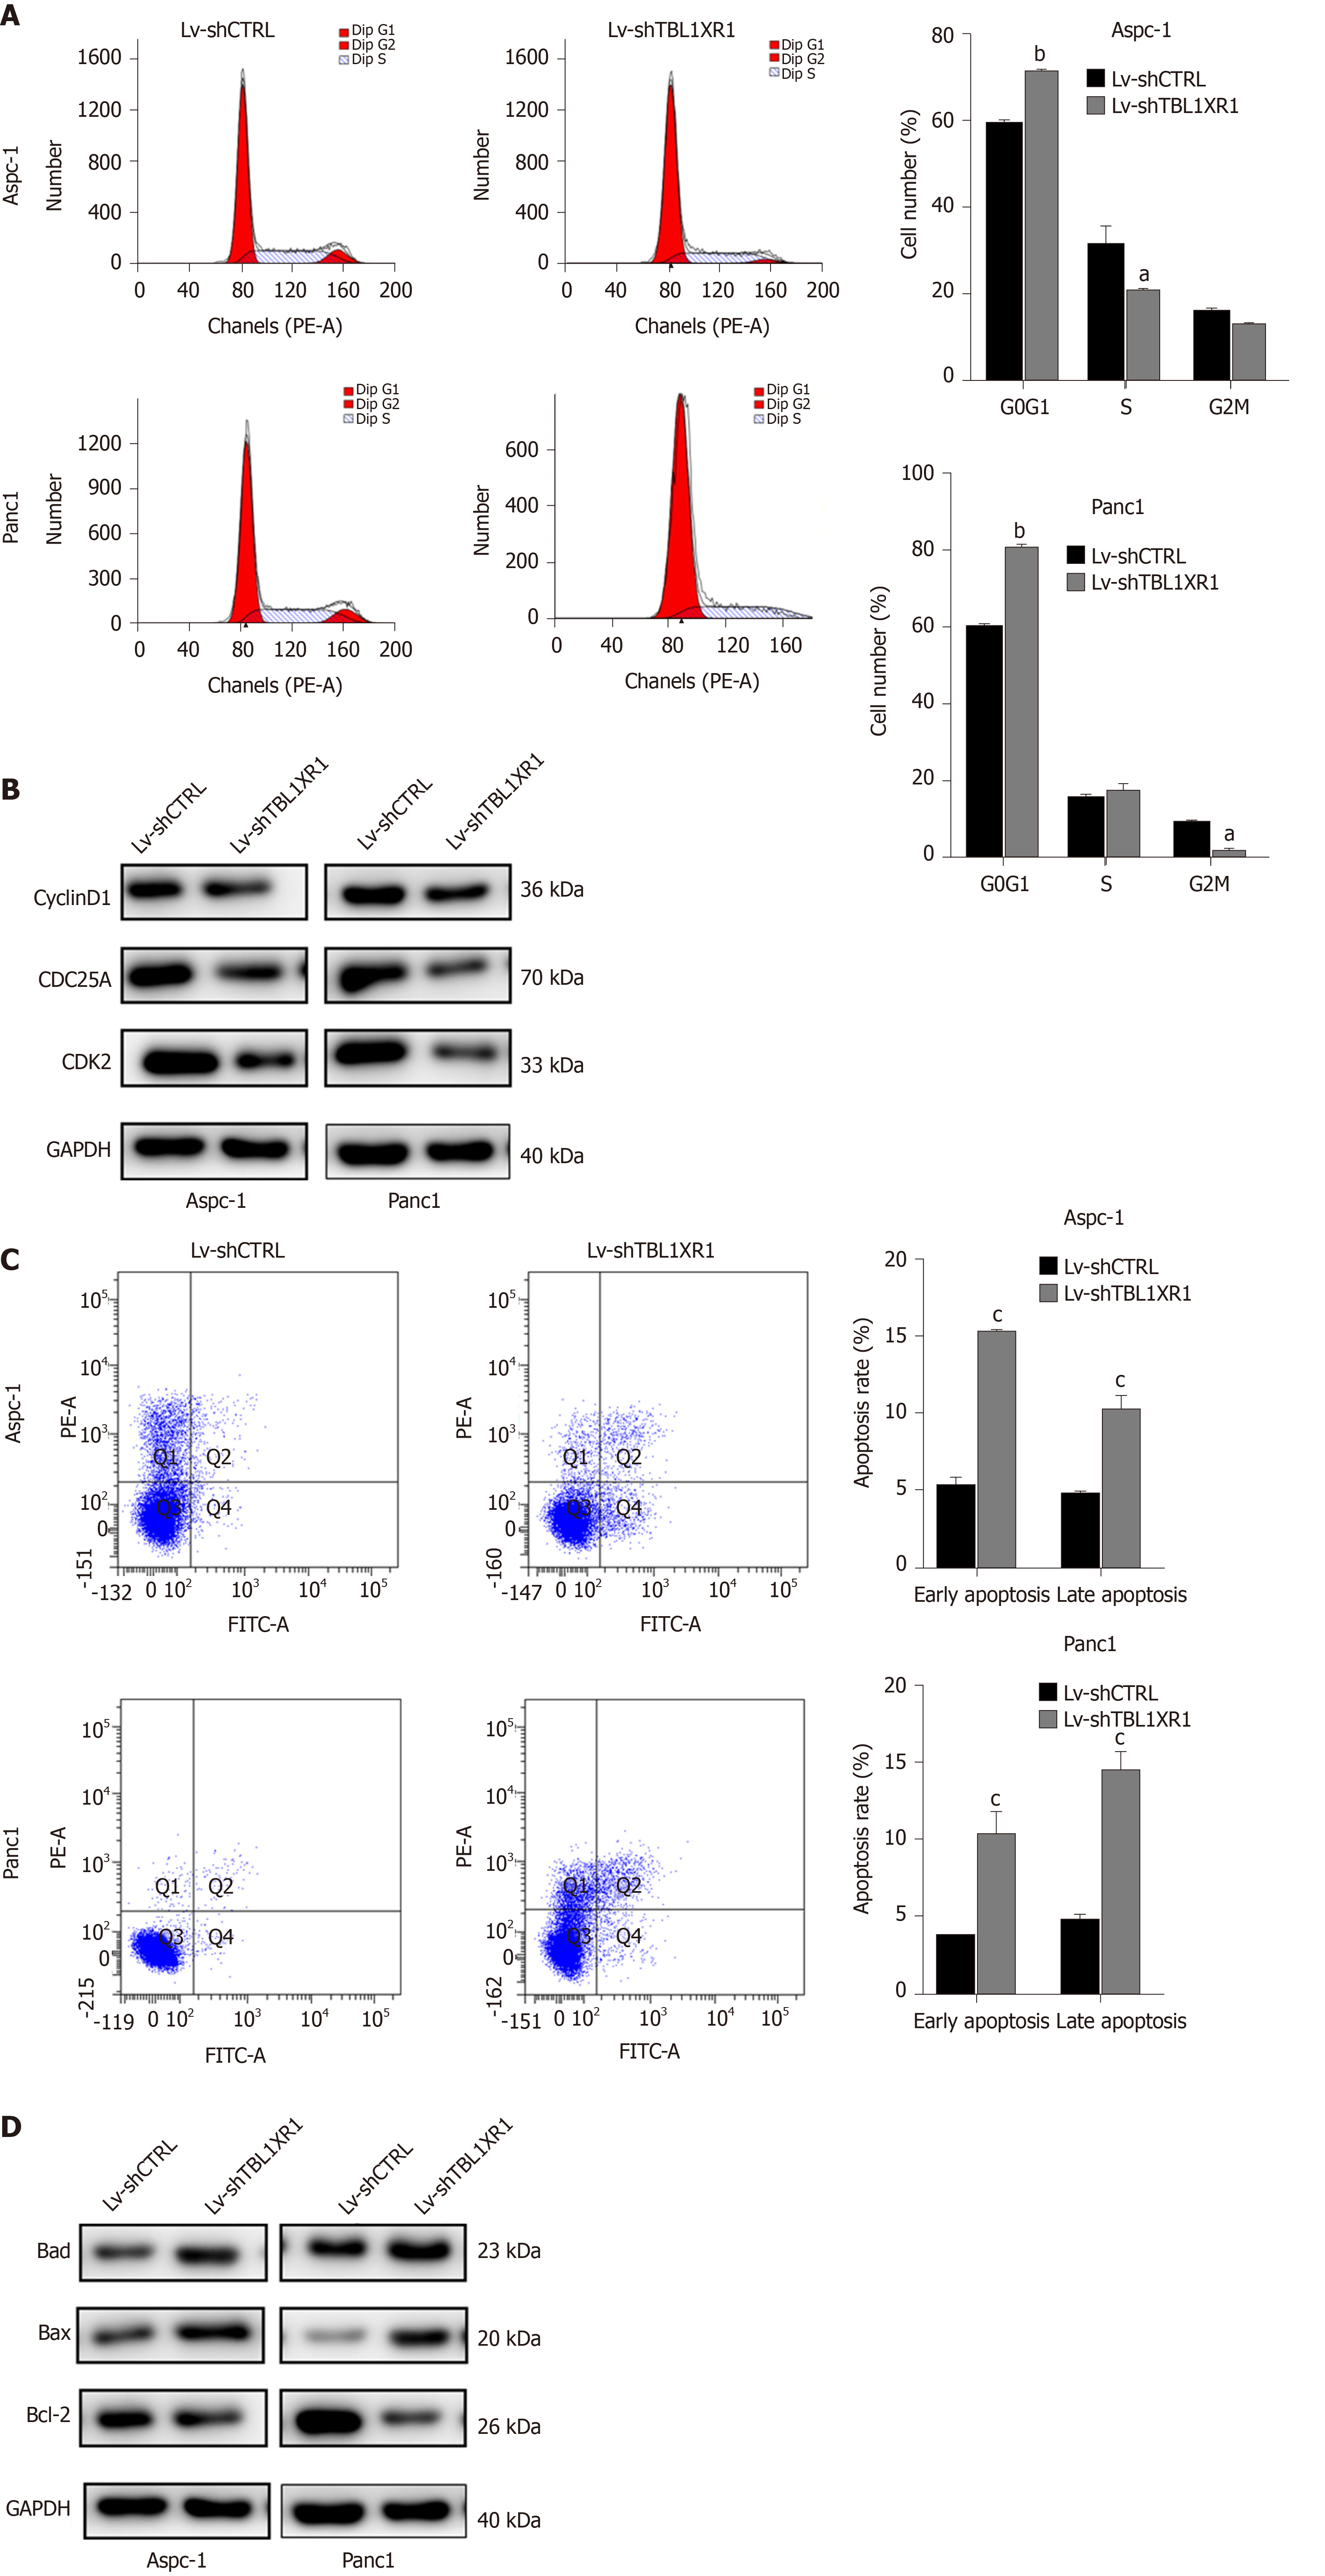
Figure 4 Effects of transducin (β)-like 1 X-linked receptor 1 silencing on cell cycle progression and apoptosis.
A: The cell cycle phases of treated cells were evaluated by flow cytometry after transfection for 48 h. The X-axis indicates the different periodic distribution, and the y-axis indicates the number of cells. B: The protein levels of cell cycle regulators, such as CDK2, CDC25A and cyclinD1, were examined by western blotting analysis. C: Untransfected and transfected pancreatic ductal adenocarcinoma cells were analyzed by flow cytometry with annexin V–fluorescein 5-isothiocyanate/propidium iodide (PI) staining. The X-axis indicates annexin V-fluorescein 5-isothiocyanate, and the Y-axis indicates PI staining. Annexin V/PI+ represents necrotic cells, annexin V+/PI represents early apoptotic cells, and annexin V+/PI+ represents late apoptotic cells. D: The protein levels of bad, bax and bcl-2 were examined by western blotting analysis. aP < 0.05, bP < 0.01, cP < 0.001. GAPDH: Glyceraldehyde-3-phosphate dehydrogenase; TBL1XR1: Transducin (β)-like 1 X-linked receptor 1.
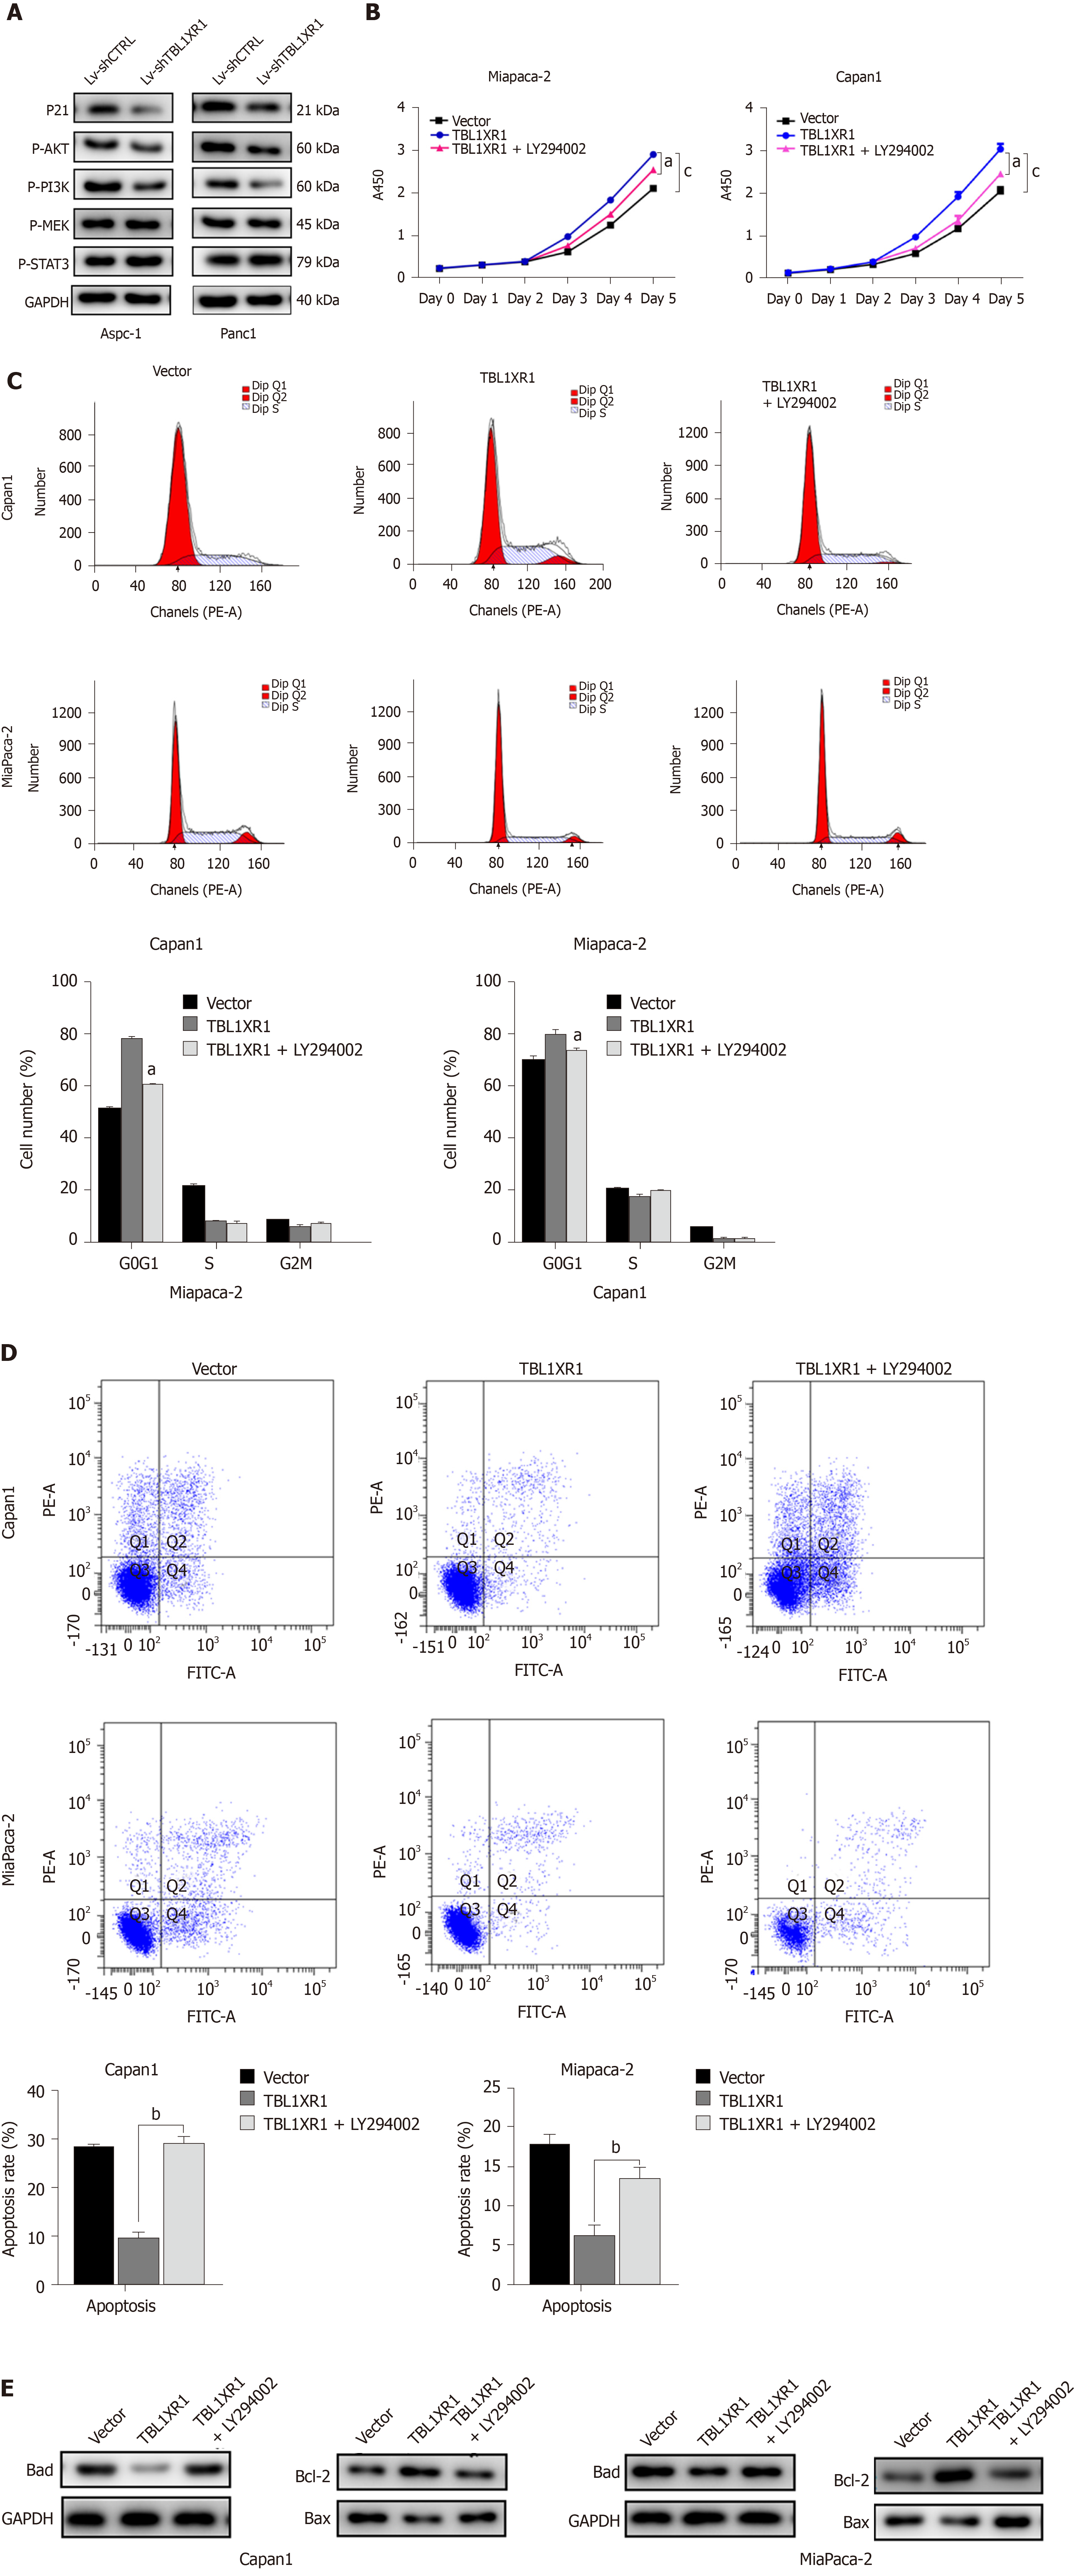
Figure 5 Transducin (β)-like 1 X-linked receptor 1 regulates phosphatidylinositol 3-kinase/protein kinase B signaling in pancreatic ductal adenocarcinoma cells.
A: Western blot analysis of phosphatidylinositol 3-kinase/protein kinase B (PI3K/Akt) signaling-related proteins in both cell lines. GAPDH was used as a loading control; B: Cellular proliferation of pancreatic ductal adenocarcinoma (PDAC) cells treated with or without the PI3K/Akt pathway inhibitor LY294002 was measured using a CCK-8 assay daily for 5 d; C: Cell cycle phase analysis and apoptosis of PDAC cells treated with or without LY294002 were analyzed by flow cytometry. The X-axis indicates the different periodic distributions, and the Y-axis indicates the number of cells. D: Apoptosis analysis of PDAC cells treated with or without LY294002 was analyzed by flow cytometry. The Y-axis indicates V–fluorescein 5-isothiocyanate, and the Y-axis indicates propidium iodide (PI) staining. Annexin V/PI+ represents necrotic cells, annexin V+/PI represents early apoptotic cells, and annexin V+/PI+ represents late apoptotic cells. E: Western blot analysis of PI3K/Akt signaling-related proteins in PDAC cells treated with or without LY294002. GAPDH: Glyceraldehyde-3-phosphate dehydrogenase; TBL1XR1: Transducin (β)-like 1 X-linked receptor 1.
- Citation: Gu JF, Fu W, Qian HX, Gu WX, Zong Y, Chen Q, Lu L. TBL1XR1 induces cell proliferation and inhibit cell apoptosis by the PI3K/AKT pathway in pancreatic ductal adenocarcinoma. World J Gastroenterol 2020; 26(25): 3586-3602
- URL: https://www.wjgnet.com/1007-9327/full/v26/i25/3586.htm
- DOI: https://dx.doi.org/10.3748/wjg.v26.i25.3586


