Copyright
©The Author(s) 2020.
World J Gastroenterol. Jun 21, 2020; 26(23): 3283-3292
Published online Jun 21, 2020. doi: 10.3748/wjg.v26.i23.3283
Published online Jun 21, 2020. doi: 10.3748/wjg.v26.i23.3283
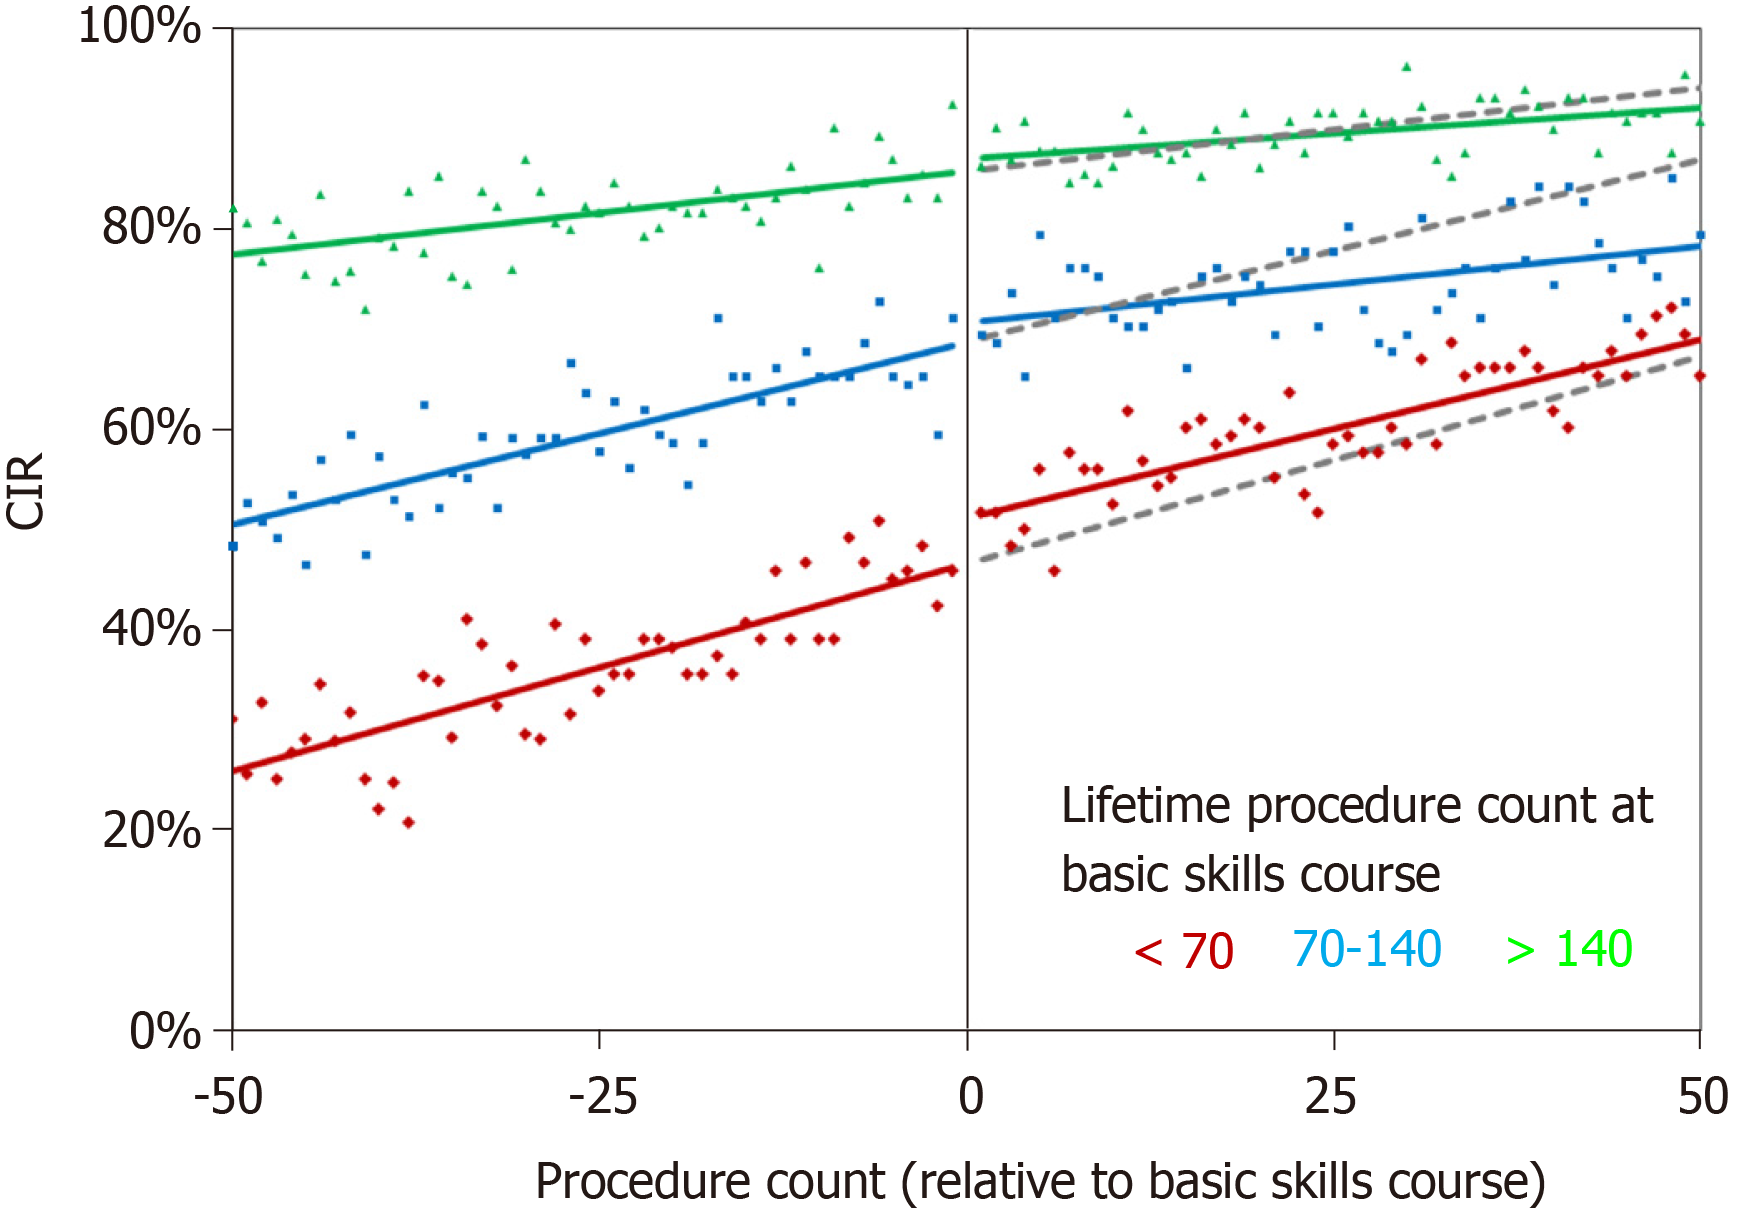
Figure 1 Changes over time in unassisted caecal intubation rate by lifetime procedure count at the basic skills course.
Points represent the observed caecal intubation rate (CIR) at each procedure number. Coloured lines are from the interrupted time series models reported in Table 1. Grey lines are the corresponding forecasted trends in CIR, had the basic skills course not been performed.
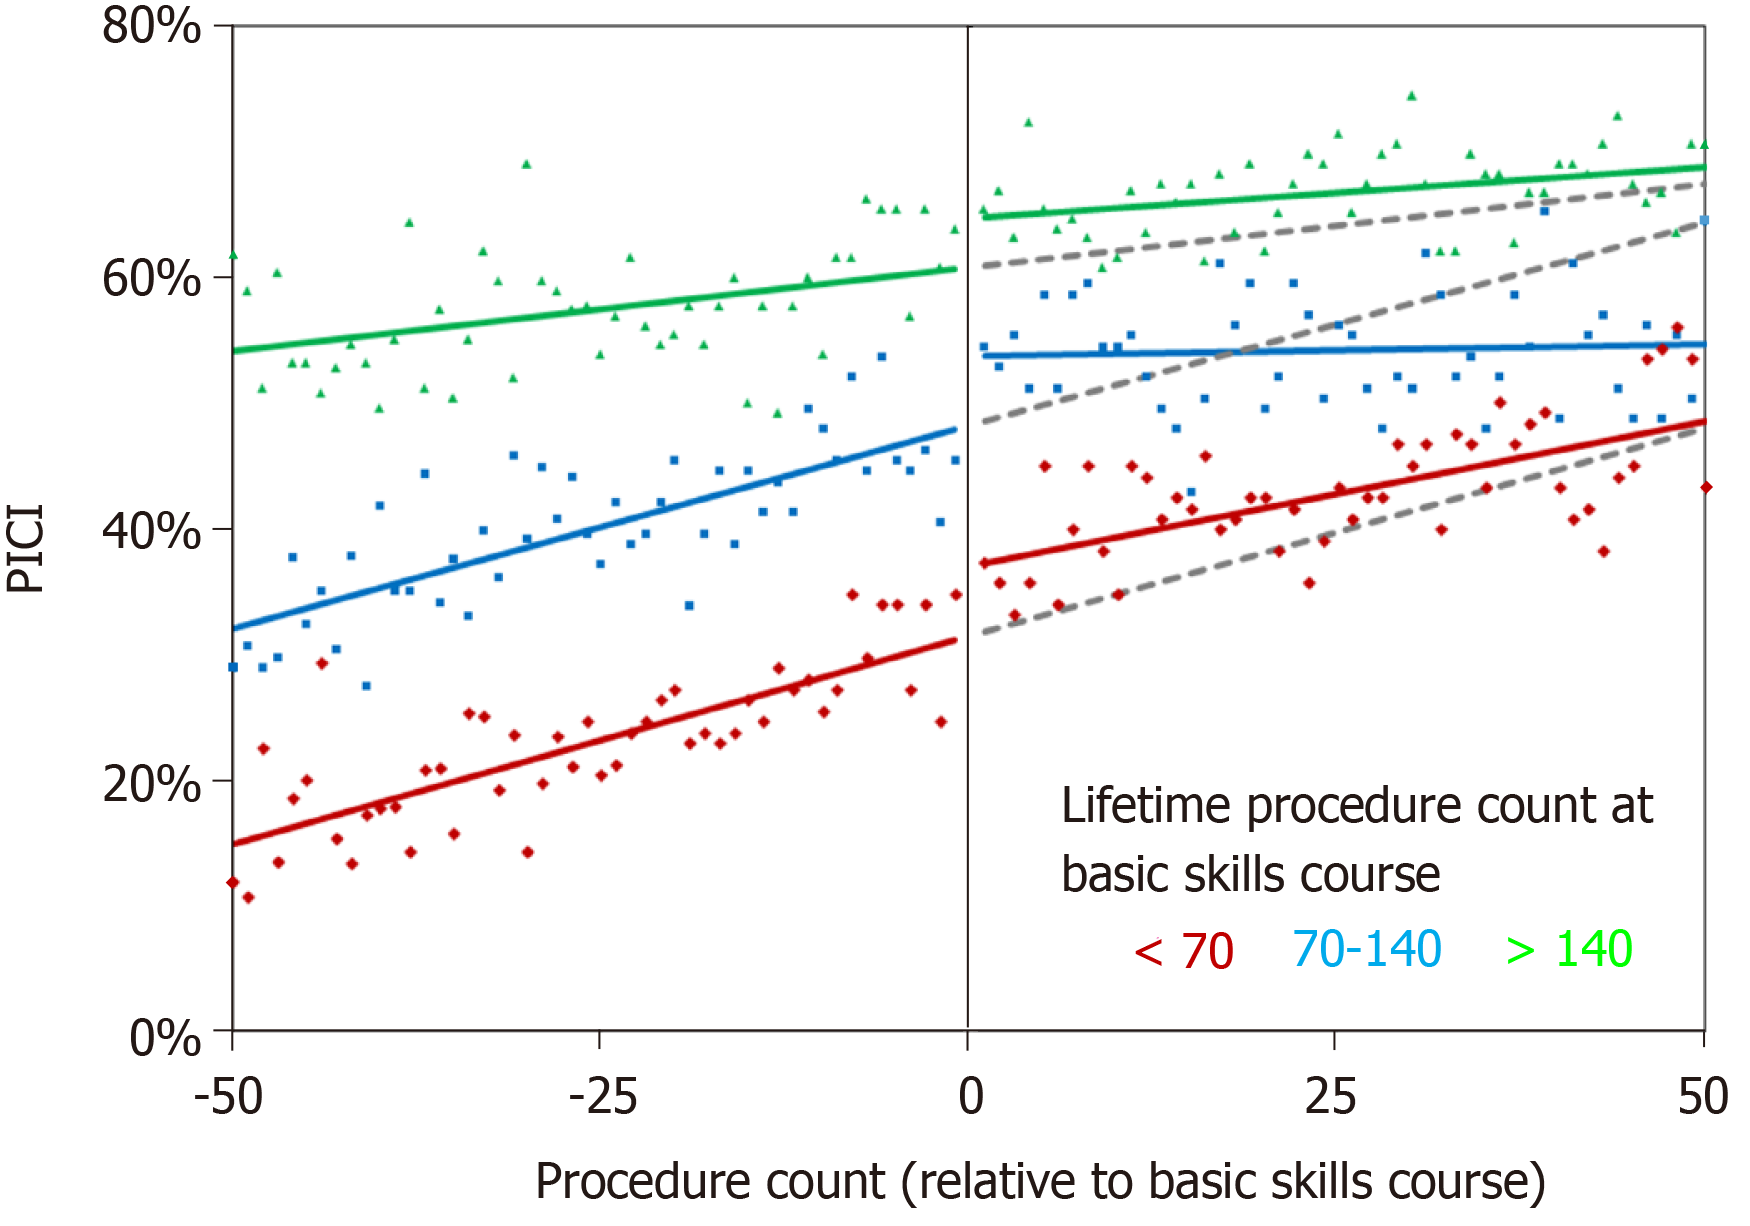
Figure 2 Changes over time in the performance indicator of colonic intubation by lifetime procedure count at the basic skills course.
Points represent the observed performance indicator of colonic intubation (PICI) at each procedure number. Coloured lines are from the interrupted time series models reported in Table 2. Grey lines are the corresponding forecasted trends in PICI, had the basic skills course not been performed.
- Citation: Siau K, Hodson J, Anderson JT, Valori R, Smith G, Hagan P, Iacucci M, Dunckley P. Impact of a national basic skills in colonoscopy course on trainee performance: An interrupted time series analysis. World J Gastroenterol 2020; 26(23): 3283-3292
- URL: https://www.wjgnet.com/1007-9327/full/v26/i23/3283.htm
- DOI: https://dx.doi.org/10.3748/wjg.v26.i23.3283


