Copyright
©The Author(s) 2020.
World J Gastroenterol. May 28, 2020; 26(20): 2584-2598
Published online May 28, 2020. doi: 10.3748/wjg.v26.i20.2584
Published online May 28, 2020. doi: 10.3748/wjg.v26.i20.2584
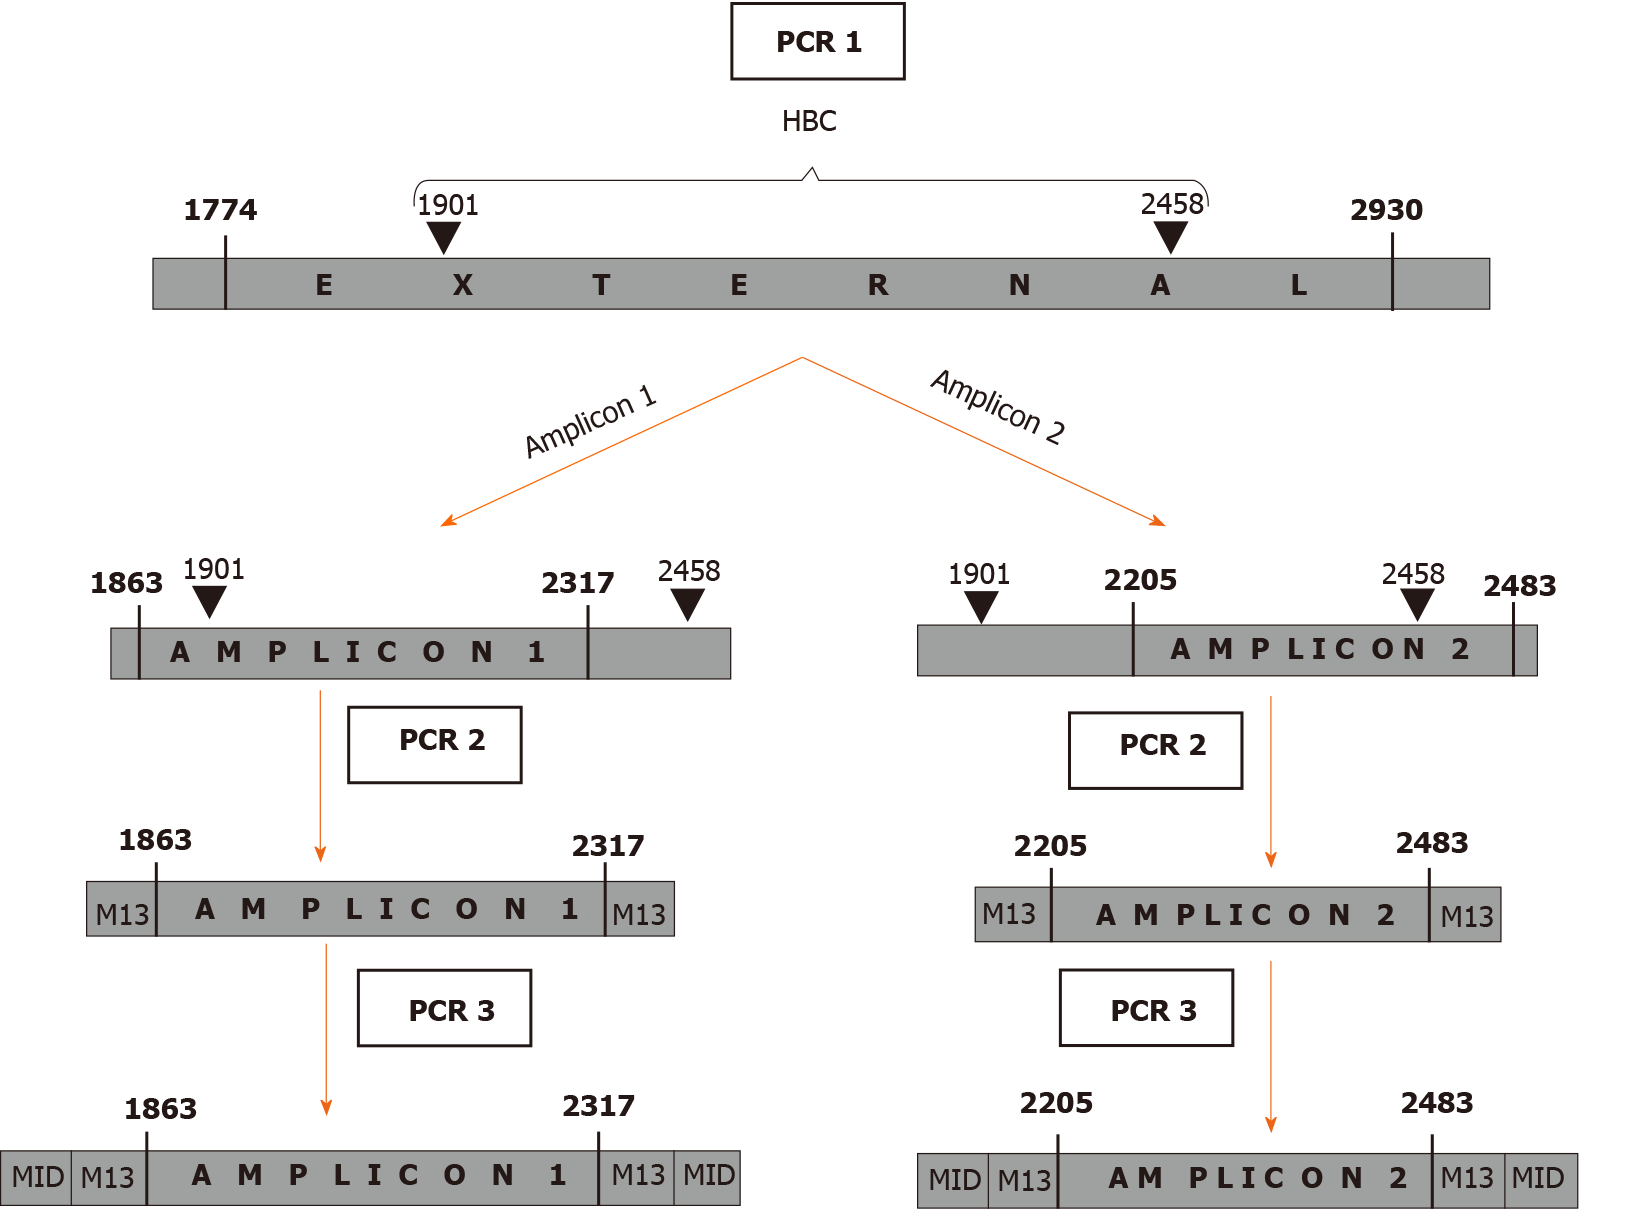
Figure 1 Schematic summary of the 3 amplification steps.
In the first amplification step (PCR1), a large region was amplified. In the following step (PCR2), the region was divided into 2 amplicons that overlapped in a 112 nucleotide-long portion. In the third step (PCR 3) a sample identifier (MID) was added. PCR: Polymerase chain reaction; MID: Multiplex identifier.
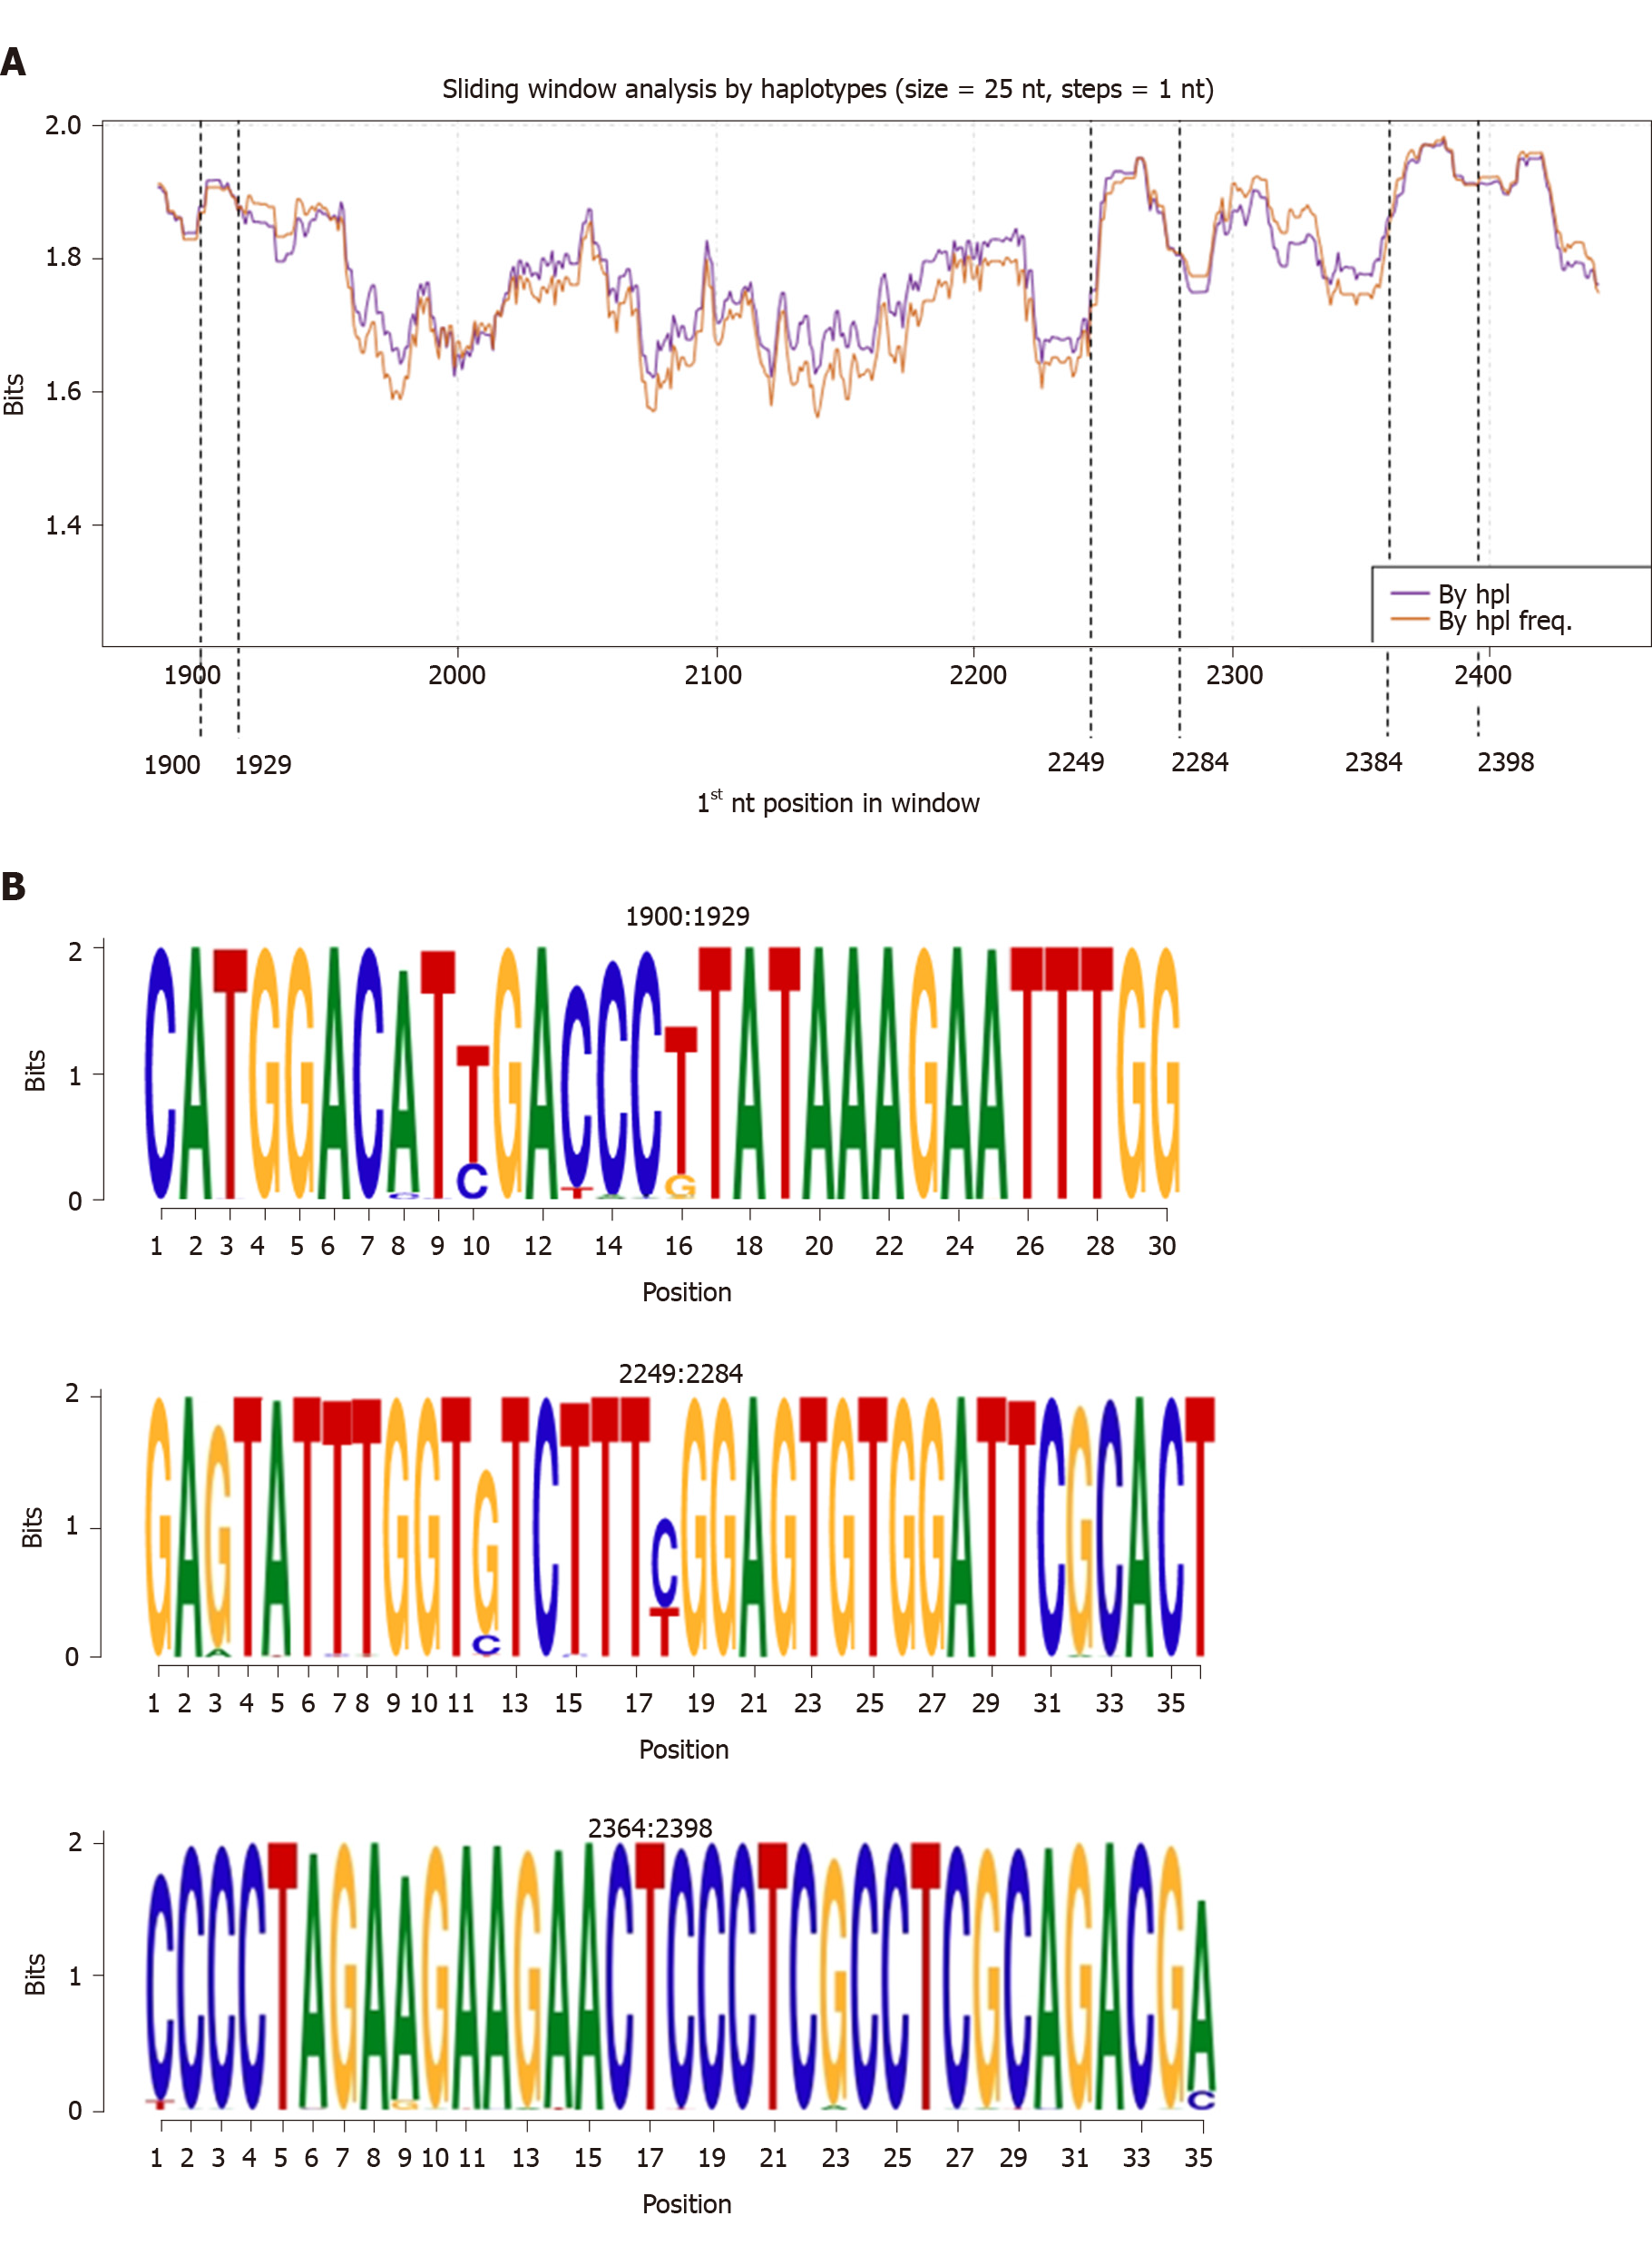
Figure 2 Information content analysis at nucleotide level.
A: Sliding window analysis of Hepatitis B core gene performed by aligning the quasispecies haplotypes for all 38 patients with and without considering their relative frequency. Each point on the graph represents the mean information content (in bits) of the 25-nucleotides windows, with forward displacement of 1 nucleotide step between windows. The purple line shows the analysis by haplotype (By hpl), which is the mean information content obtained from the multiple alignments of all quasispecies haplotypes. The orange line represents the analysis by haplotype frequency (By hpl freq), which is the mean information content from the multiple alignments of all the patients’ quasispecies haplotypes considering their relative frequency. The dashed lines indicate the 3 common hyper-conserved regions observed, with reporting of their positions. B: Representation of detected hyper-conserved regions as sequence logos (with reporting of nucleotide positions). The relative sizes of the letters in each stack indicate their relative frequencies at each position within the multiple alignments of nucleotide haplotypes. The total height of each stack of letters depicts the information content of each nucleotide position, measured in bits (Y-axis): from minimum (0) to maximum conservation (2). By hpl: Analysis by haplotype; By hpl freq: Analysis by haplotype frequency; nt: Nucleotide.
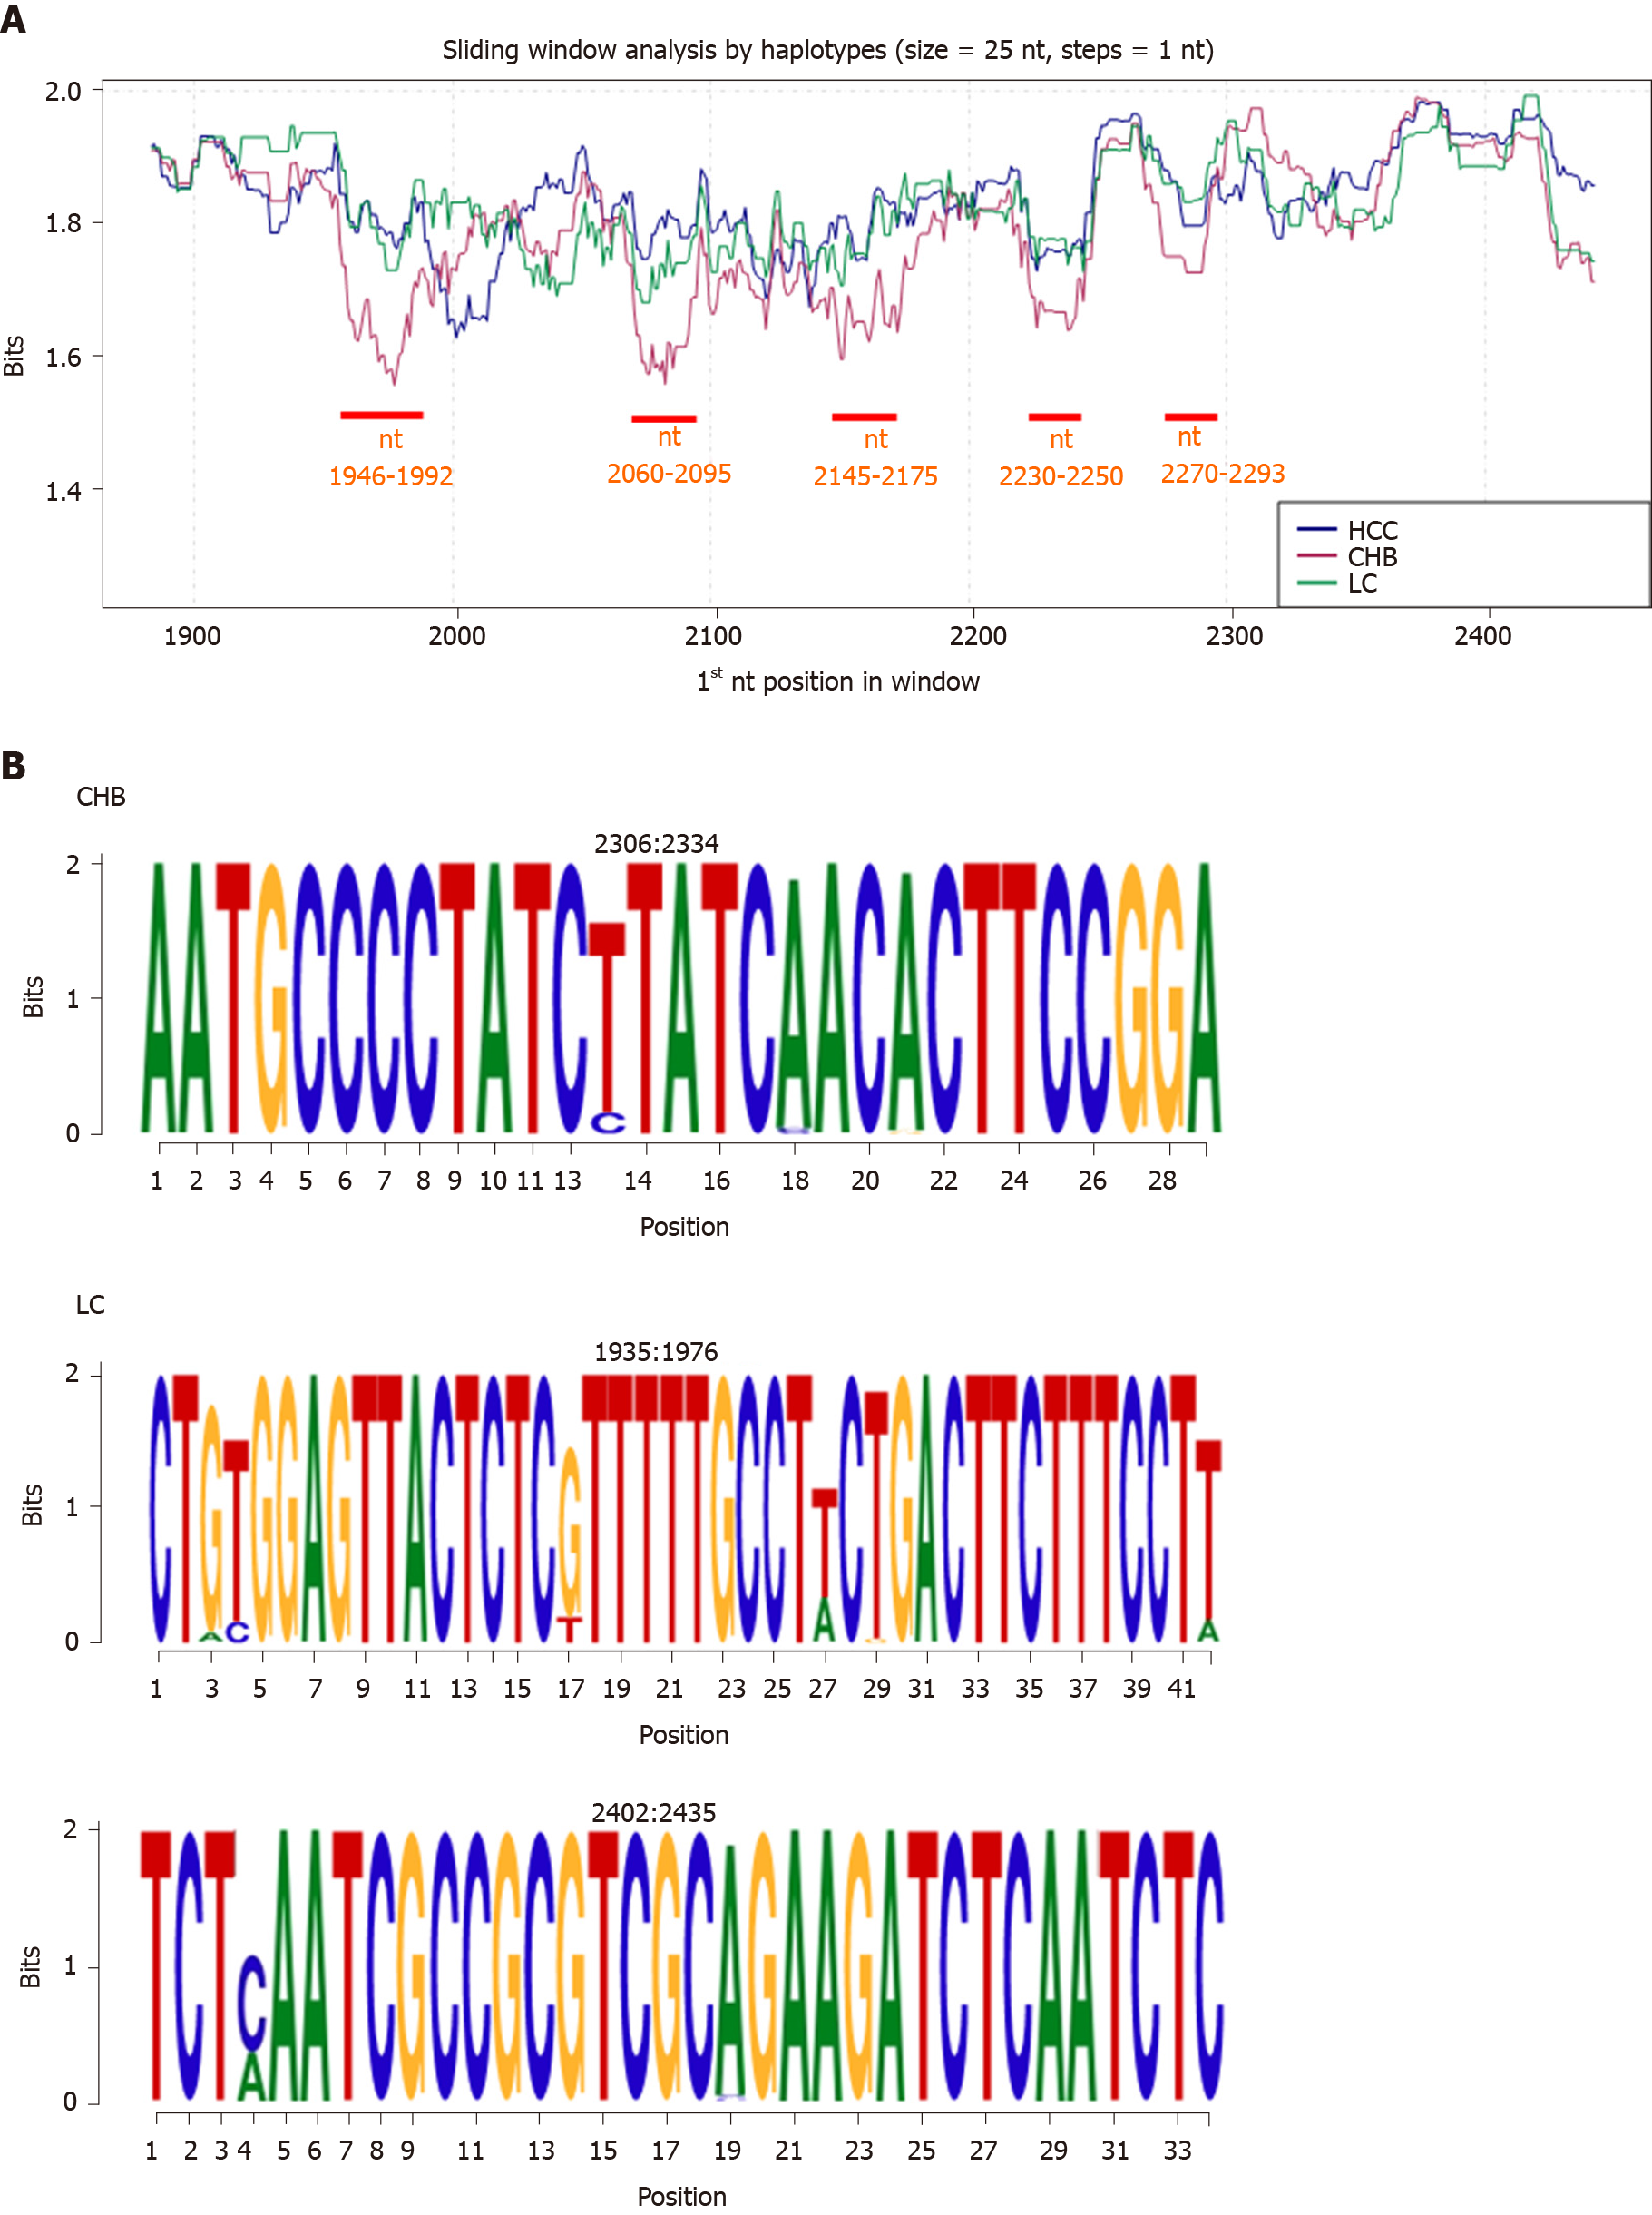
Figure 3 Information content analysis at nucleotide level by clinical stage group.
A: By-haplotype sliding window analysis of the Hepatitis B core gene according to different clinical groups (HCC in blue, CHB in red, and LC in green). The portions and positions where CHB showed lower levels of conservation than the others (P < 0.05) are shown in red. B: Representation of the information content of CHB- and LC-specific conserved nucleotide regions as sequence logos. Positions are reported at the top of each logo. CHB: Chronic hepatitis B infection without liver damage; HCC: Hepatocellular carcinoma; LC: Liver cirrhosis; nt: Nucleotide; P: P value.
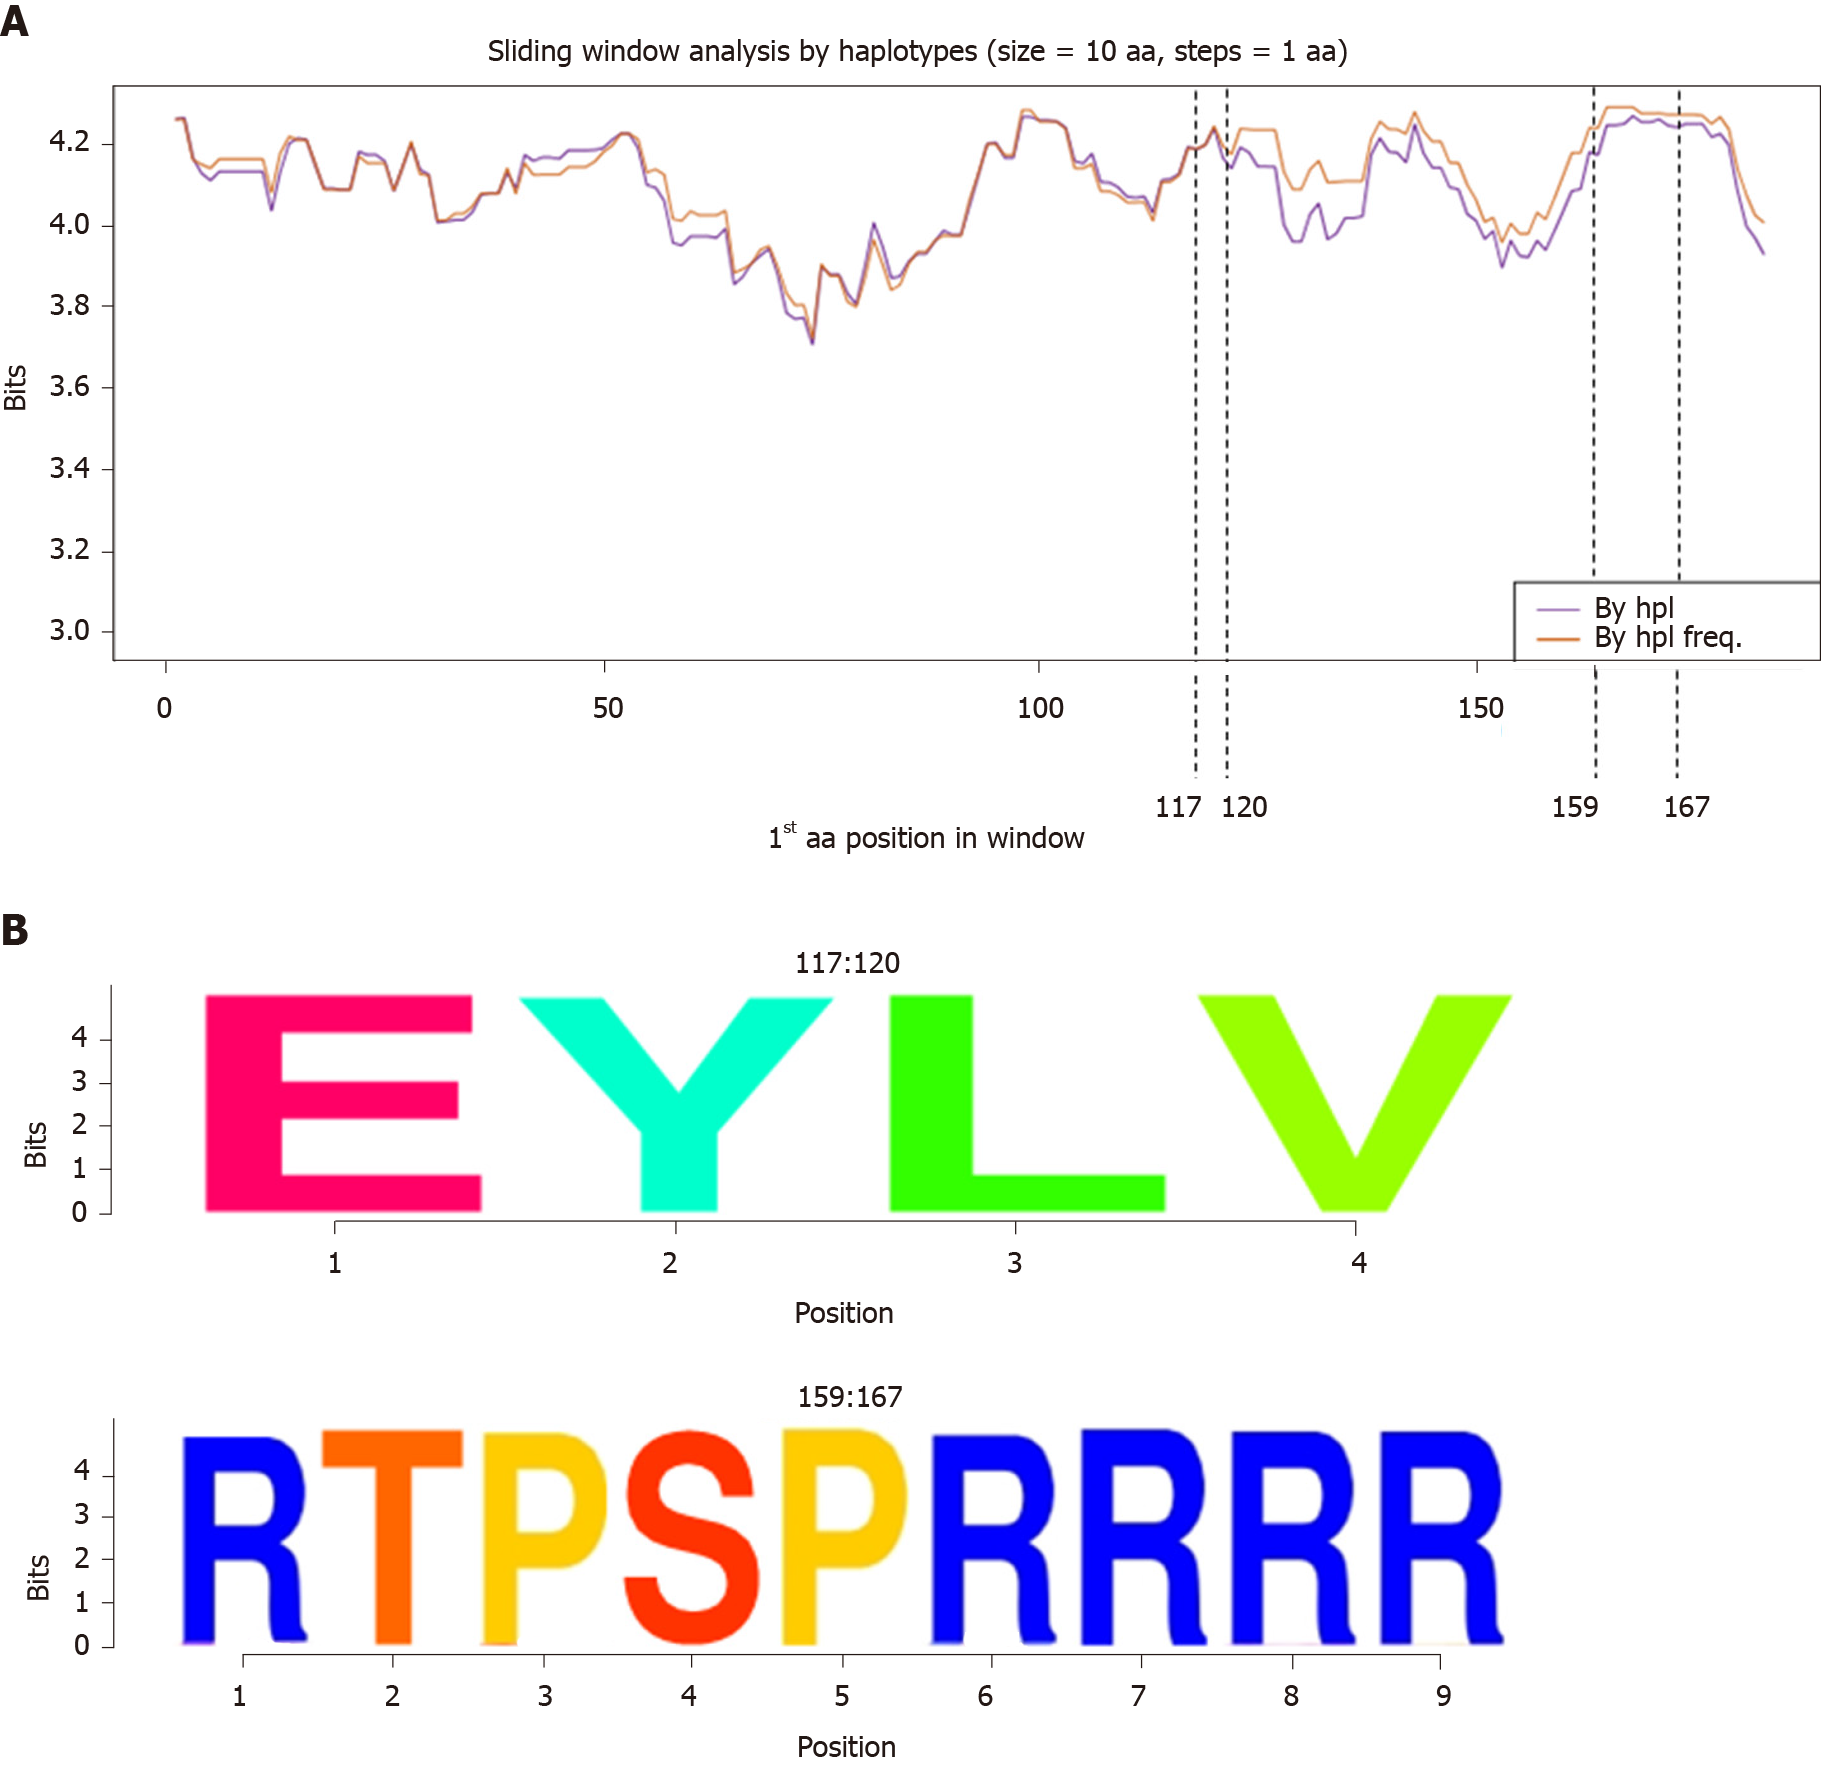
Figure 4 Information content analysis at amino acid level.
A: Sliding window analysis of the Hepatitis B core protein sequence for all 38 patients with and without consideration of relative frequency. Each point on the graph is the result of the mean information content (in bits) of the 10-amino acid in size windows, with forward displacement between them of 1 amino acid step. The purple line represents the information content of all the quasispecies haplotypes (By hpl) whereas the orange line indicates the information content considering haplotype frequency (By hpl freq). The dashed lines show the 2 common amino acid hyper-conserved regions observed, with reporting of their positions. B: Representation of amino acid hyper-conserved regions detected as sequence logos (with reporting of amino acid positions). The relative sizes of the letters in each stack indicate their relative frequencies at each position within the multiple alignments of amino acid haplotypes. The total height of each stack depicts the information content of each amino acid position, measured in bits (Y-axis); range: 0 bits (0% conservation) to 4.32 bits (100% conservation). By hpl: Analysis by haplotype; By hpl freq: Analysis by haplotype frequency; aa: Amino acid.
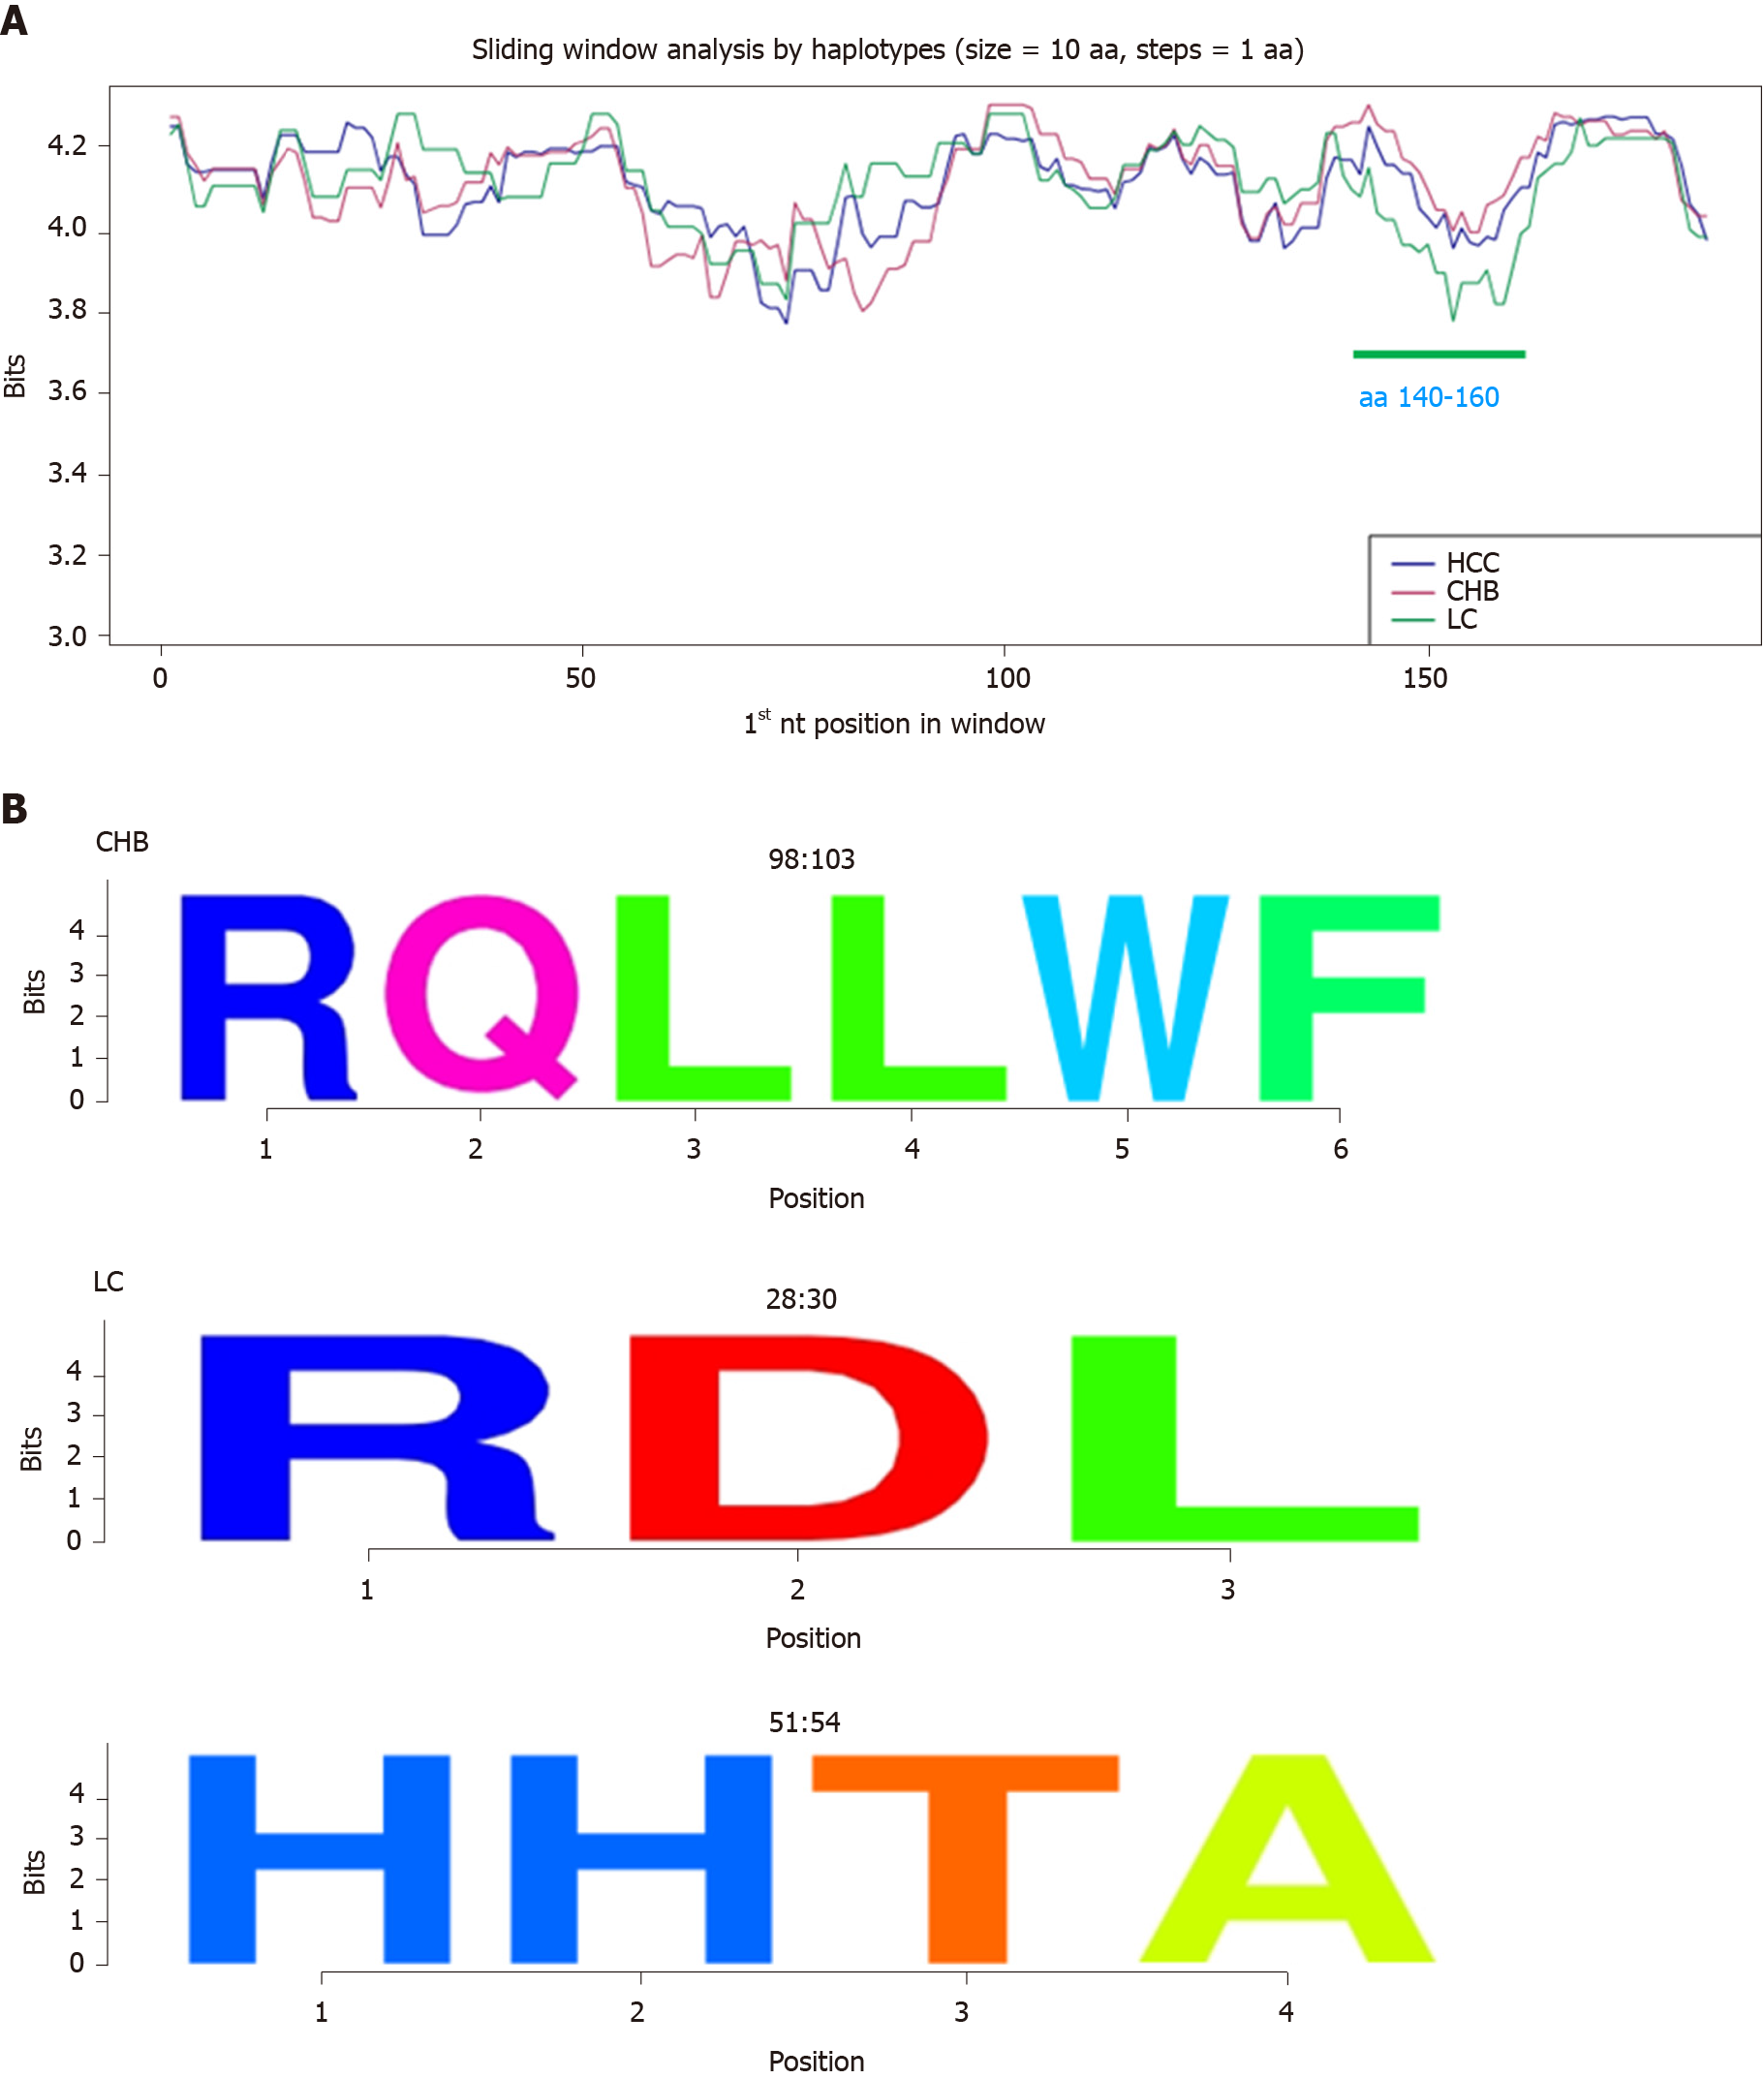
Figure 5 Information content analysis at amino acid level by clinical group.
A: Sliding window analysis of the Hepatitis B core protein by haplotype between the different clinical groups (HCC in blue, CHB in red, and LC in green). The green horizontal line corresponds to the region where LC group is less conserved compared to the CHB and HCC groups (P < 0.05). B: Representation of CHB- and LC-specific conserved amino acid regions as sequence logos. Positions are reported at the top of each logo. CHB: Chronic hepatitis B infection without liver damage; HCC: Hepatocellular carcinoma; LC: Liver cirrhosis; aa: Amino acid; P: P value.
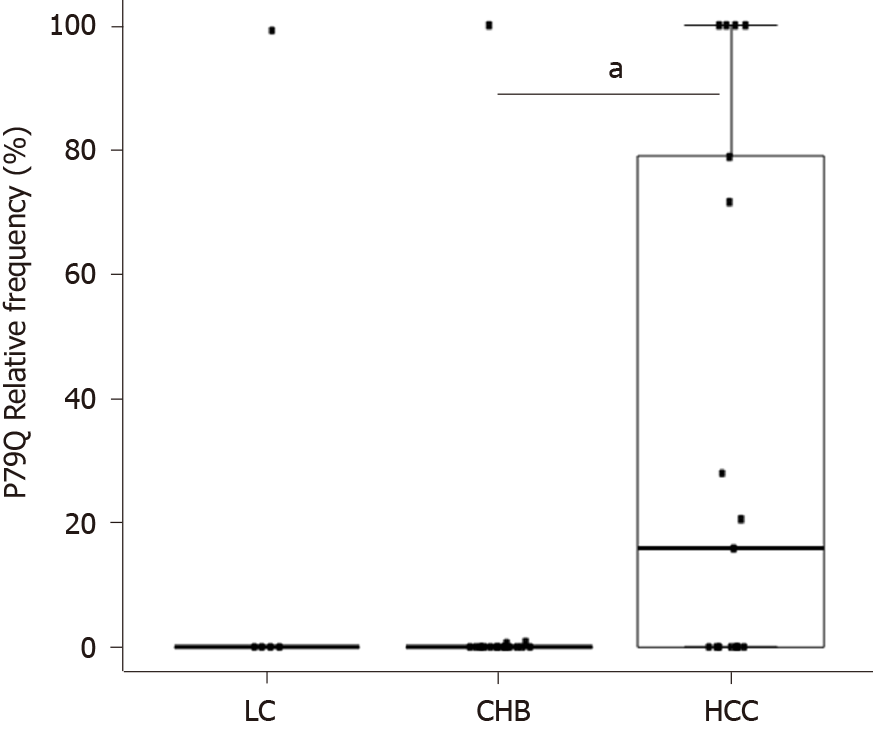
Figure 6 Relative frequency of P79Q substitution in the 3 clinical groups.
Each dot represents a patient. The Bonferroni-corrected P value was calculated by Kruskal-Wallis test with posthoc Dunn multiple comparison test. (aP < 0.05). CHB: Chronic hepatitis B infection without liver damage; HCC: Hepatocellular carcinoma; LC: Liver cirrhosis; P: P value; P79Q: Proline to glutamine in position 79.
- Citation: Yll M, Cortese MF, Guerrero-Murillo M, Orriols G, Gregori J, Casillas R, González C, Sopena S, Godoy C, Vila M, Tabernero D, Quer J, Rando A, Lopez-Martinez R, Esteban R, Riveiro-Barciela M, Buti M, Rodríguez-Frías F. Conservation and variability of hepatitis B core at different chronic hepatitis stages. World J Gastroenterol 2020; 26(20): 2584-2598
- URL: https://www.wjgnet.com/1007-9327/full/v26/i20/2584.htm
- DOI: https://dx.doi.org/10.3748/wjg.v26.i20.2584


