Copyright
©The Author(s) 2020.
World J Gastroenterol. Apr 7, 2020; 26(13): 1525-1539
Published online Apr 7, 2020. doi: 10.3748/wjg.v26.i13.1525
Published online Apr 7, 2020. doi: 10.3748/wjg.v26.i13.1525
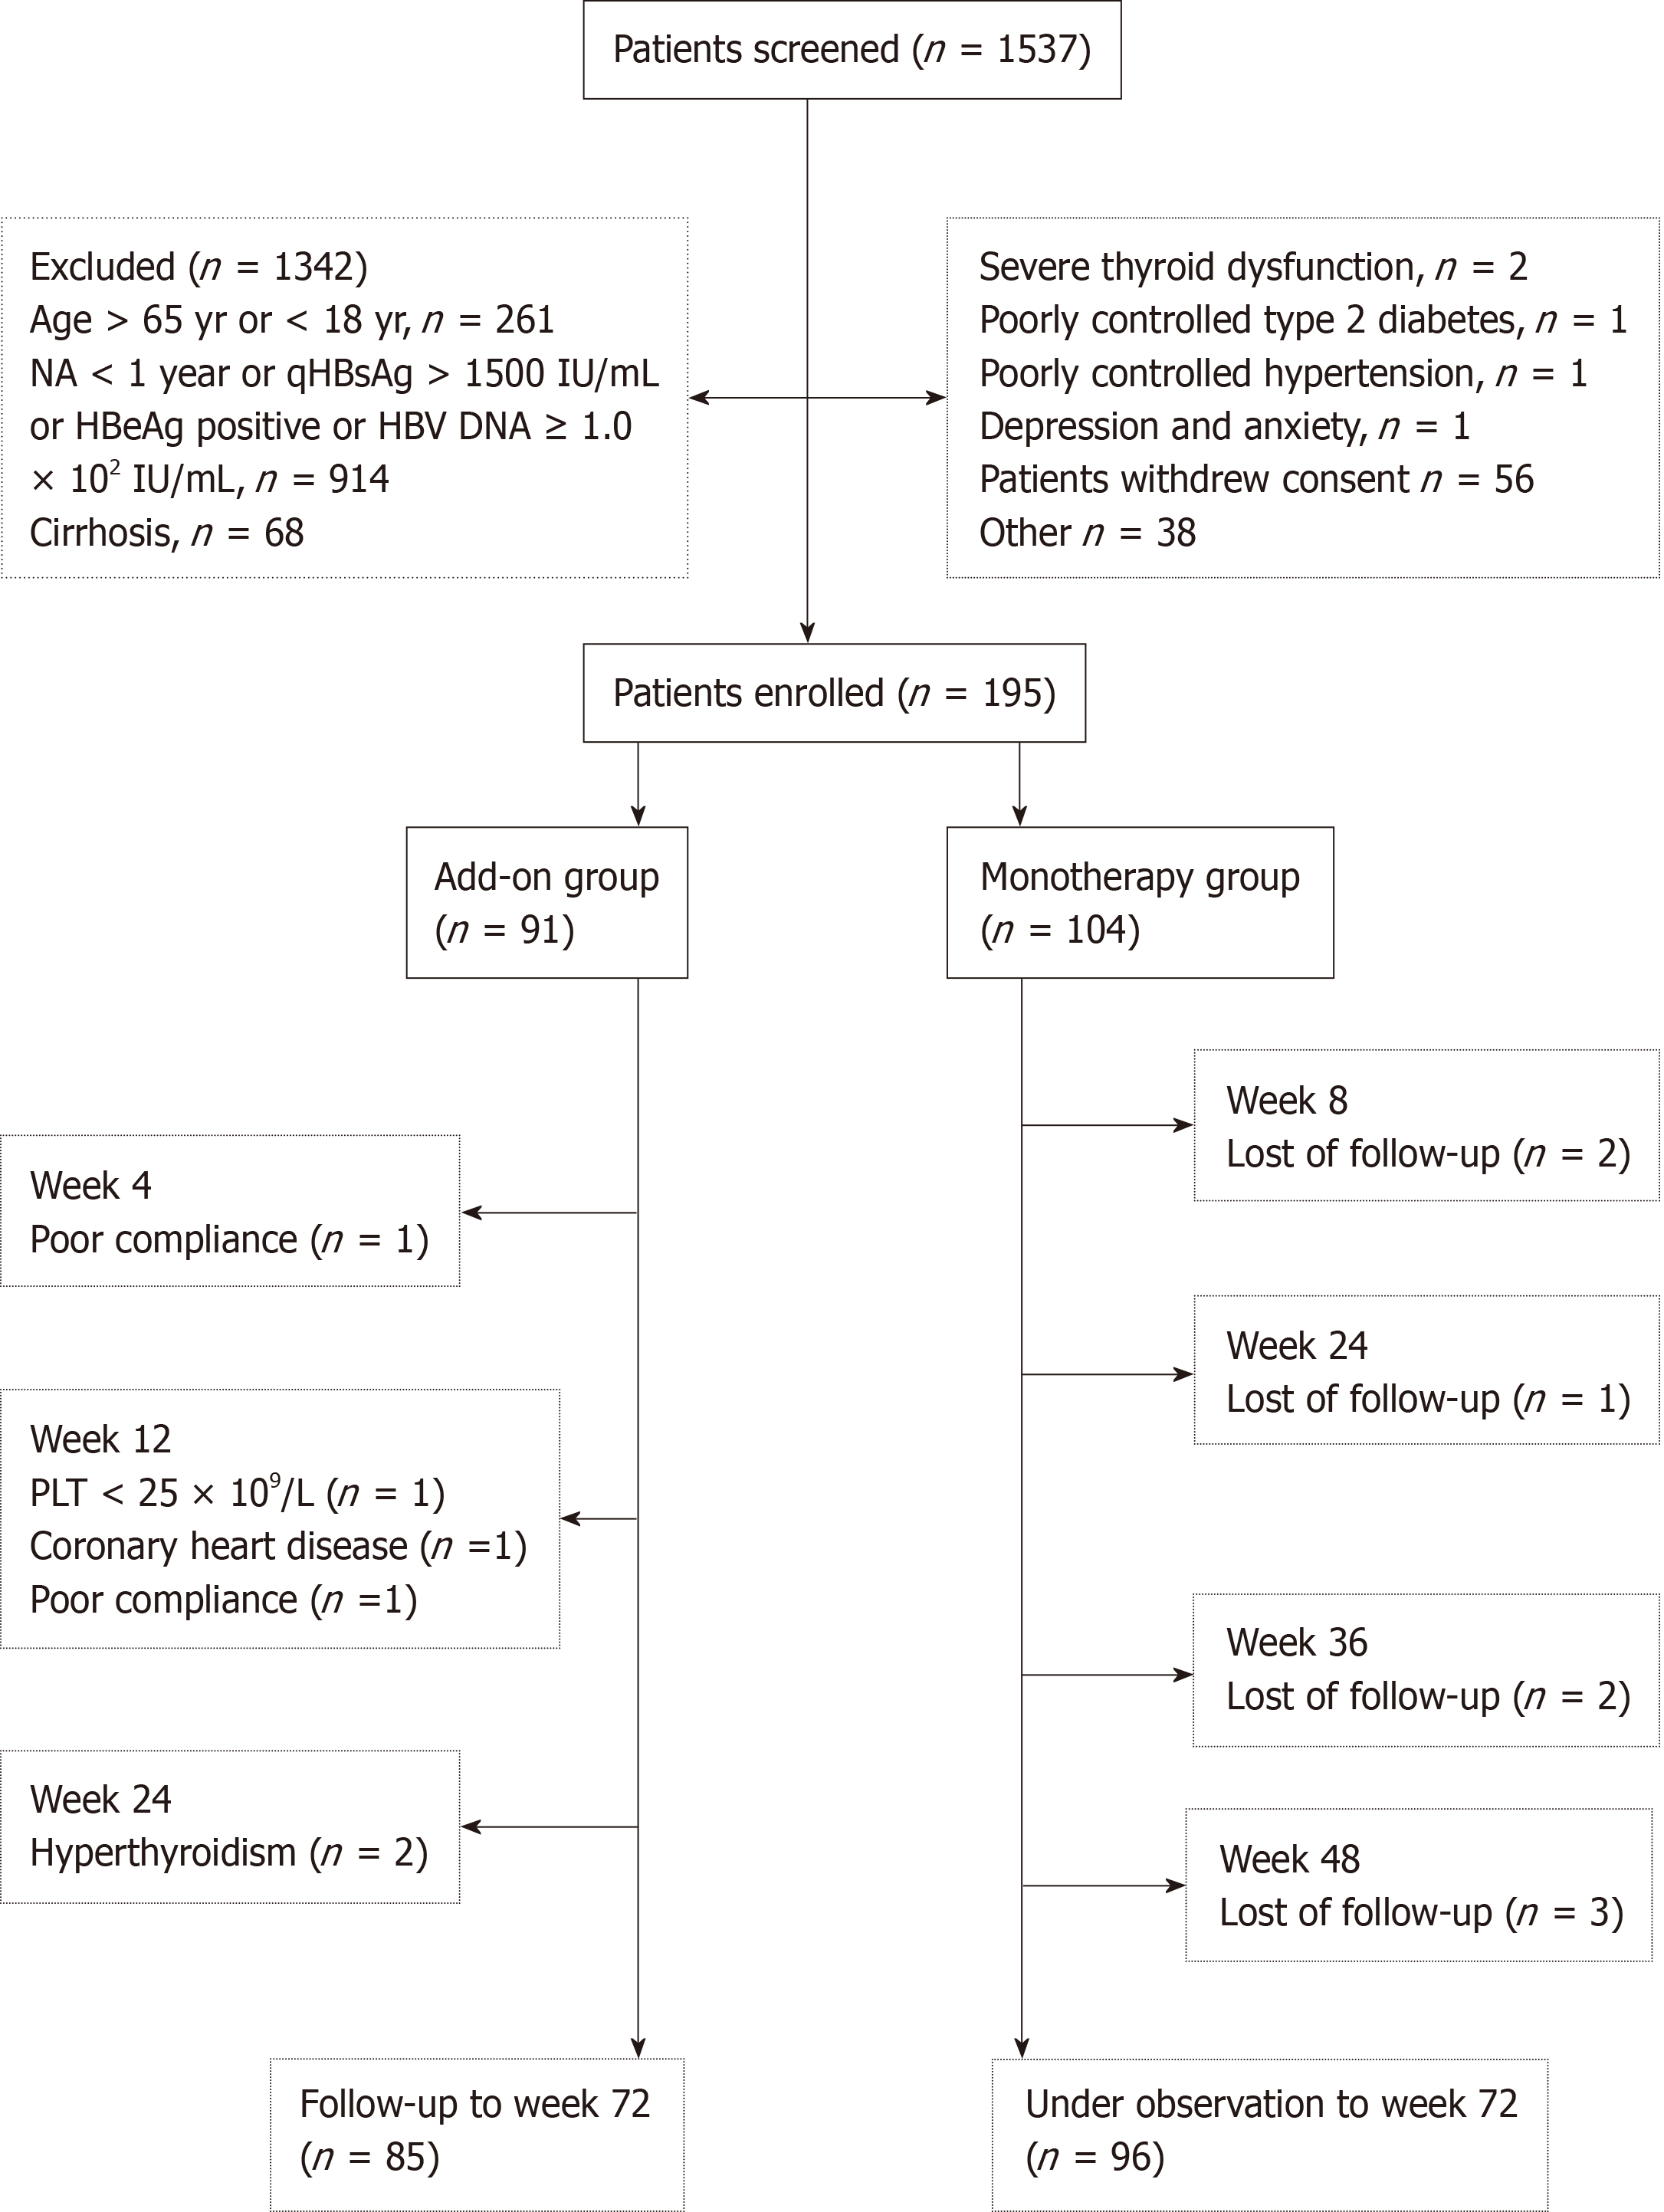
Figure 1 Flow diagram of patients enrolled in this study.
HBsAg: Hepatitis B surface antigen; HBeAg: Hepatitis B e antigen; HBV DNA: Hepatitis B virus-deoxyribonucleic acid; NA: Nucleos(t)ide analog.
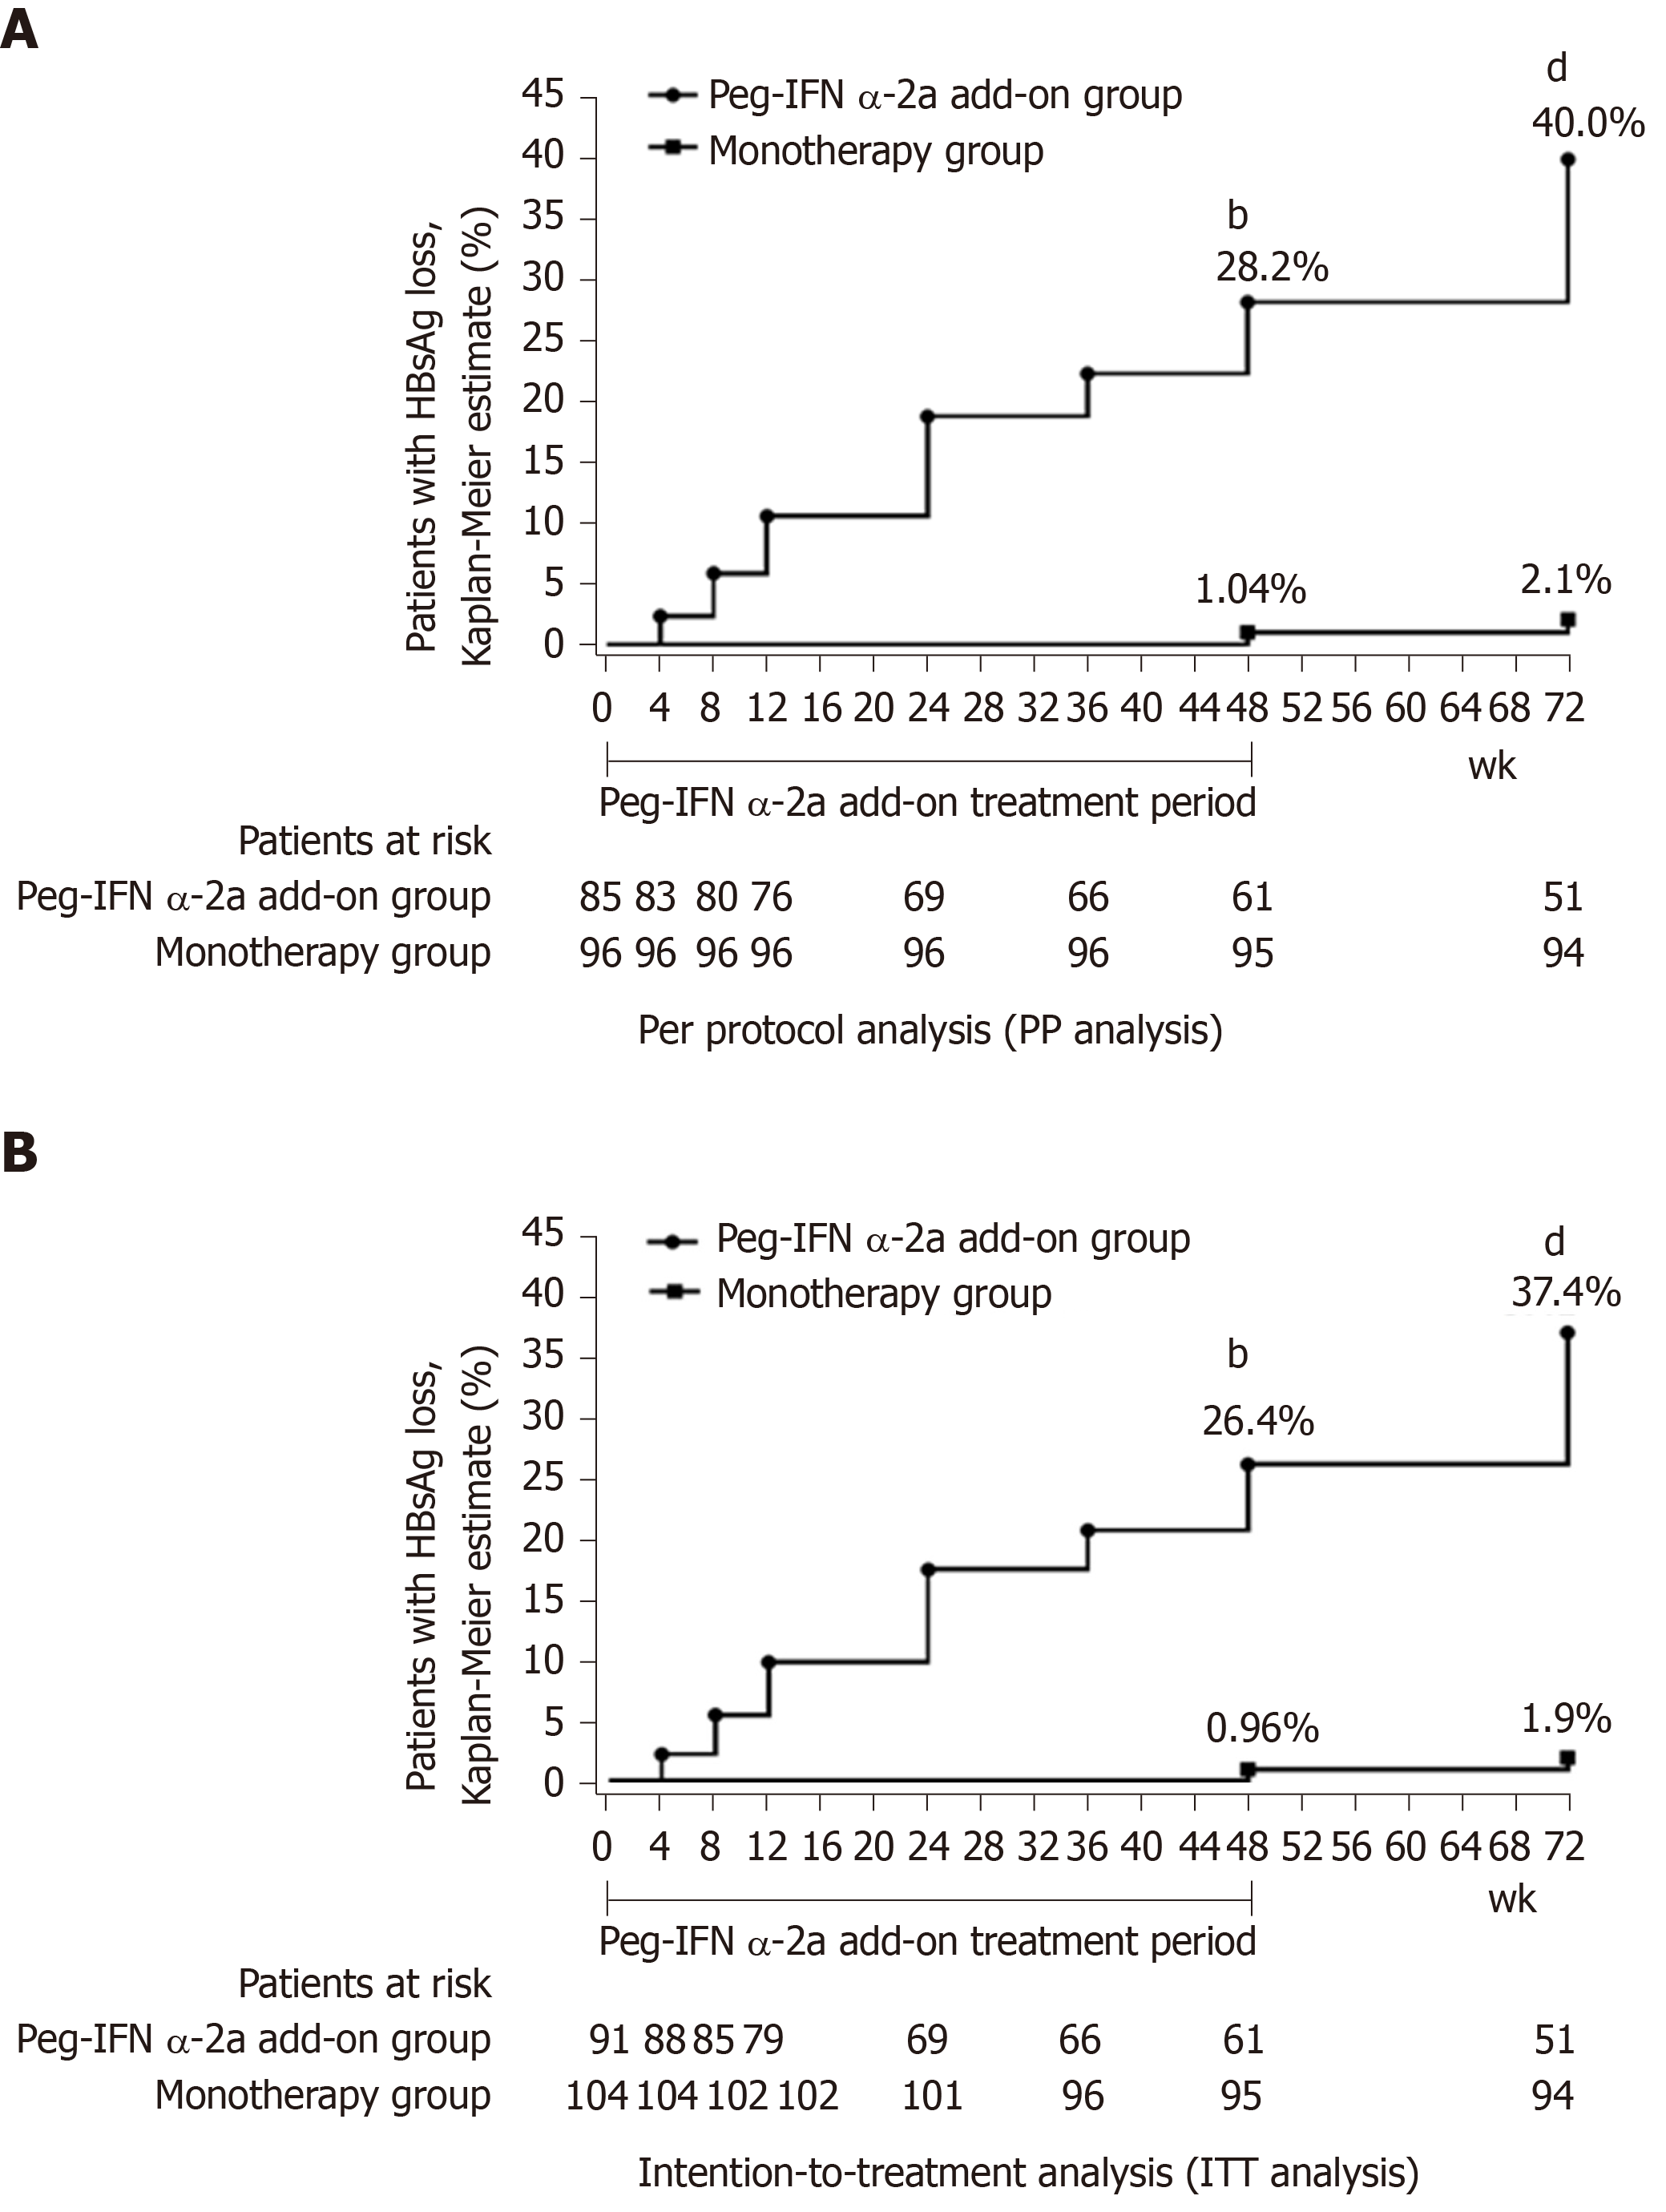
Figure 2 Hepatitis B surface antigen clearance rate.
A: Per protocol analysis showed that the rate of hepatitis B surface antigen clearance in 48-wk peg-IFN add-on group was significantly higher than monotherapy group at weeks 48 and 72 (bP < 0.001 vs monotherapy group at week 48; dP < 0.001 vs monotherapy group at week 72). Week 0 was defined as the time when the patients were enrolled in this study for patients in the monotherapy group; B: Intention-to-treatment analysis showed that the rate of hepatitis B surface antigen clearance in 48-wk peg-IFN add-on group was significantly higher than the rate in the monotherapy group at weeks 48 and 72 (bP < 0.001 vs monotherapy group at week 48; dP < 0.001 vs monotherapy group at week 72). Week 0 was defined as the time when the patients were enrolled in this study for patients in the monotherapy group. HBsAg: Hepatitis B surface antigen.
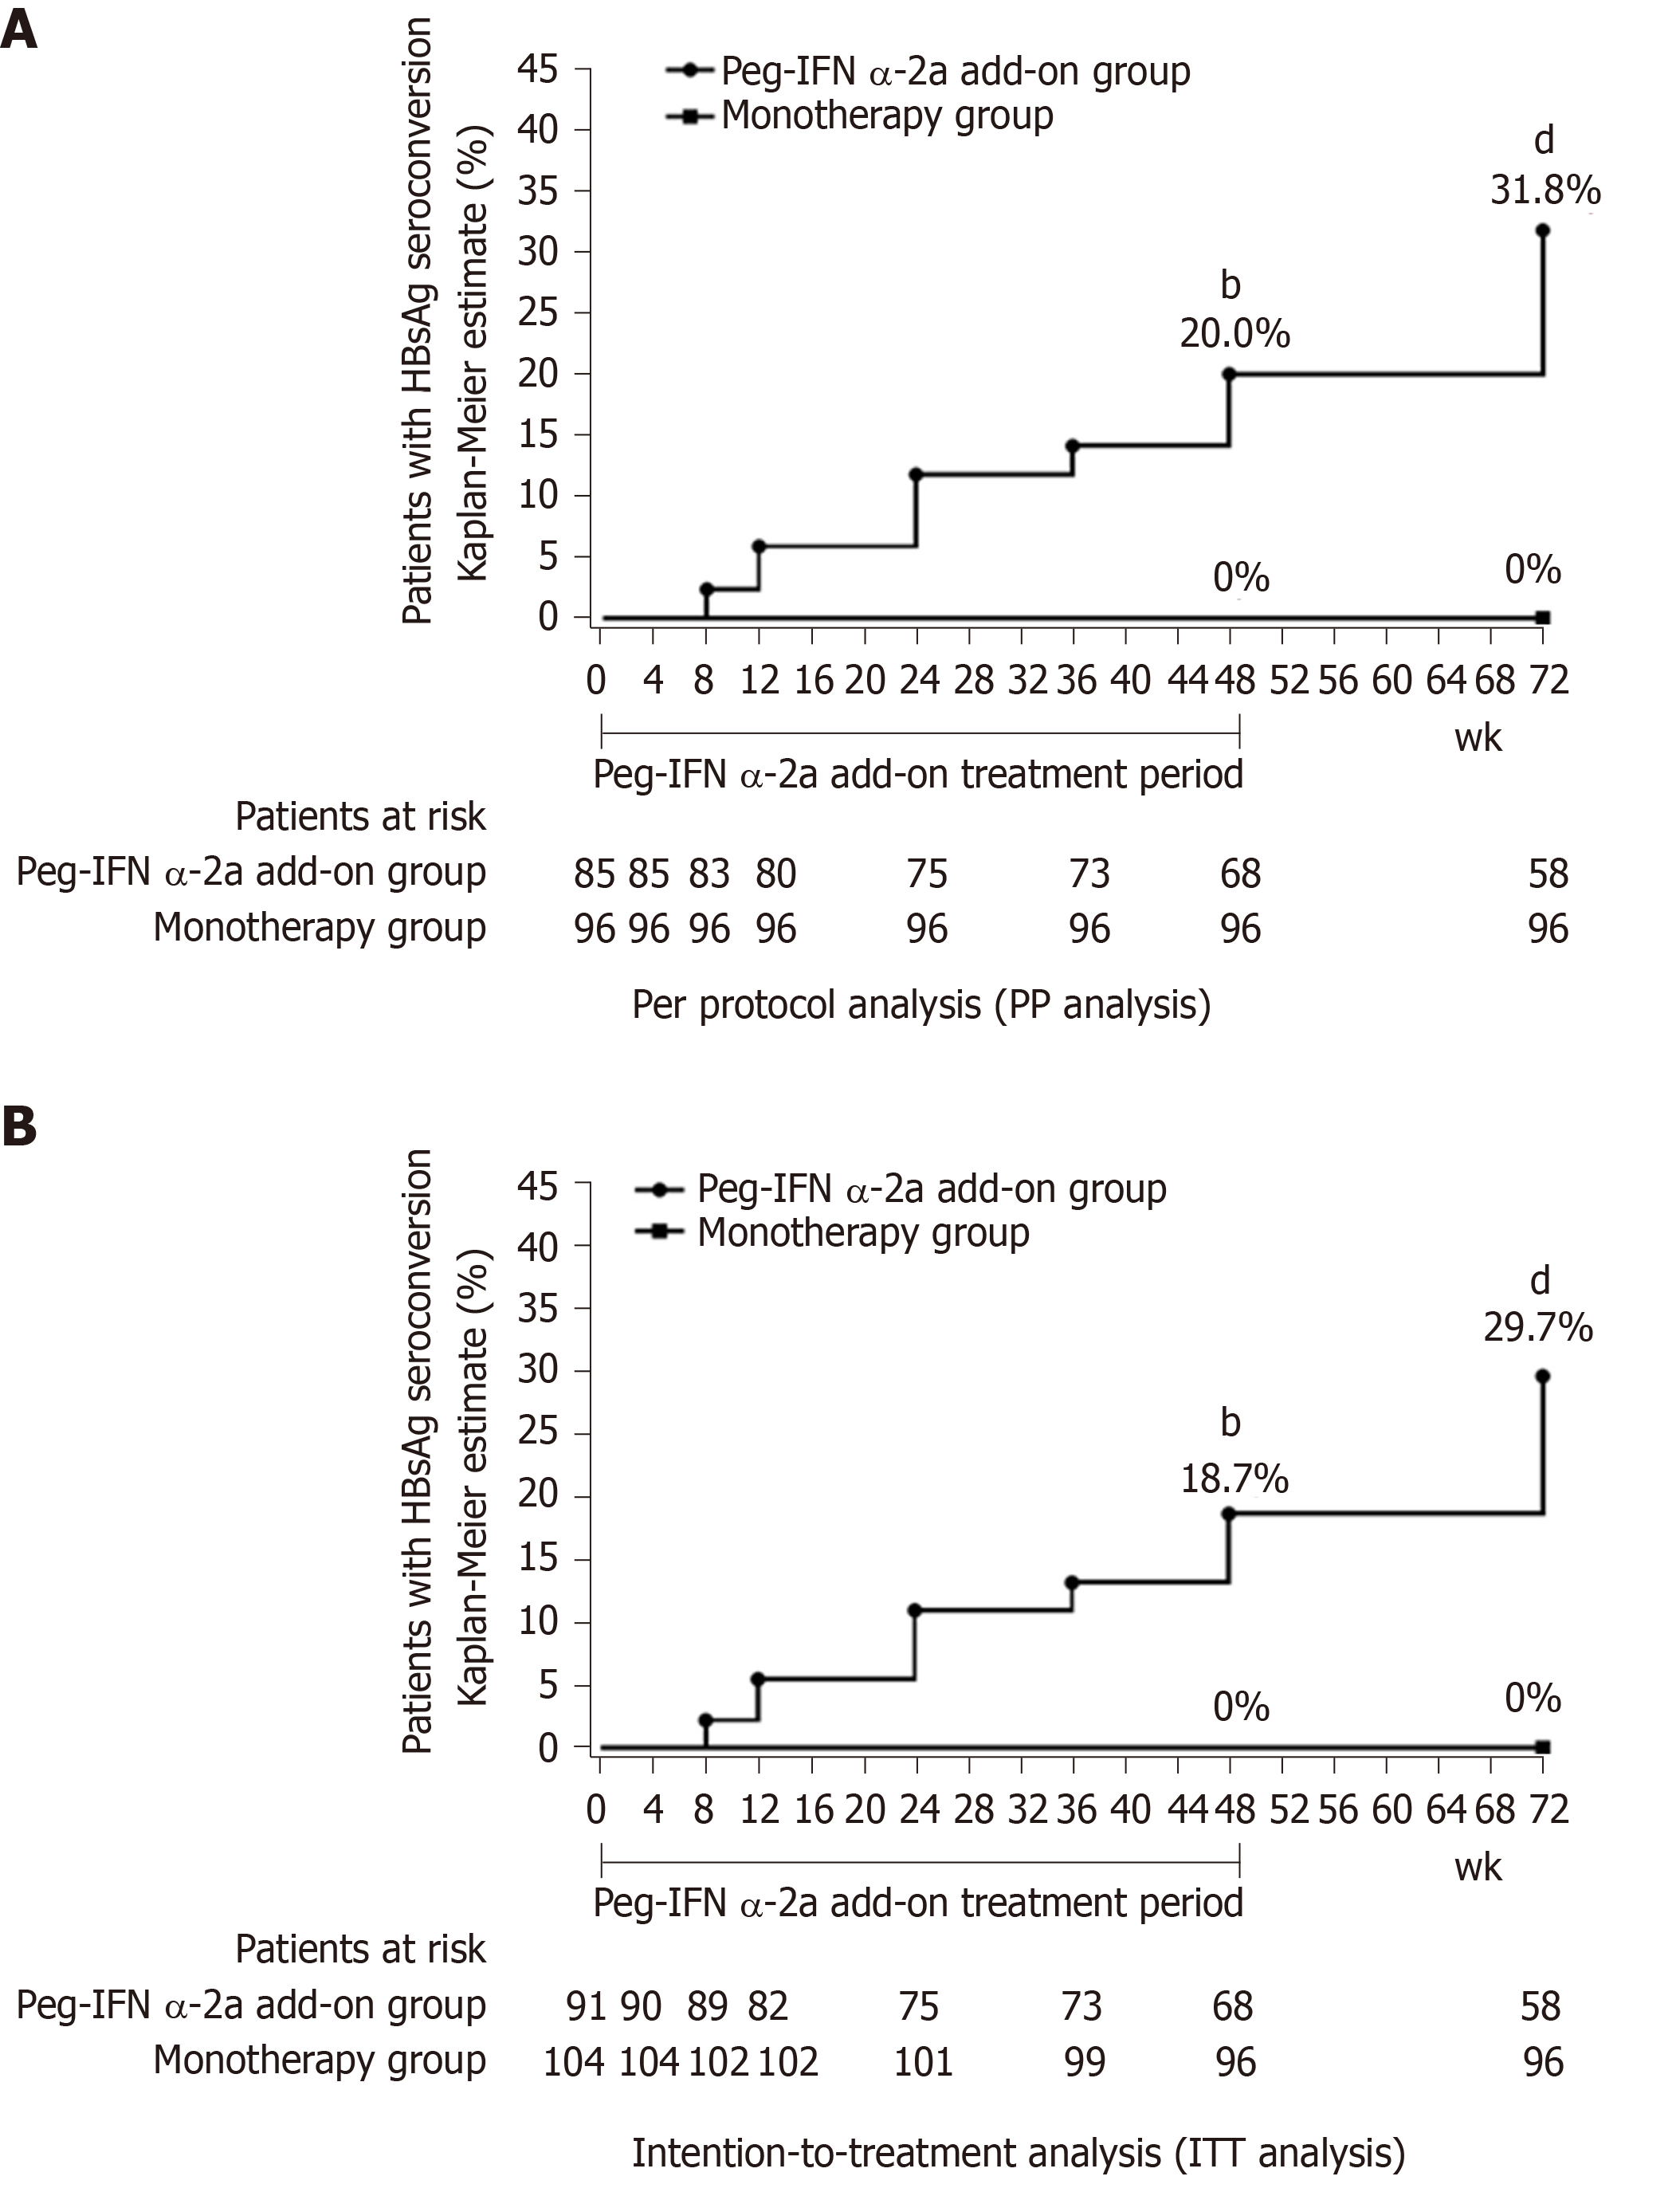
Figure 3 Hepatitis B surface antigen seroconversion rate.
A: Per protocol analysis showed that the rate of hepatitis B surface antigen seroconversion in 48-wk peg-IFN add-on group was significantly higher than monotherapy group at weeks 48 and 72 (bP < 0.001 vs monotherapy group at week 48; dP < 0.001 vs monotherapy group at week 72). Week 0 was defined as the time when the patients were enrolled in this study for patients in the monotherapy group; B: Intention-to-treatment analysis showed that the rate of hepatitis B surface antigen seroconversion in 48-wk peg-IFN add-on group was significantly higher than rate in monotherapy group at weeks 48 and 72 (bP < 0.001 vs monotherapy group at week 48; dP < 0.001 vs monotherapy group at week 72). Week 0 was defined as the time when the patients were enrolled in this study for patients in the monotherapy group. HBsAg: Hepatitis B surface antigen.
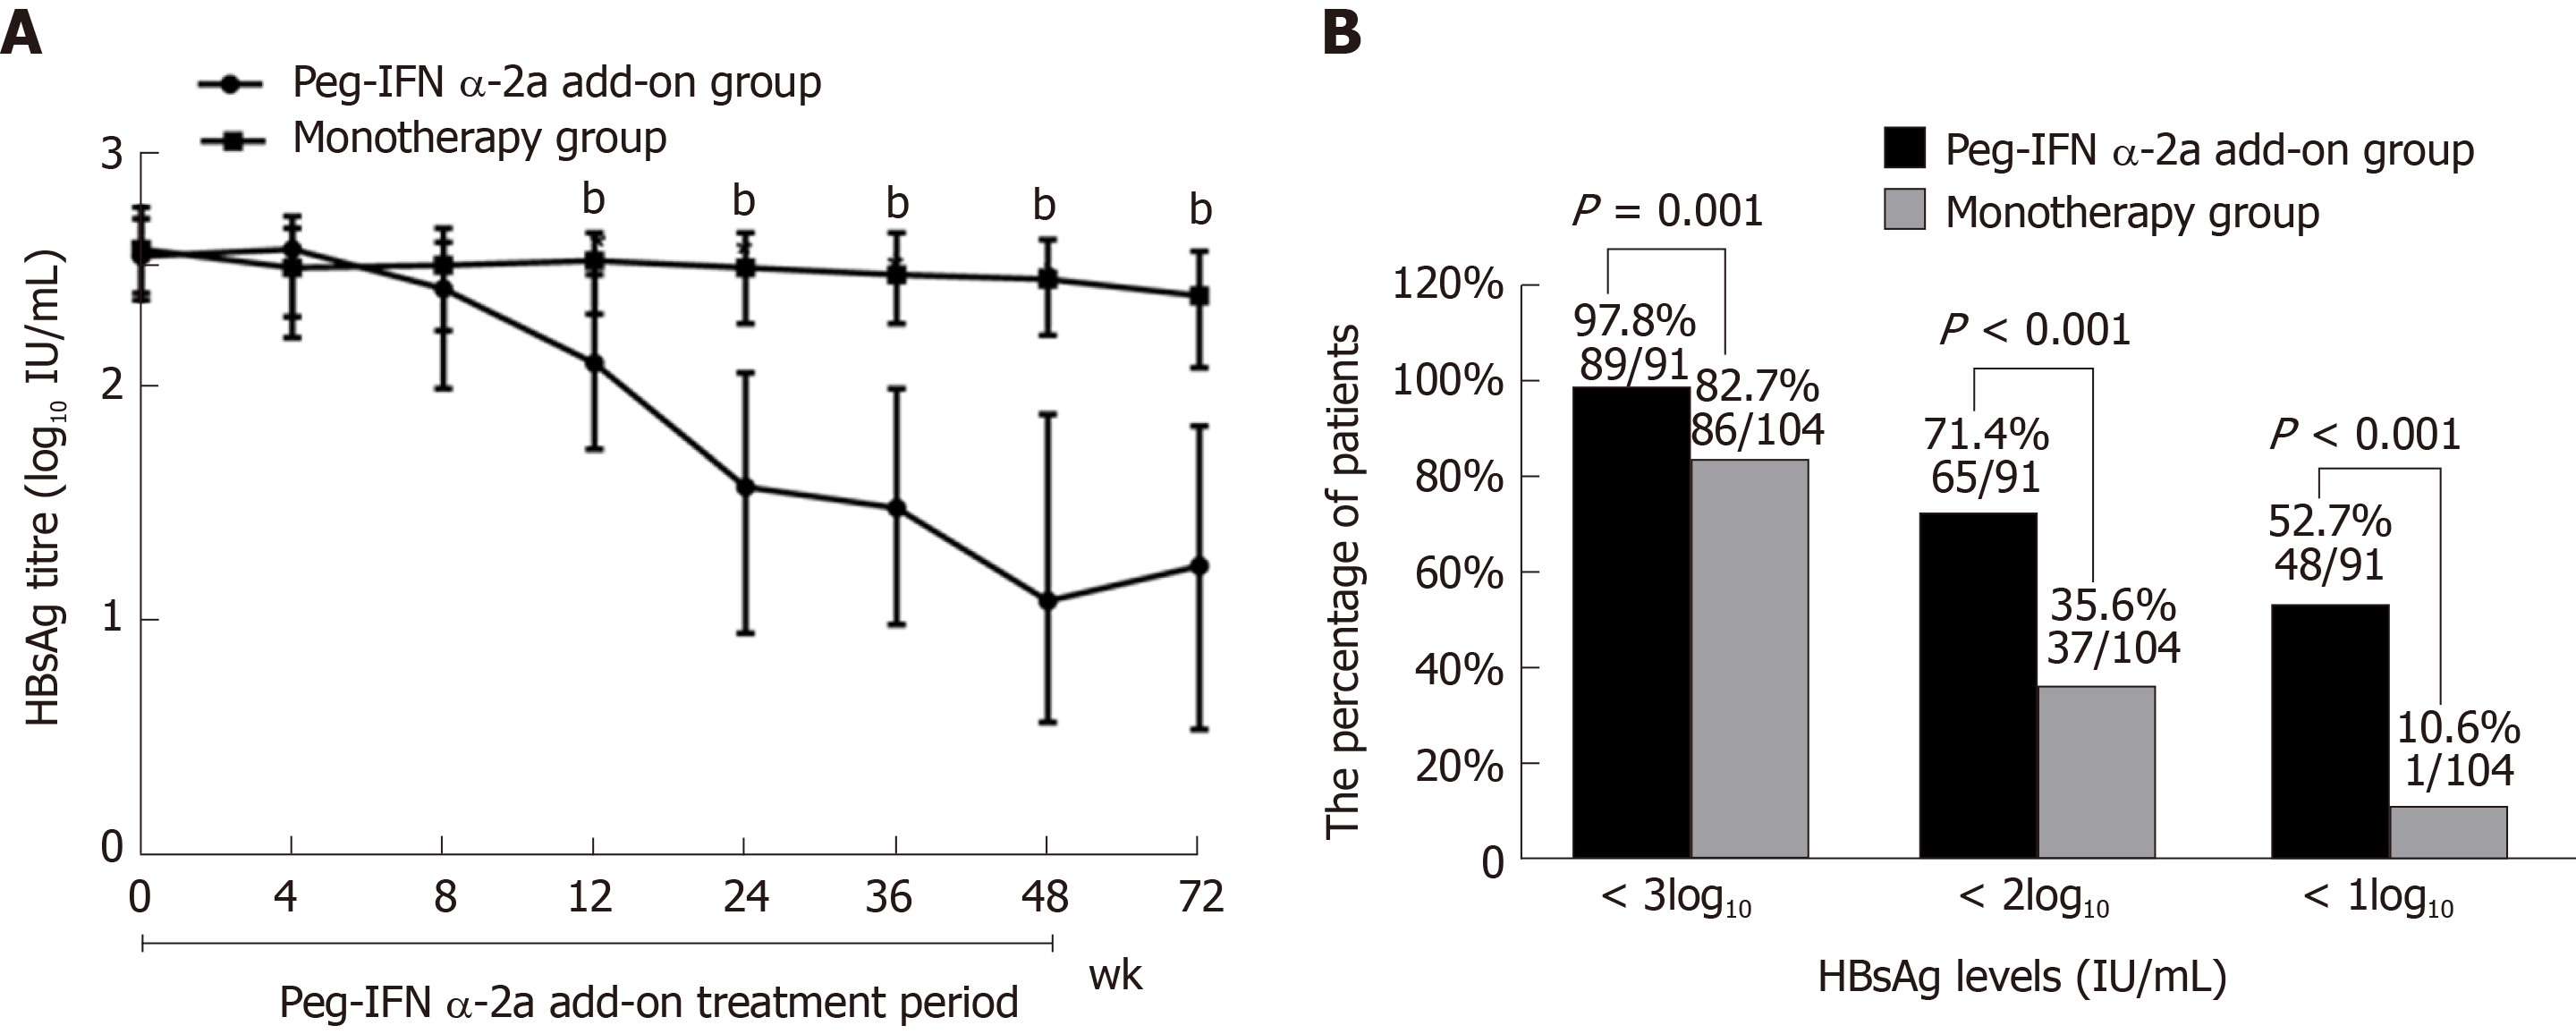
Figure 4 Virological change.
A: Dynamics of hepatitis B surface antigen titers (bP < 0.001 vs monotherapy group for weeks 12, 24, 36, 48 and 72). Data shown are median values of log10 hepatitis B surface antigen and error bars represent 95% confidence interval. B: HBsAg response at week 72.
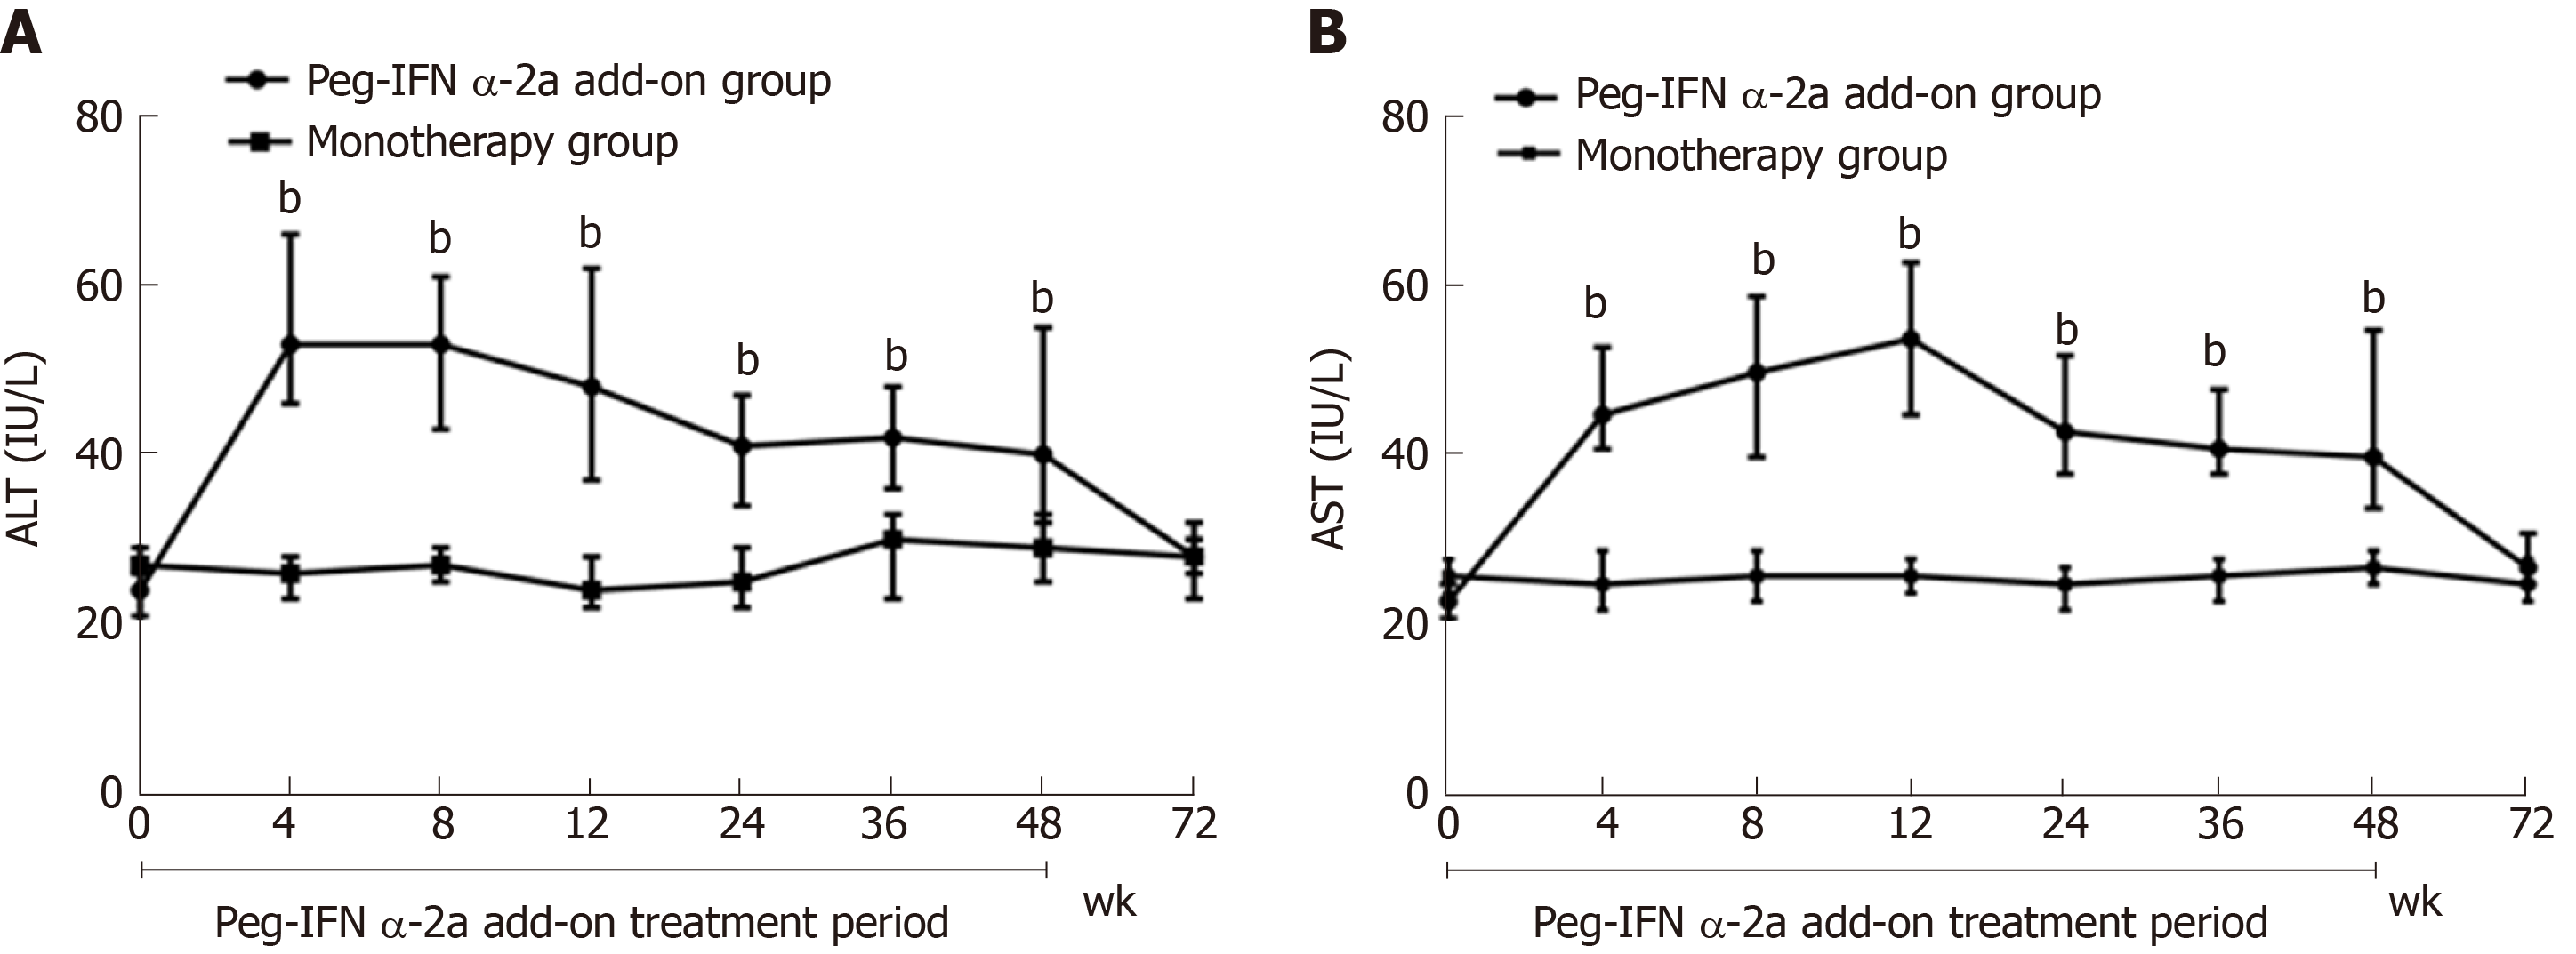
Figure 5 Change in serum alanine aminotransferase and median serum aspartate transaminase.
A: Change in serum alanine aminotransferase (bP < 0.001 vs monotherapy group for weeks 4, 8, 12, 24, 36 and 48). Data shown are median values of serum alanine aminotransferase and error bars represent 95% confidence interval; B: Change in median serum aspartate transaminase (bP < 0.001 vs monotherapy group for weeks 4, 8, 12, 24, 36 and 48). Data shown are median values of serum aspartate transaminase and error bars represent 95% confidence interval. HBsAg: Hepatitis B surface antigen; ALT: Alanine aminotransferase; AST: Aspartate transaminase.
- Citation: Wu FP, Yang Y, Li M, Liu YX, Li YP, Wang WJ, Shi JJ, Zhang X, Jia XL, Dang SS. Add-on pegylated interferon augments hepatitis B surface antigen clearance vs continuous nucleos(t)ide analog monotherapy in Chinese patients with chronic hepatitis B and hepatitis B surface antigen ≤ 1500 IU/mL: An observational study. World J Gastroenterol 2020; 26(13): 1525-1539
- URL: https://www.wjgnet.com/1007-9327/full/v26/i13/1525.htm
- DOI: https://dx.doi.org/10.3748/wjg.v26.i13.1525


