Copyright
©The Author(s) 2020.
World J Gastroenterol. Apr 7, 2020; 26(13): 1463-1473
Published online Apr 7, 2020. doi: 10.3748/wjg.v26.i13.1463
Published online Apr 7, 2020. doi: 10.3748/wjg.v26.i13.1463
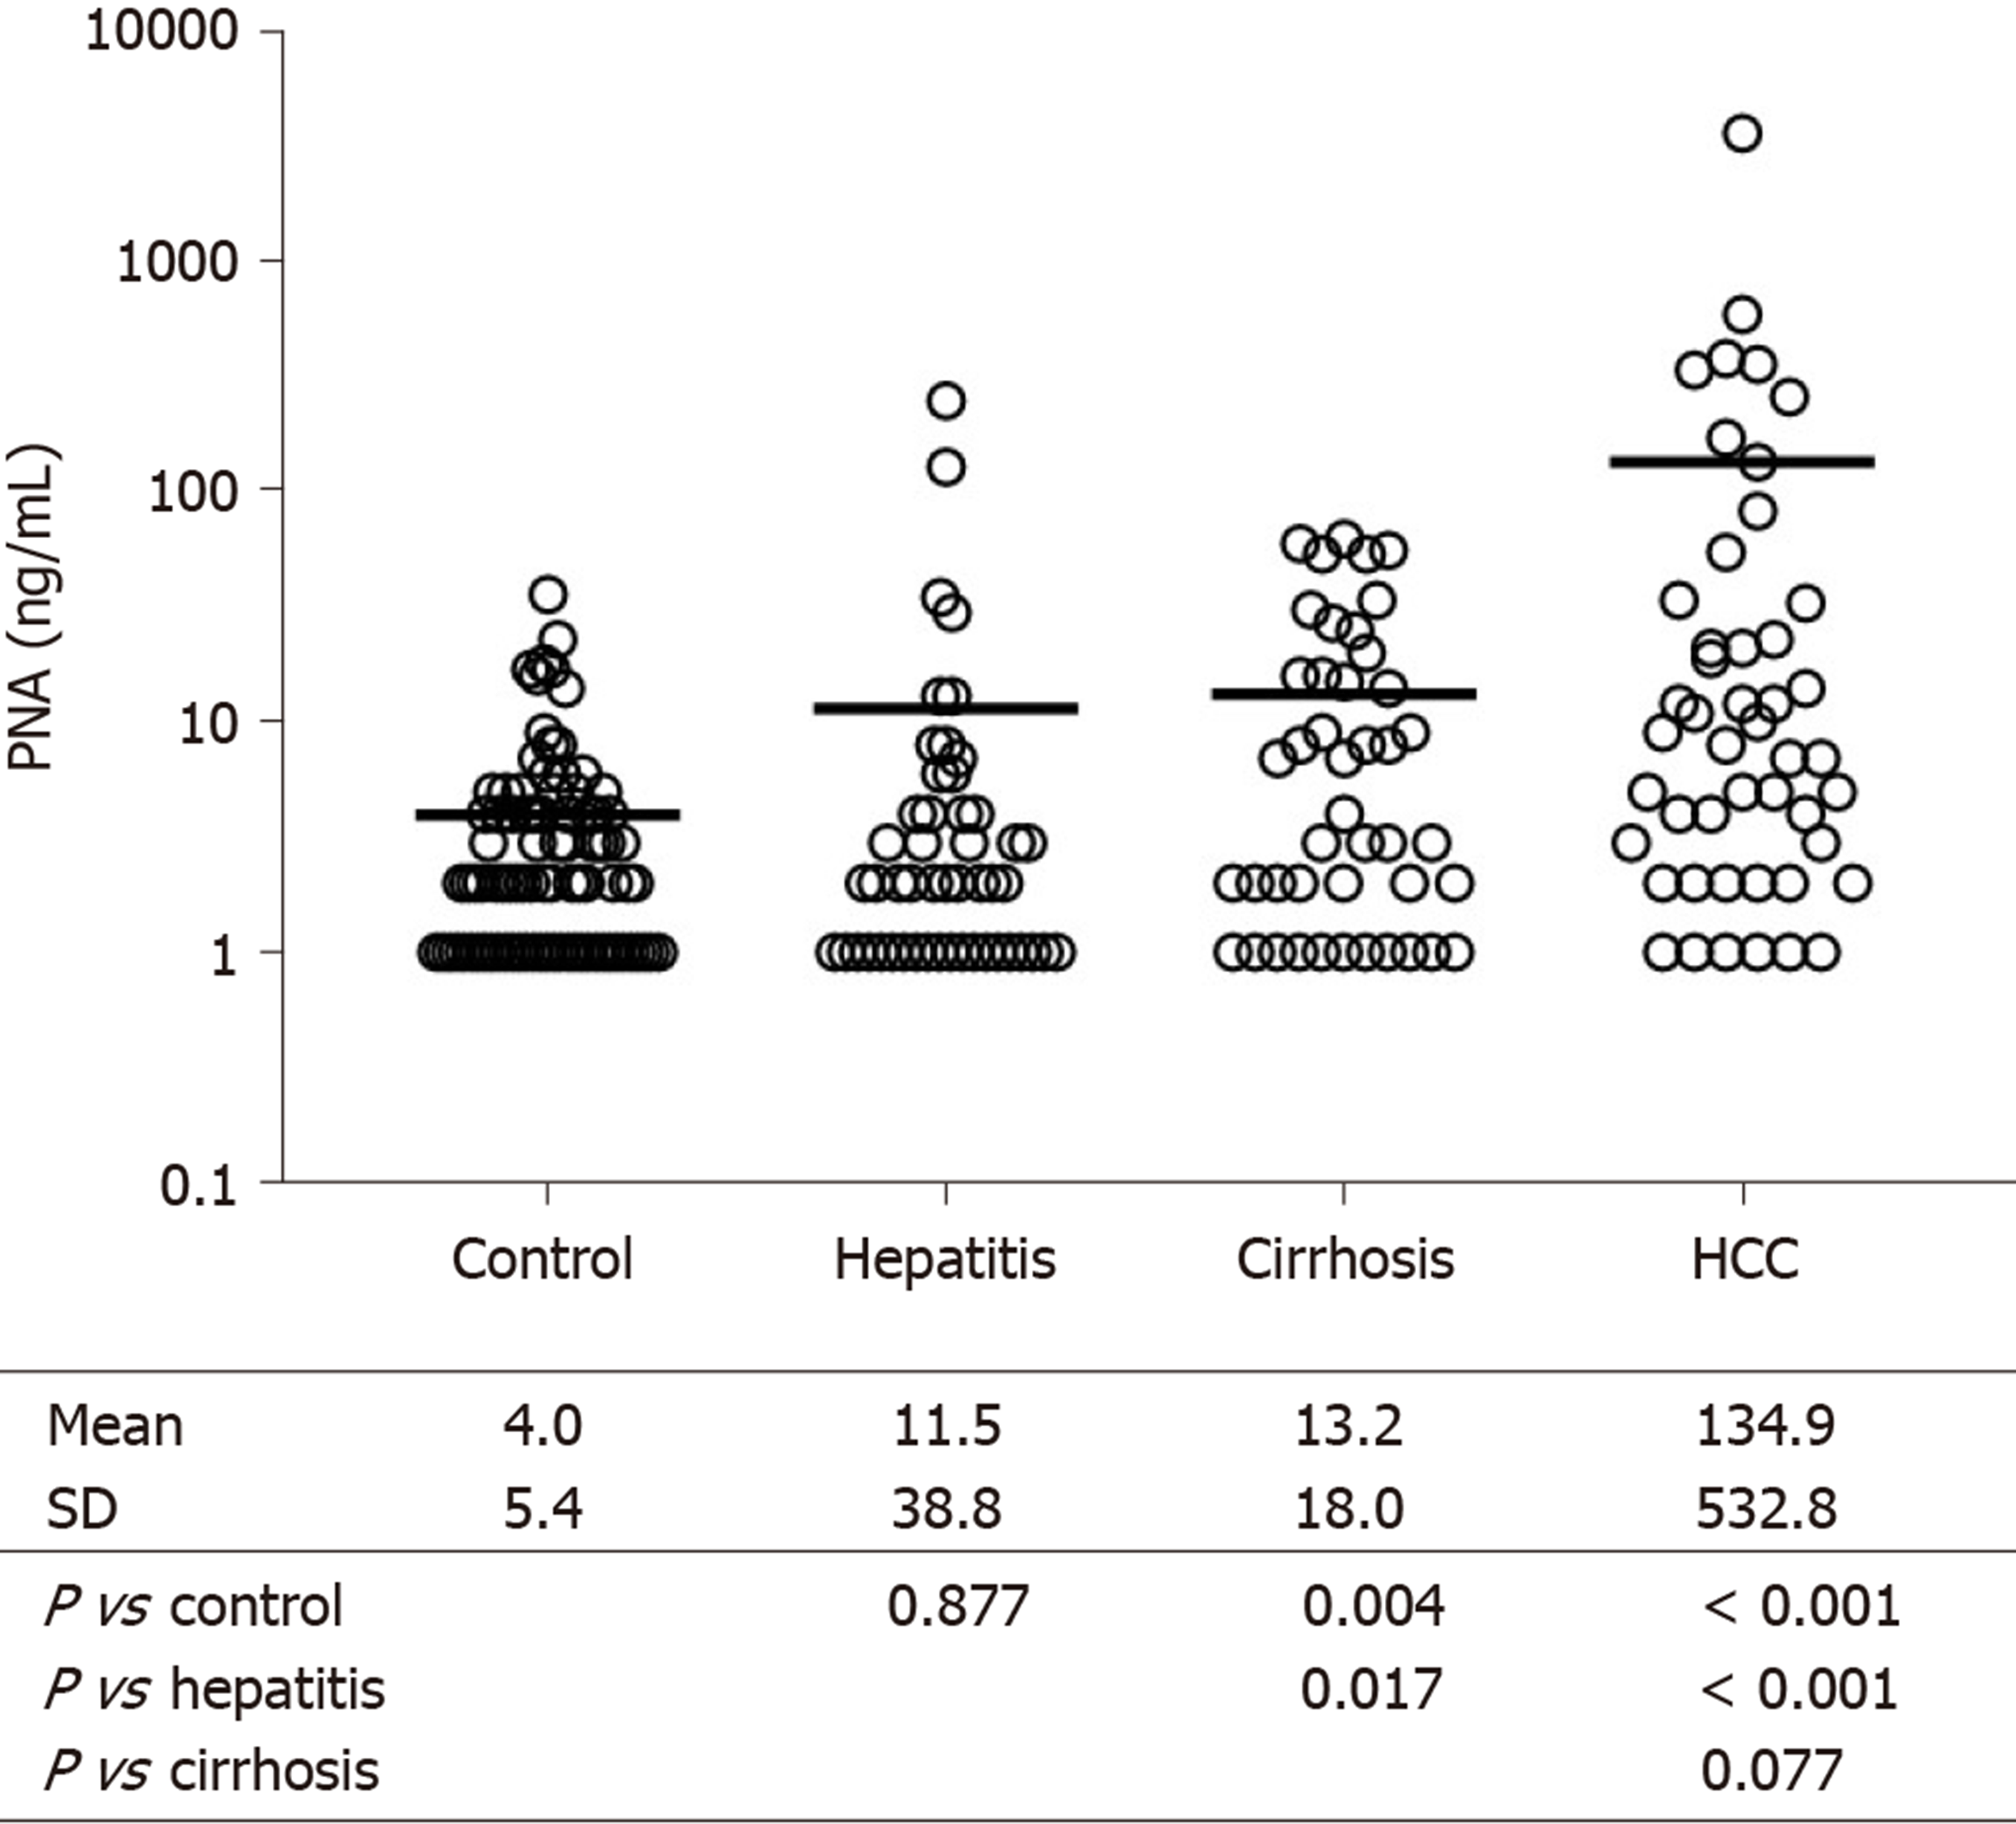
Figure 1 Serum preneoplastic antigen concentrations in controls and in patients with hepatitis C virus-related hepatitis, cirrhosis, or hepatocellular carcinoma.
Serum preneoplastic antigen concentrations were measured by ELISA. The results from each patient are plotted, and the means are shown by horizontal bars. The differences between groups were evaluated by Mann-Whitney U tests. The mean with SD and P value for comparison are summarized in the table. n = 89 in control, 50 in hepatitis, 44 in cirrhosis, and 47 in hepatocellular carcinoma.
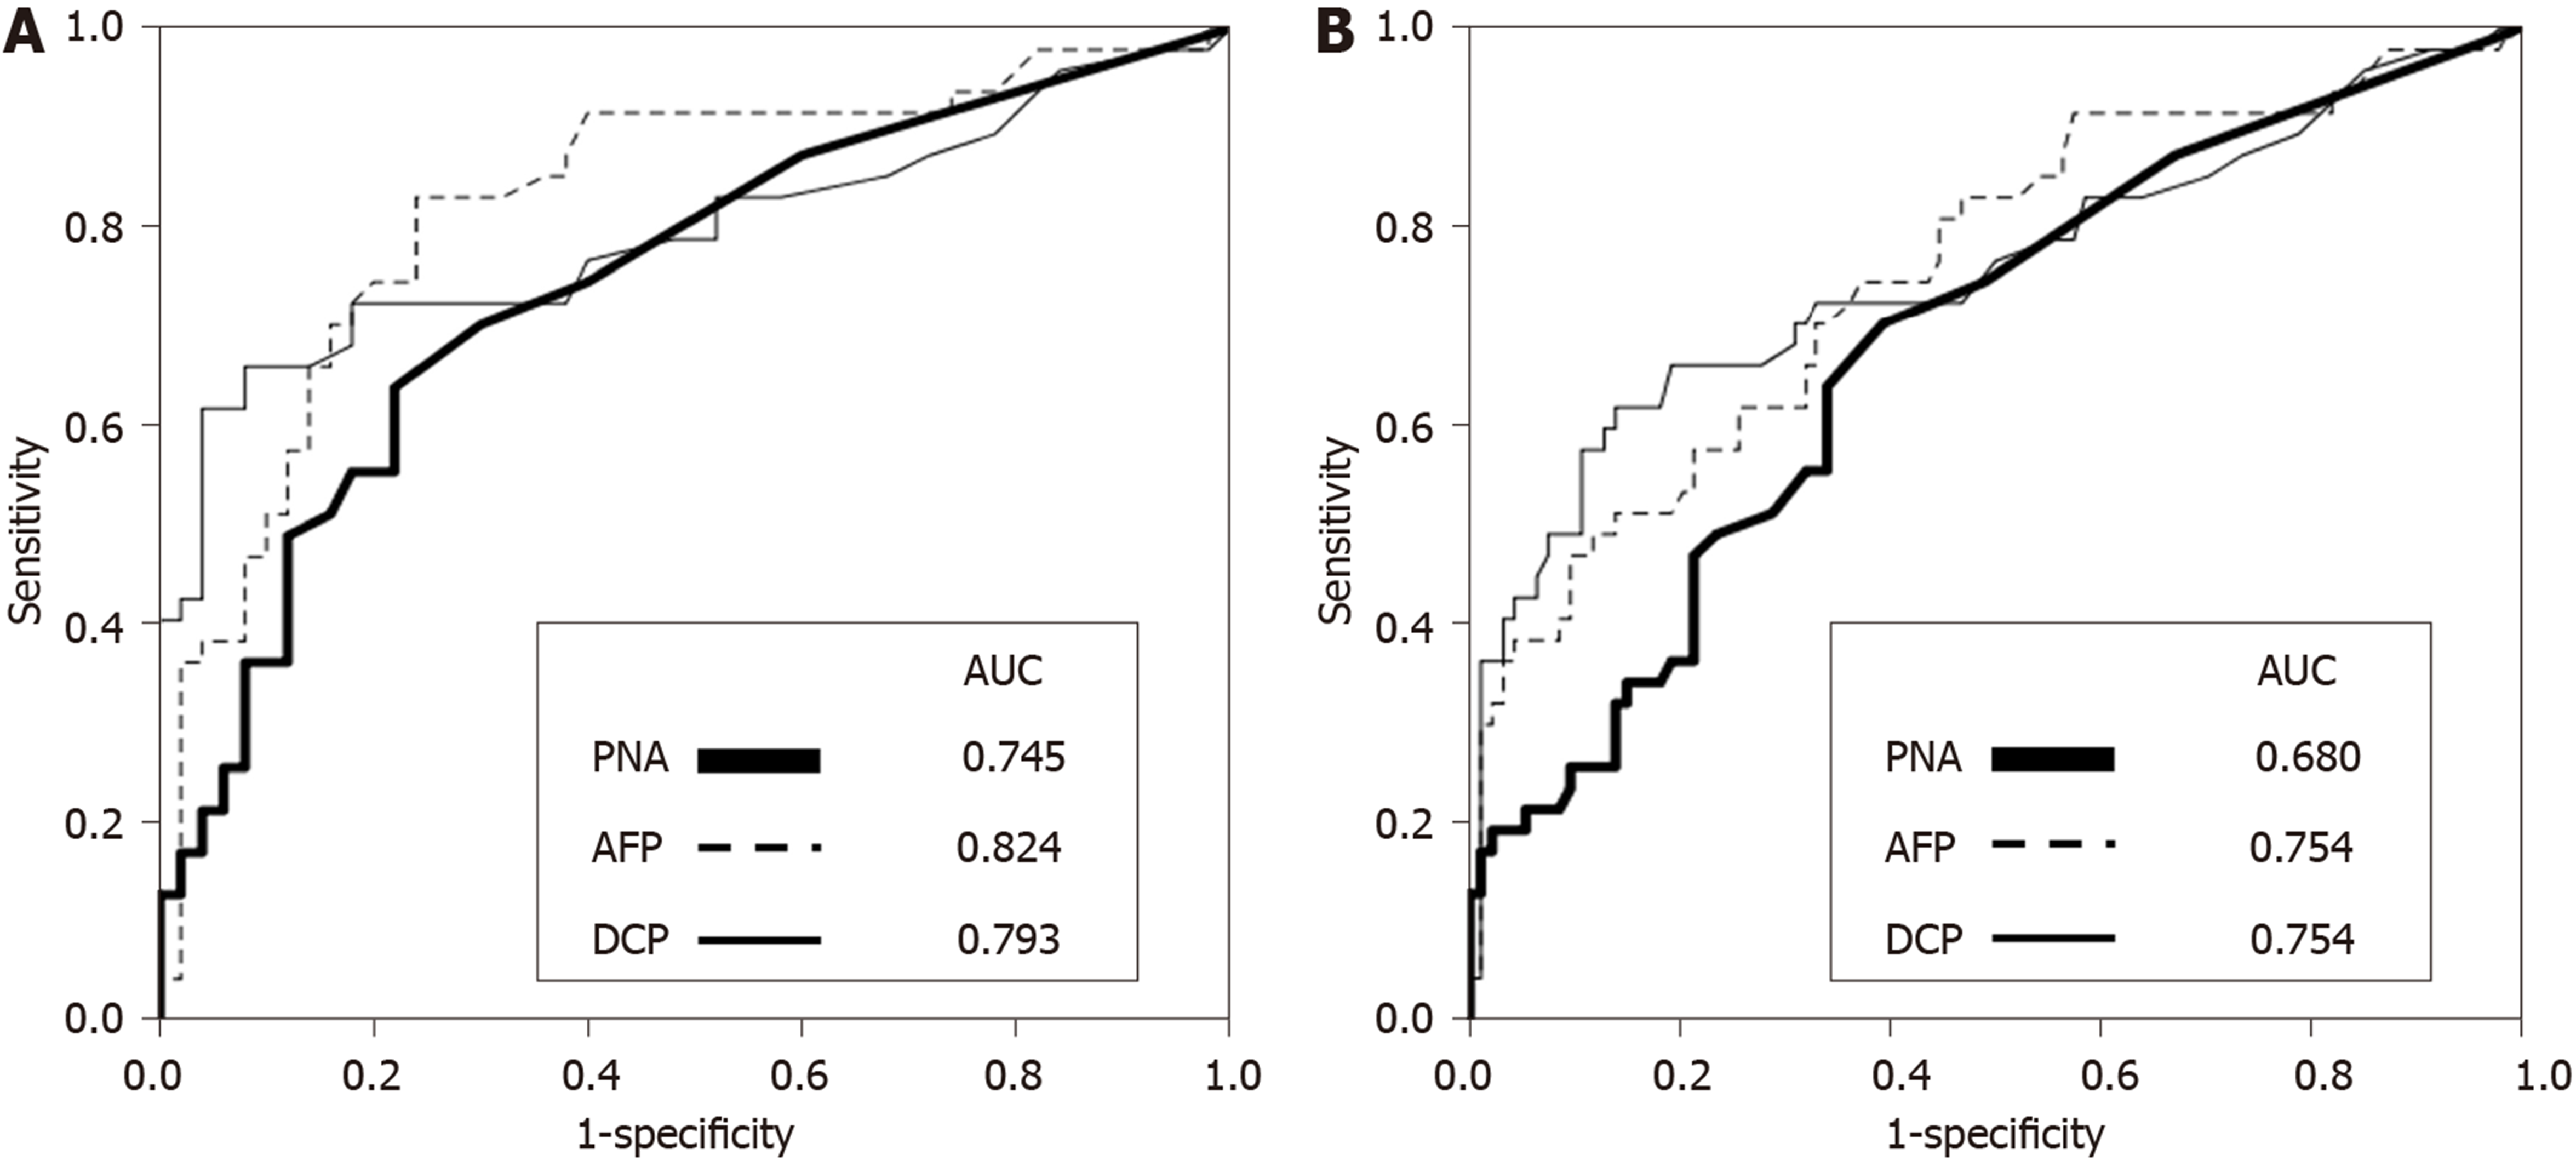
Figure 2 Receiver-operating characteristic analyses of preneoplastic antigen, α-fetoprotein and des-γ-carboxy-prothrombin in hepatitis C virus-related hepatocellular carcinoma.
The sensitivity and specificity of markers were determined to discriminate hepatocellular carcinoma patients from hepatitis patients and cirrhosis patients. A: Hepatitis patients; B: Hepatitis and cirrhosis patients. The receiver–operating characteristic curve was obtained by plotting the sensitivity on the Y-axis against 1-specificity on the X-axis, and the area under the receiver–operating characteristic curve was calculated. PNA: Preneoplastic antigen; AFP: α-Fetoprotein; DCP: Des-γ-carboxy-prothrombin.
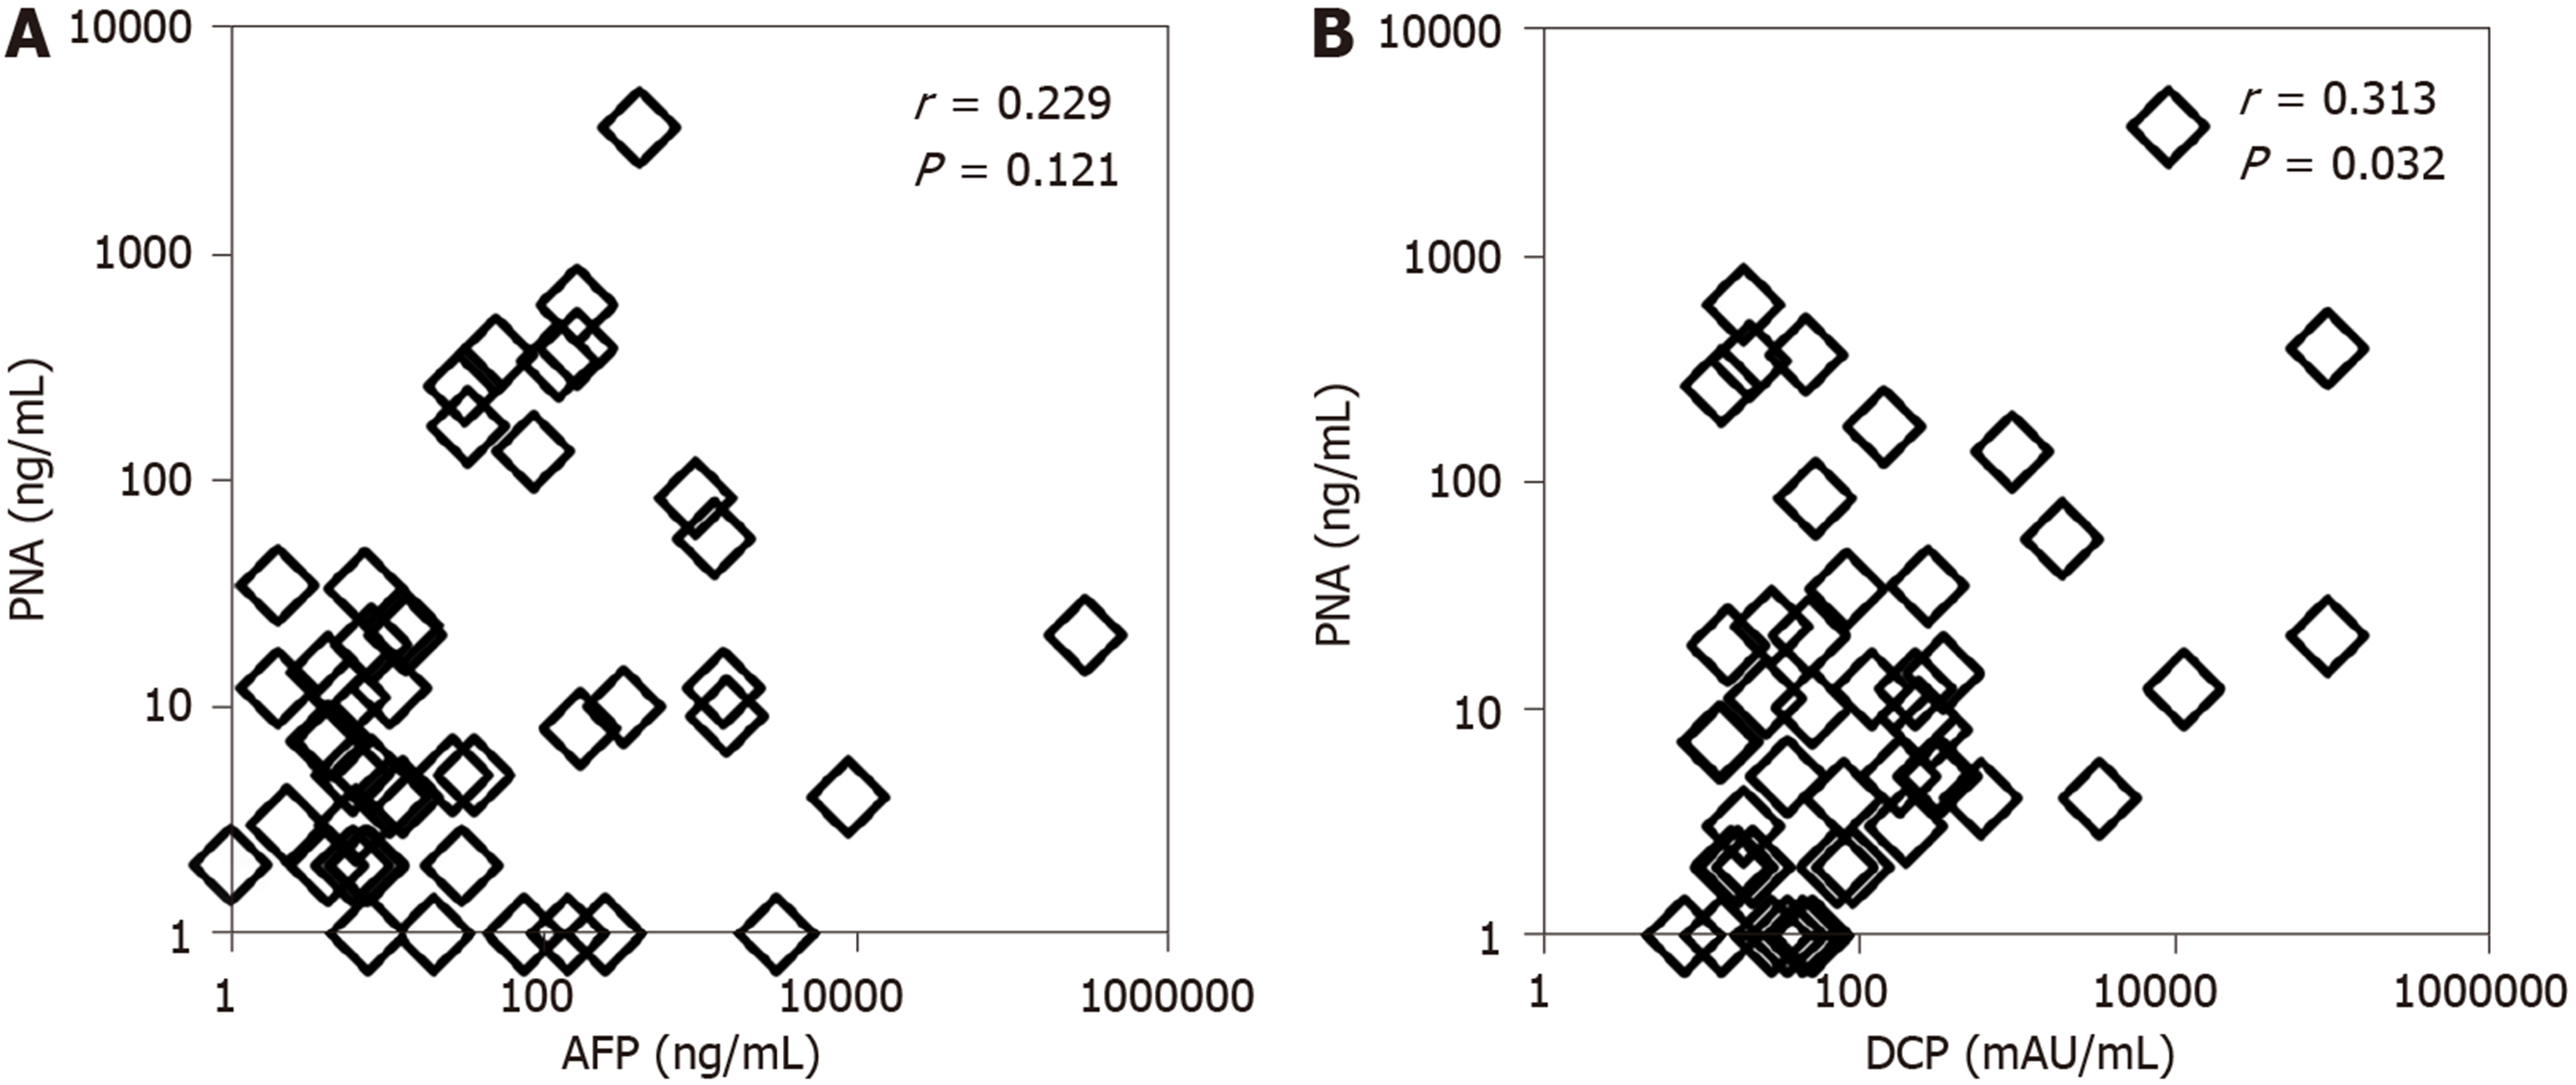
Figure 3 Correlation analysis of preneoplastic antigen with α-fetoprotein and des-γ-carboxy-prothrombin in sera of patients with hepatitis C virus-related hepatocellular carcinoma.
The correlation index (r) and 2-sided P value were calculated by Spearman correlation analysis. AFP: α-Fetoprotein; DCP: Des-γ-carboxy-prothrombin; PNA: Preneoplastic antigen.
- Citation: Yamashita S, Kato A, Akatsuka T, Sawada T, Asai T, Koyama N, Okita K. Clinical relevance of increased serum preneoplastic antigen in hepatitis C-related hepatocellular carcinoma. World J Gastroenterol 2020; 26(13): 1463-1473
- URL: https://www.wjgnet.com/1007-9327/full/v26/i13/1463.htm
- DOI: https://dx.doi.org/10.3748/wjg.v26.i13.1463


