Copyright
©The Author(s) 2020.
World J Gastroenterol. Apr 7, 2020; 26(13): 1450-1462
Published online Apr 7, 2020. doi: 10.3748/wjg.v26.i13.1450
Published online Apr 7, 2020. doi: 10.3748/wjg.v26.i13.1450
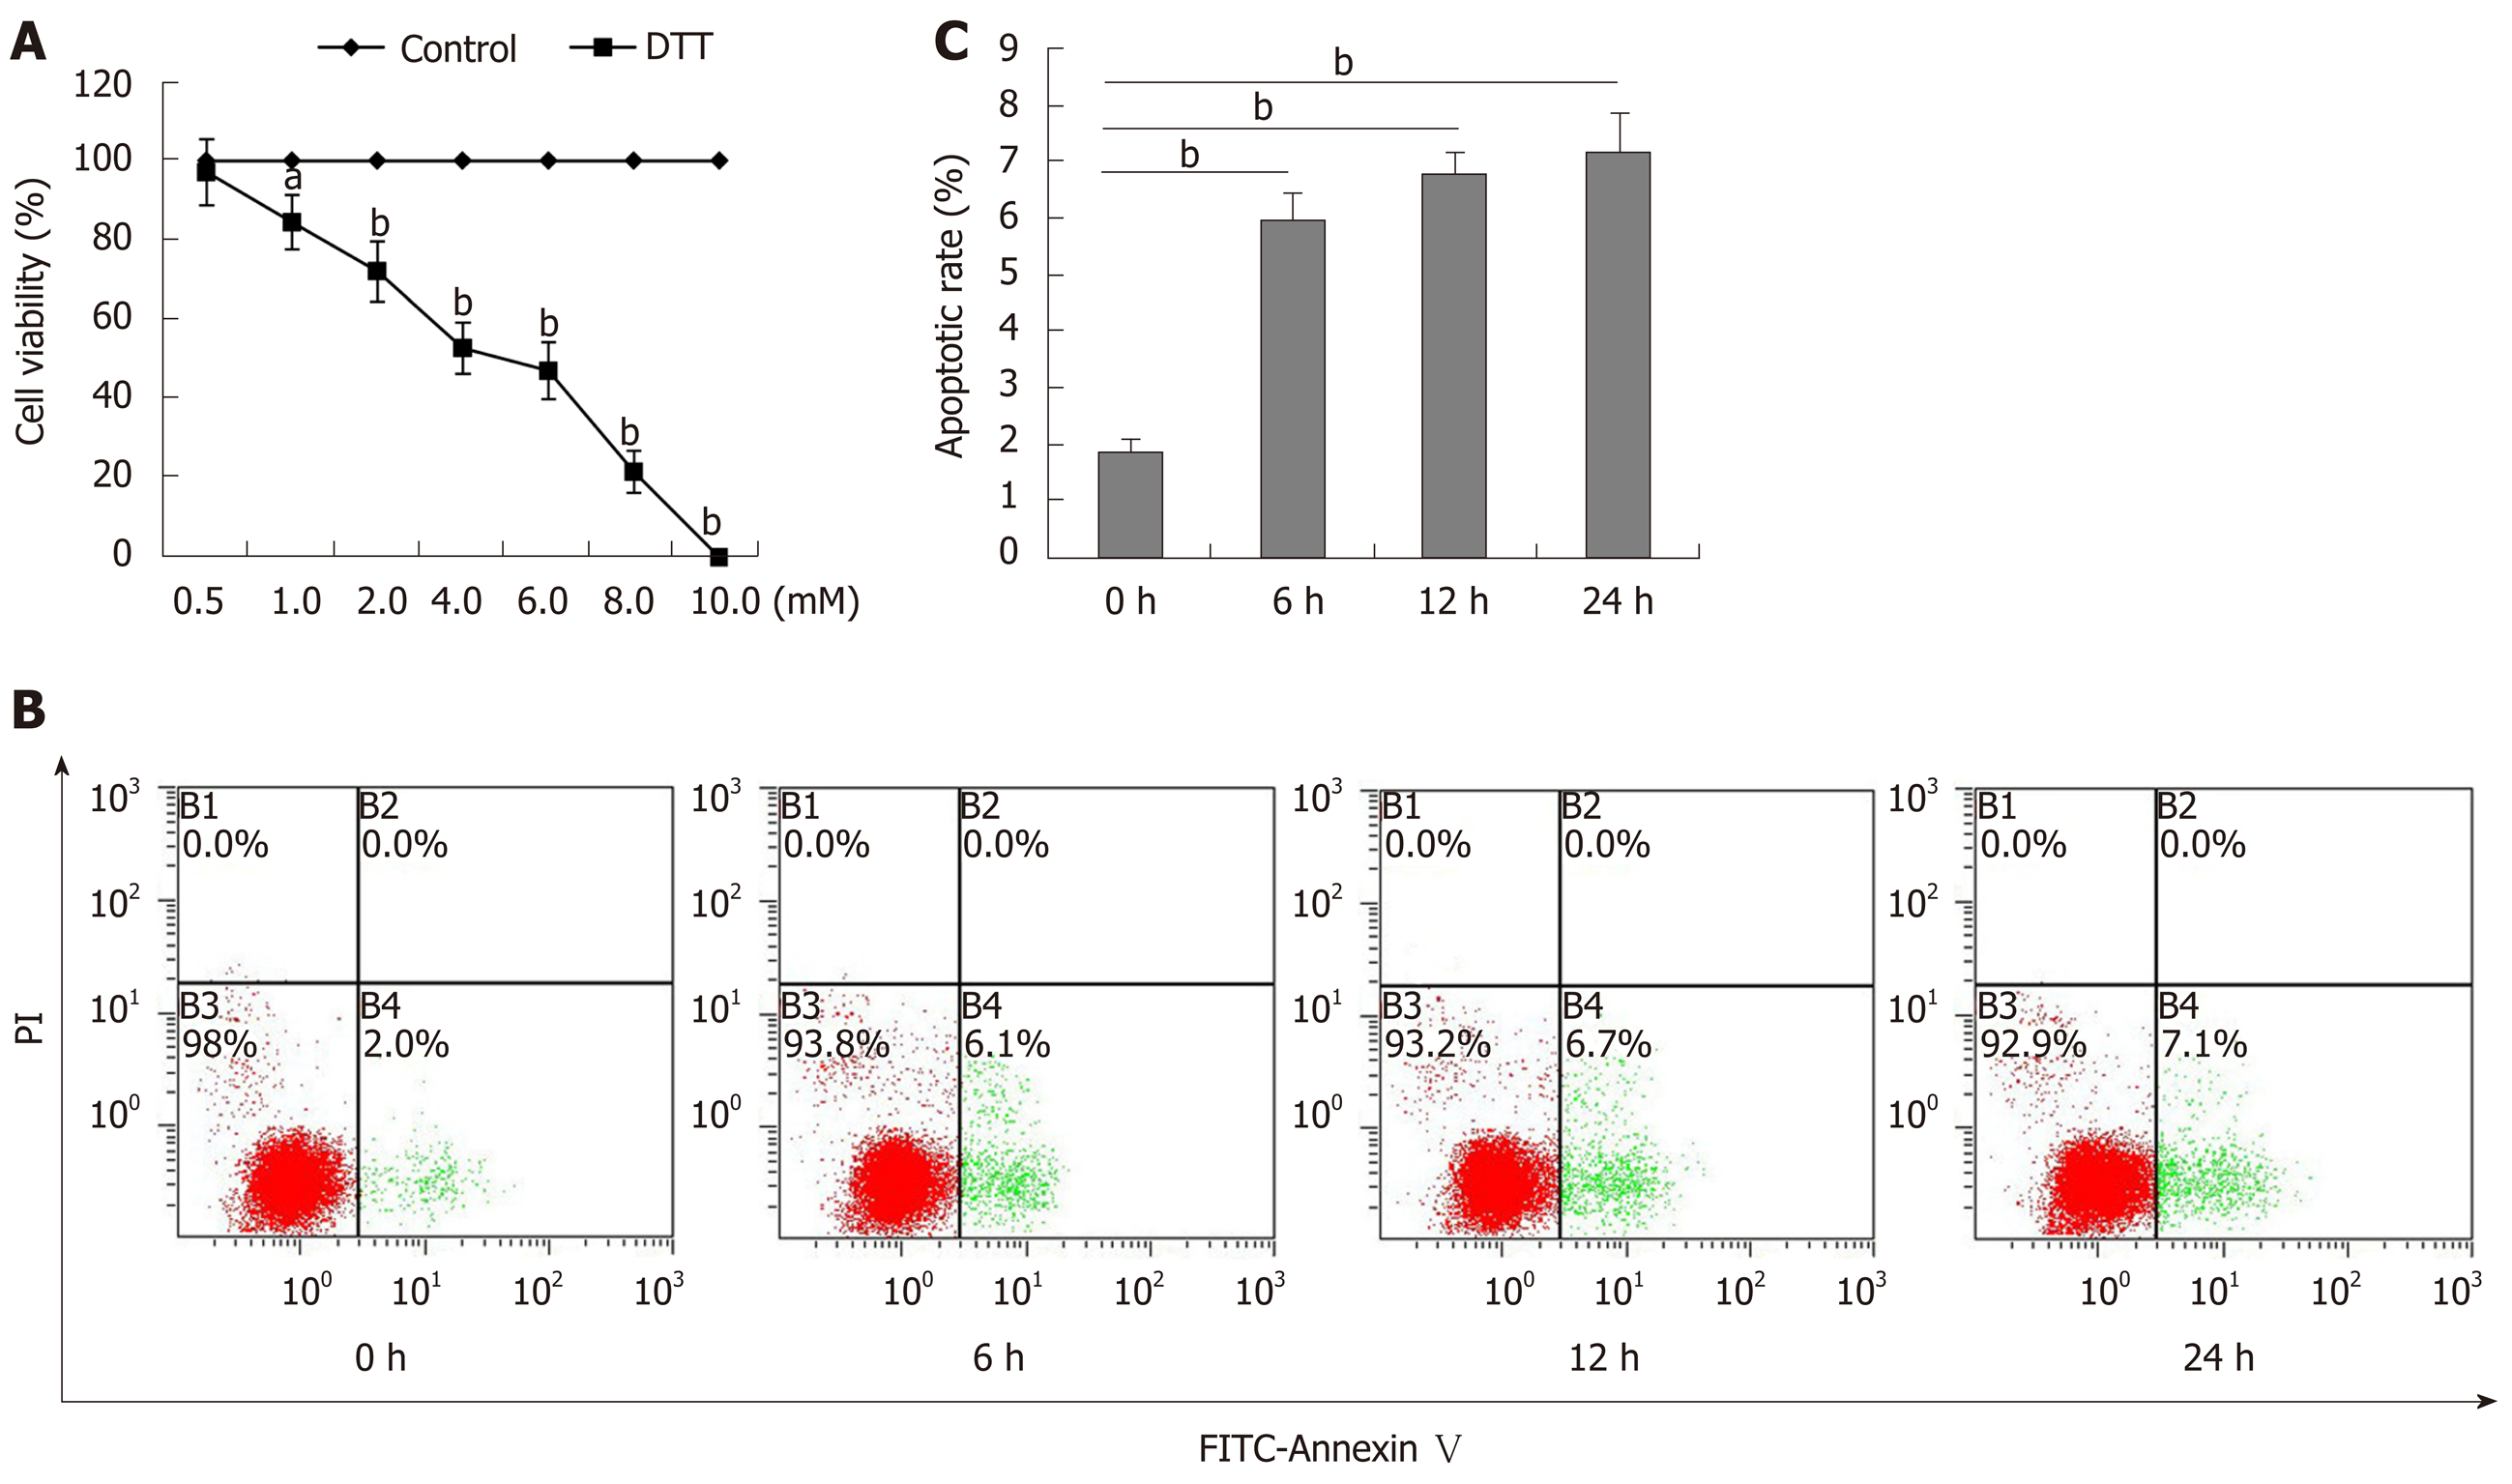
Figure 1 Dithiothreitol exhibits dose-dependent cytotoxicity against BRL-3A cells.
A: BRL-3A cells were treated in triplicate with, or without, the indicated doses of dithiothreitol (DTT) for 24 h and their viability was examined by MTT. The percentages (y) of cell viability were calculated by the equation, y = -9.3654x + 95.744 with a correlation (R2 = 0.9781), here x represents DTT concentration. Accordingly, the DTT LD50 = 4.88 mM; B, C: Subsequently, BRL-3A cells were treated with 2.0 mmol/L DTT for varying periods and stained with FITC-Annexin-V and PI. The percentages of mechanically damaged (B1 quadrant), healthy (B3), early (B4) and late apoptotic and necrotic (B2) cells were analyzed by flow cytometry. Data are representative flow cytometry charts or expressed as the mean ± SD of each group from three separate experiments. aP < 0.05, bP < 0.01.
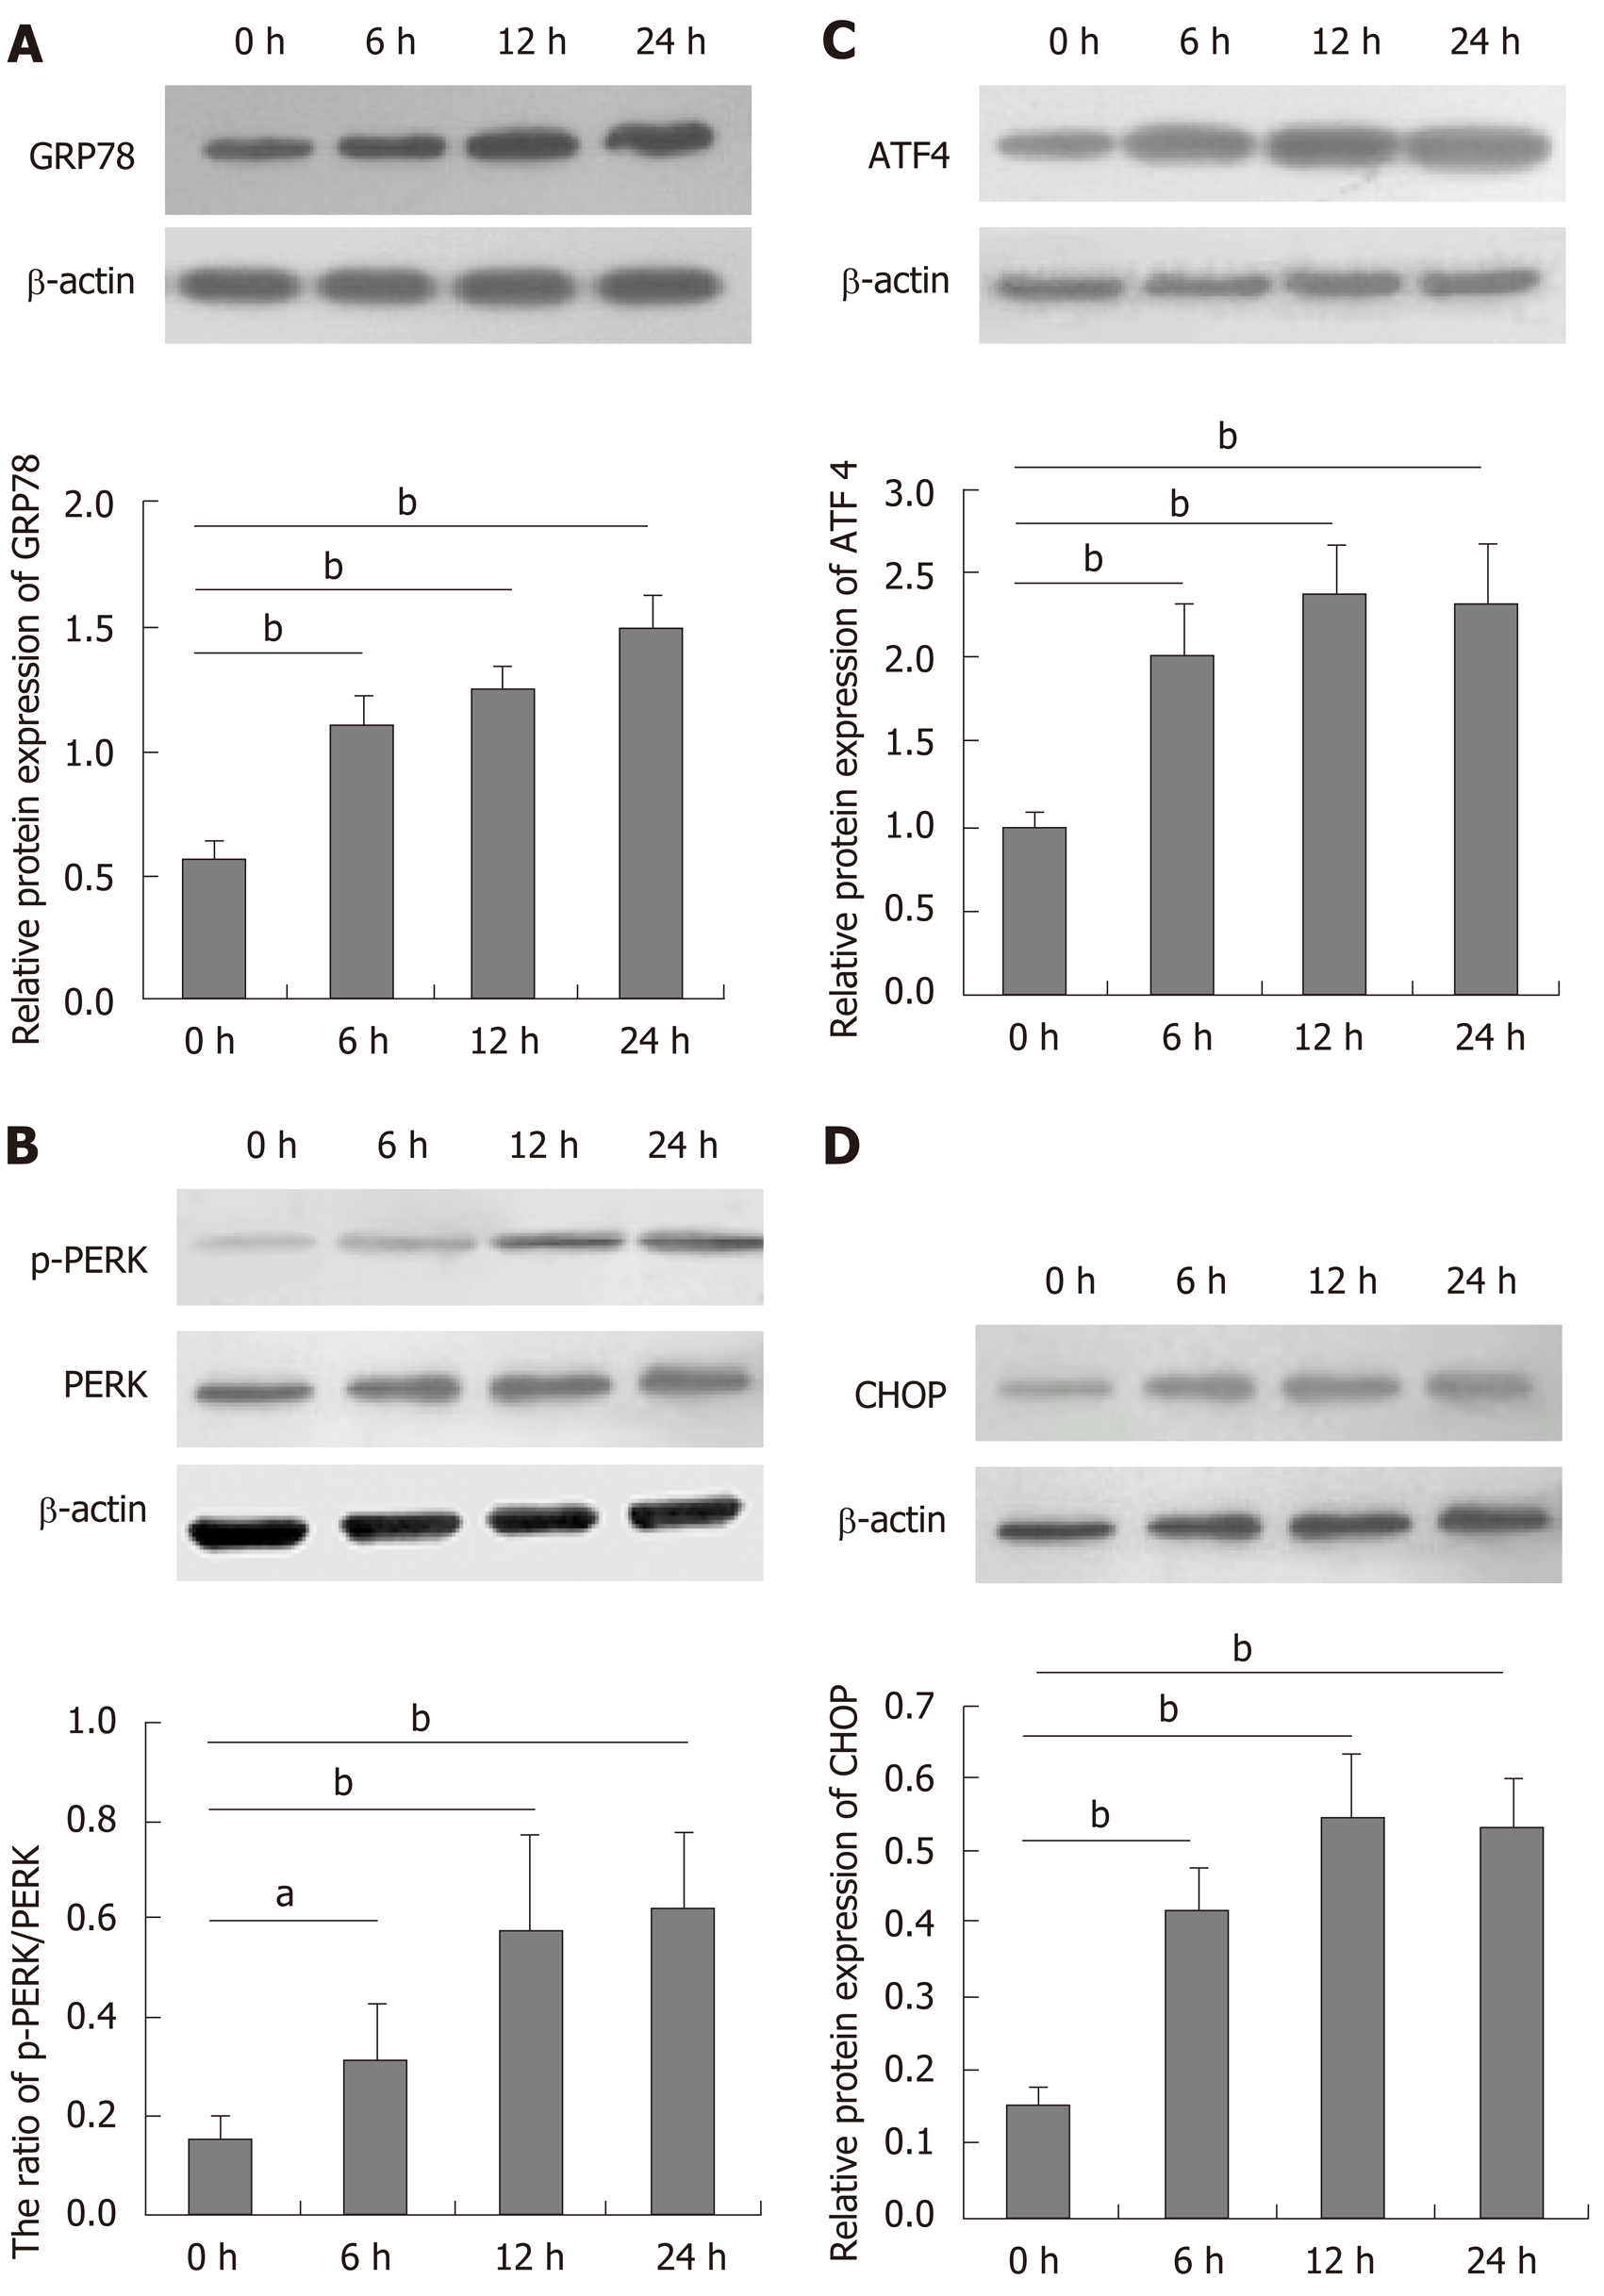
Figure 2 Dithiothreitol induces endoplasmic reticulum stress in BRL-3A cells.
BRL-3A cells were treated in triplicate with, or without, 2.0 mmol/L dithiothreitol for the indicated time periods, and the relative levels of glucose-regulated protein 78, activating transcription factor 4 and C/EBP-homologous protein to β-actin expression and PERK phosphorylation in each group of cells were quantified by Western blot. Data are representative images or expressed as the mean ± SD of each group of cells from three separate experiments. A: Relative glucose-regulated protein 78 expression; B: Relative PERK phosphorylation; C: Relative activating transcription factor 4 expression; D: Relative C/EBP-homologous protein expression. aP < 0.05, bP < 0.01.
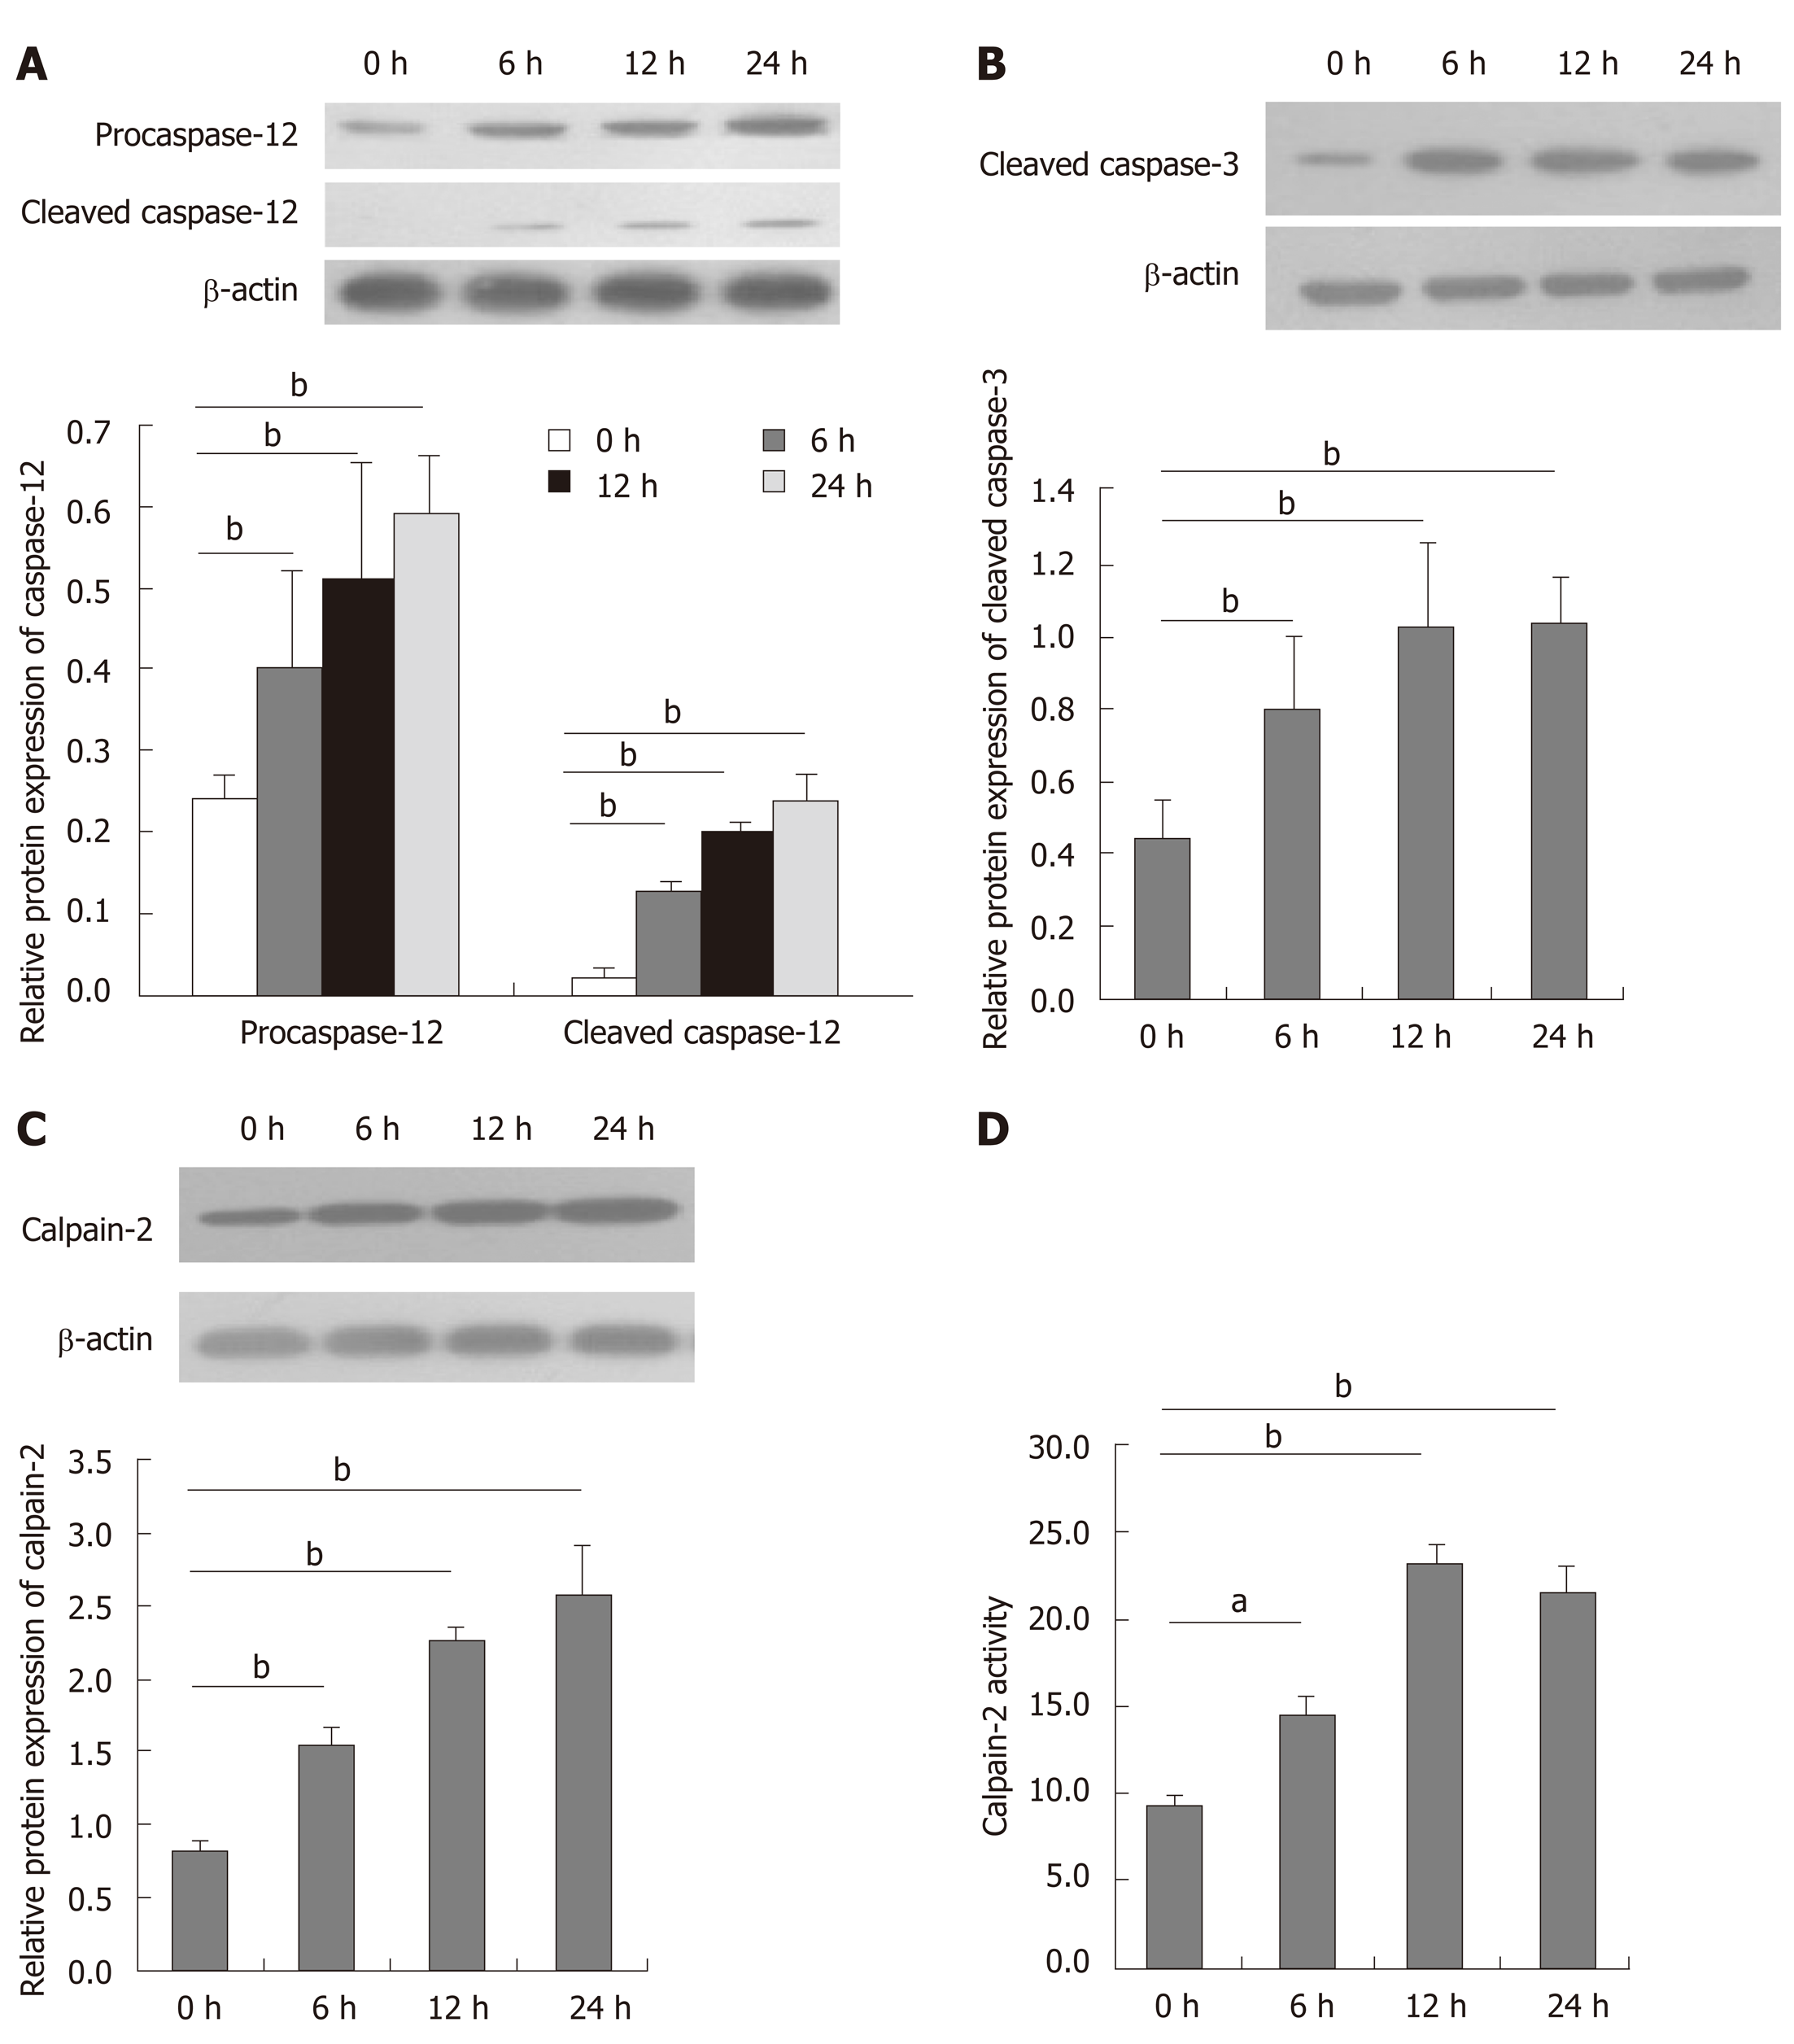
Figure 3 Dithiothreitol induces caspase-12 and caspase-3 activation and increases calpain-2 activity in BRL-3A cells.
After treatment with 2.0 mmol/L dithiothreitol for varying periods, the relative levels of caspase-12, cleaved caspase-12 and cleaved caspase-3 as well as calpain-2 expression in each group of BRL-3A cells were quantified by Western blotting. Furthermore, the activity of calpain-2 in each group of cells was measured. Data are representative images or expressed as the mean ± SD of each group of cells from three separate experiments. A: Caspase-12 activation; B: Caspase-3 activation; C: Calpain-2 expression; D: Calpain-2 activity. aP < 0.05, bP < 0.01.
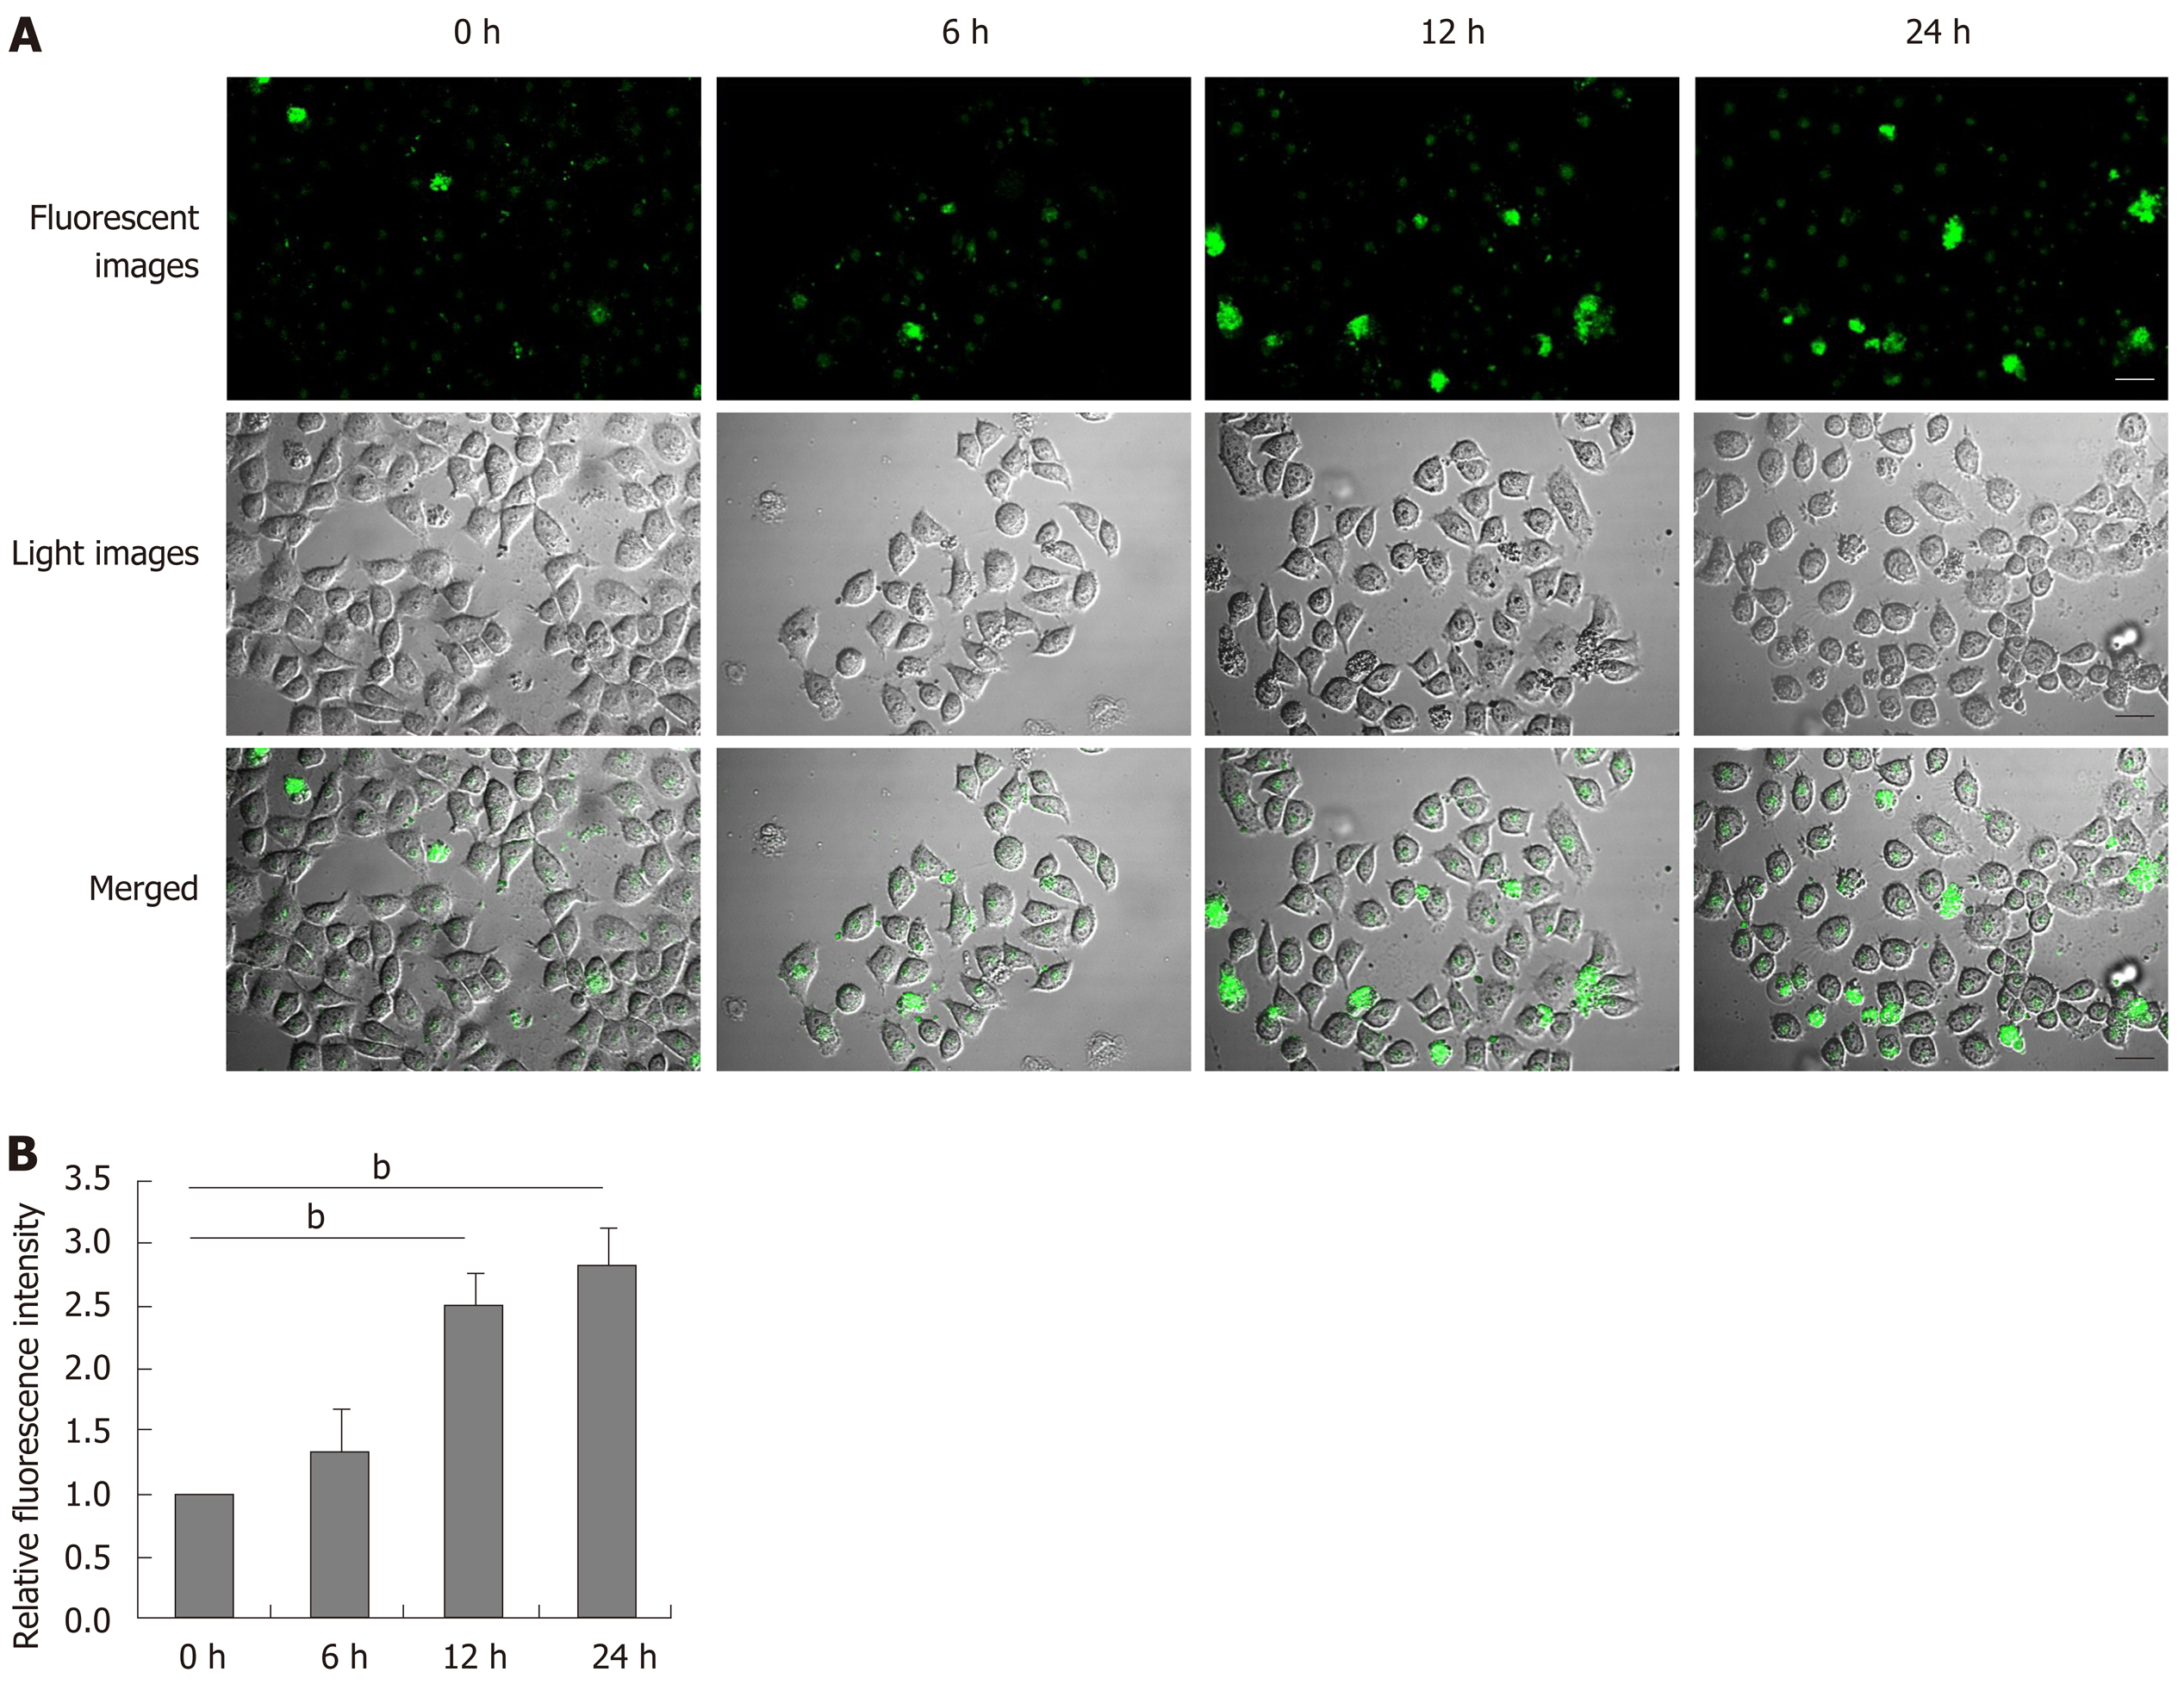
Figure 4 Dithiothreitol increases the levels of intracellular Ca2+ in BRL-3A cells.
After treatment with 2.0 mmol/L dithiothreitol for varying time periods, the cells were labeled by Fluo-3 AM. The cell morphology and fluorescent signals in cells were observed by microscopy. A: Representative images of Fluo-3 fluorescence and morphology in BRL-3A cells following dithiothreitol treatment (Scale bars: 25 μm); B: Quantification of fluorescence intensity in BRL-3A cells. Data are representative images (magnification 200 ×) or expressed as the mean ± SD of each group of cells from three separate experiments. bP < 0.01.
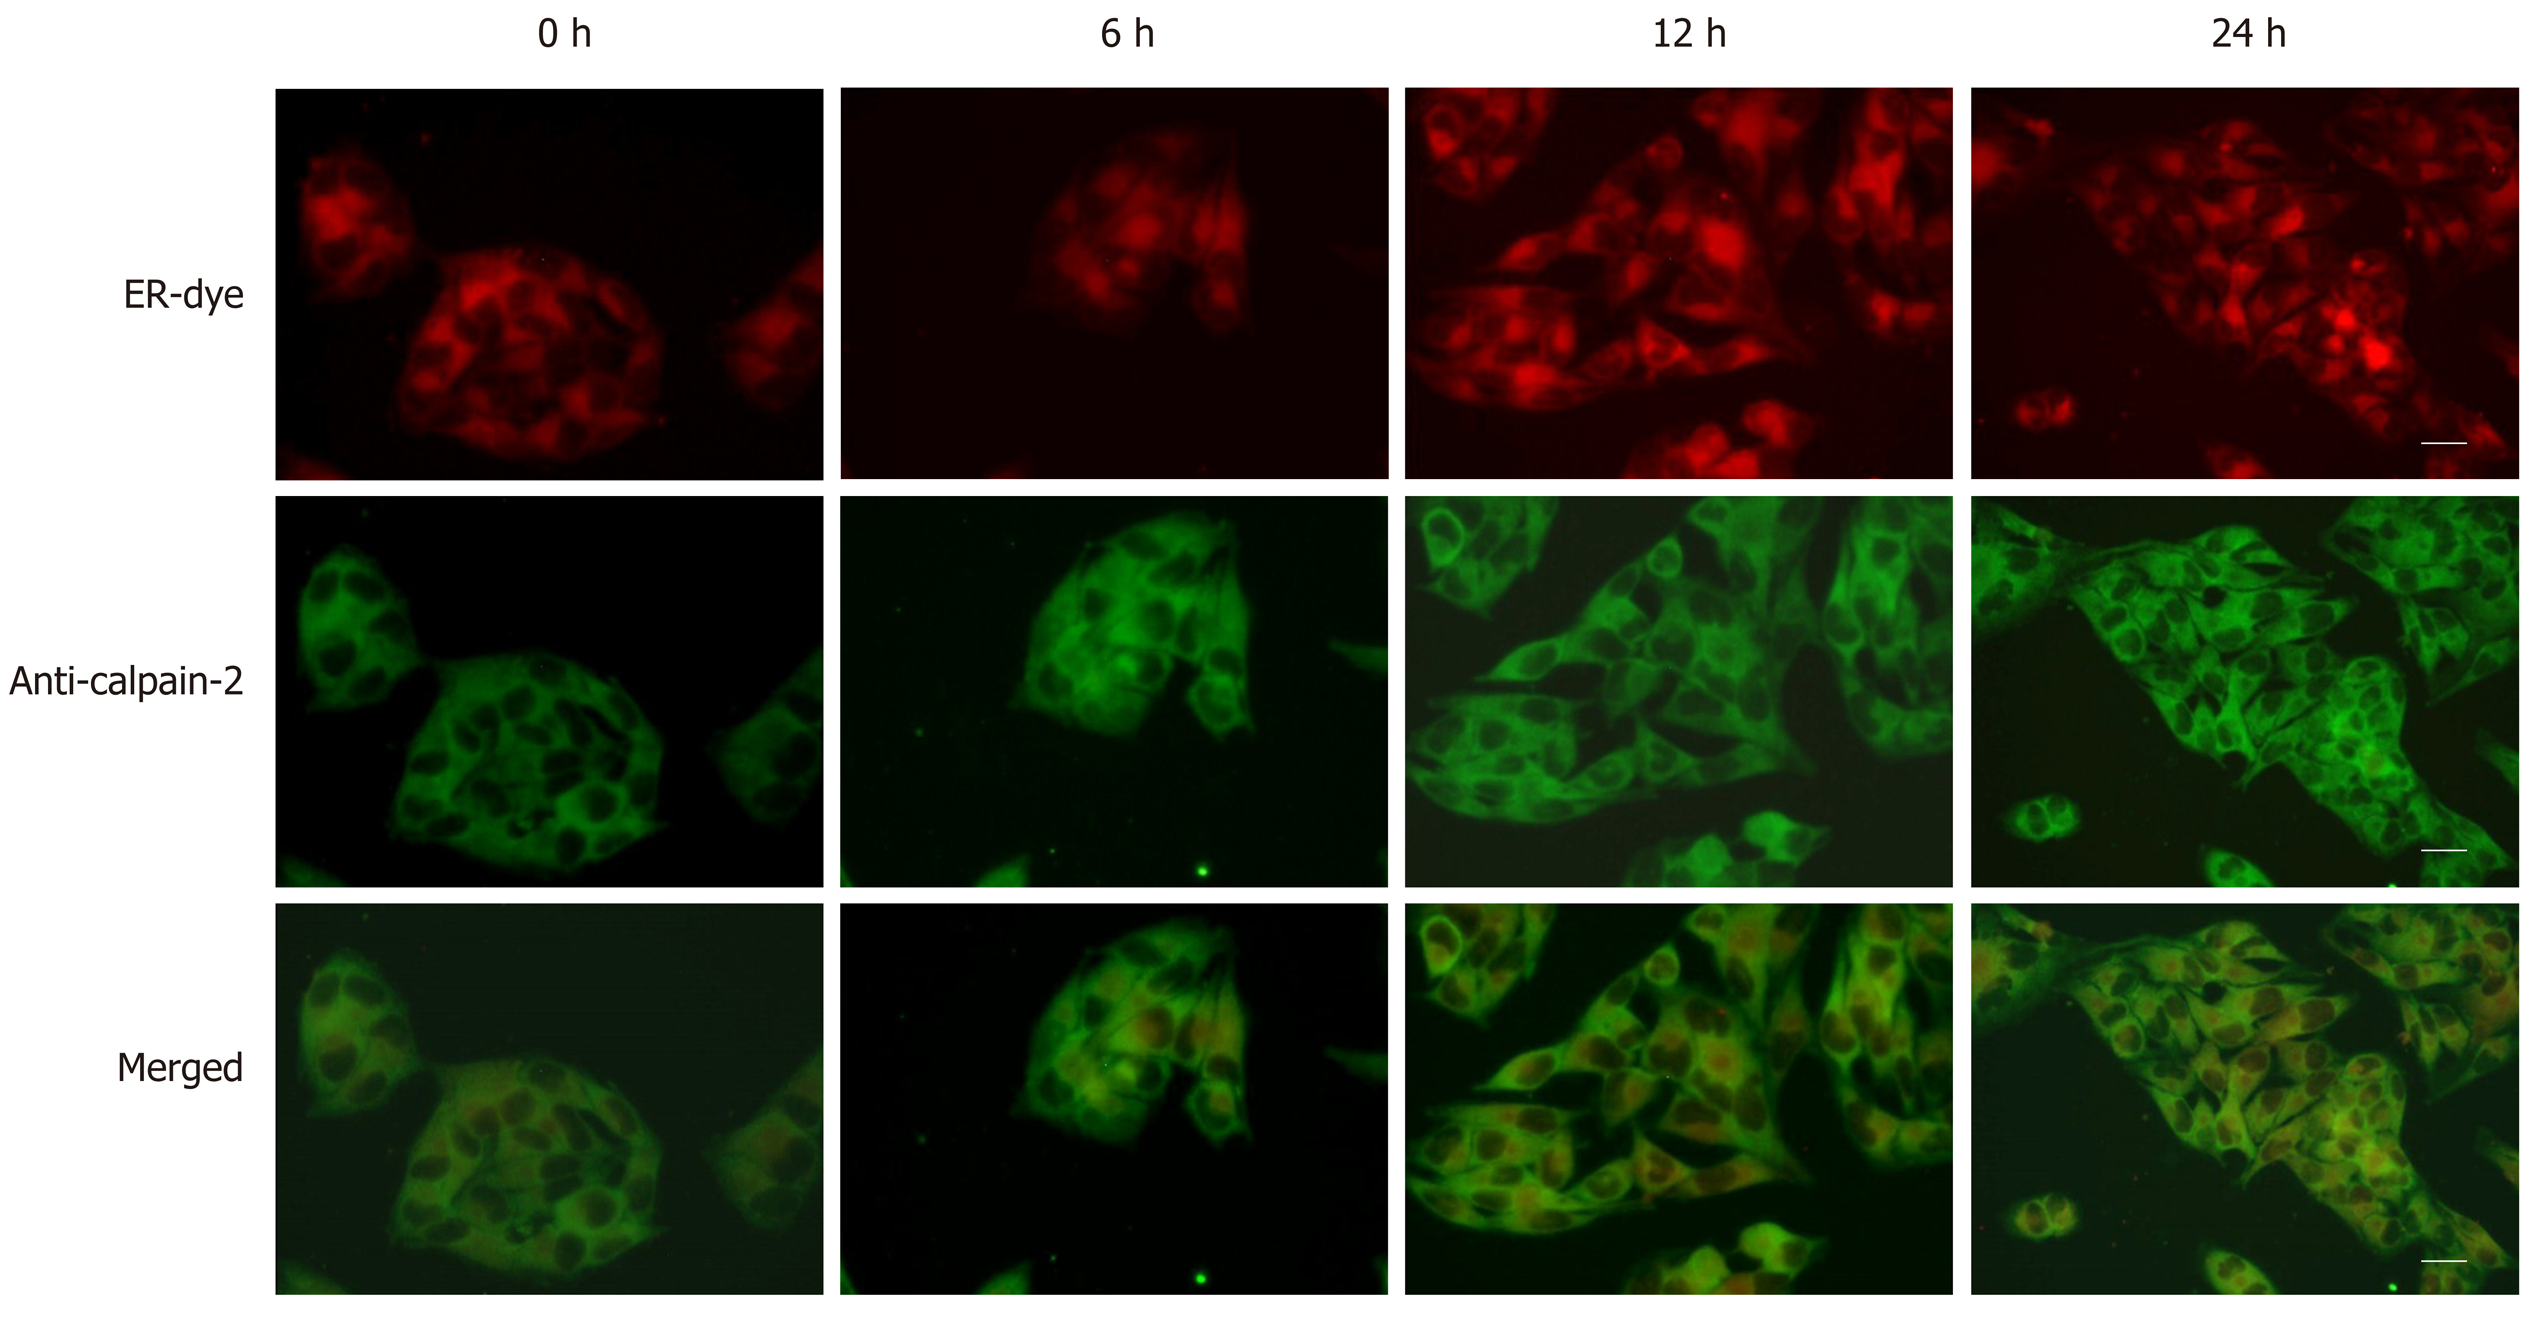
Figure 5 Dithiothreitol promotes the accumulation of calpain-2 in the endoplasmic reticulum of BRL-3A cells.
After treatment with 2.0 mmol/L dithiothreitol for varying time periods, the cells were labeled with endoplasmic reticulum-tracker red dye, fixed, permeabilized, followed by staining with fluorescent-anti-calpain-2 (green). The cells were examined by fluorescent microscopy, scale bars, 25 μm. Data are representative images (magnification 200 ×) of each group of cells from three separate experiments.
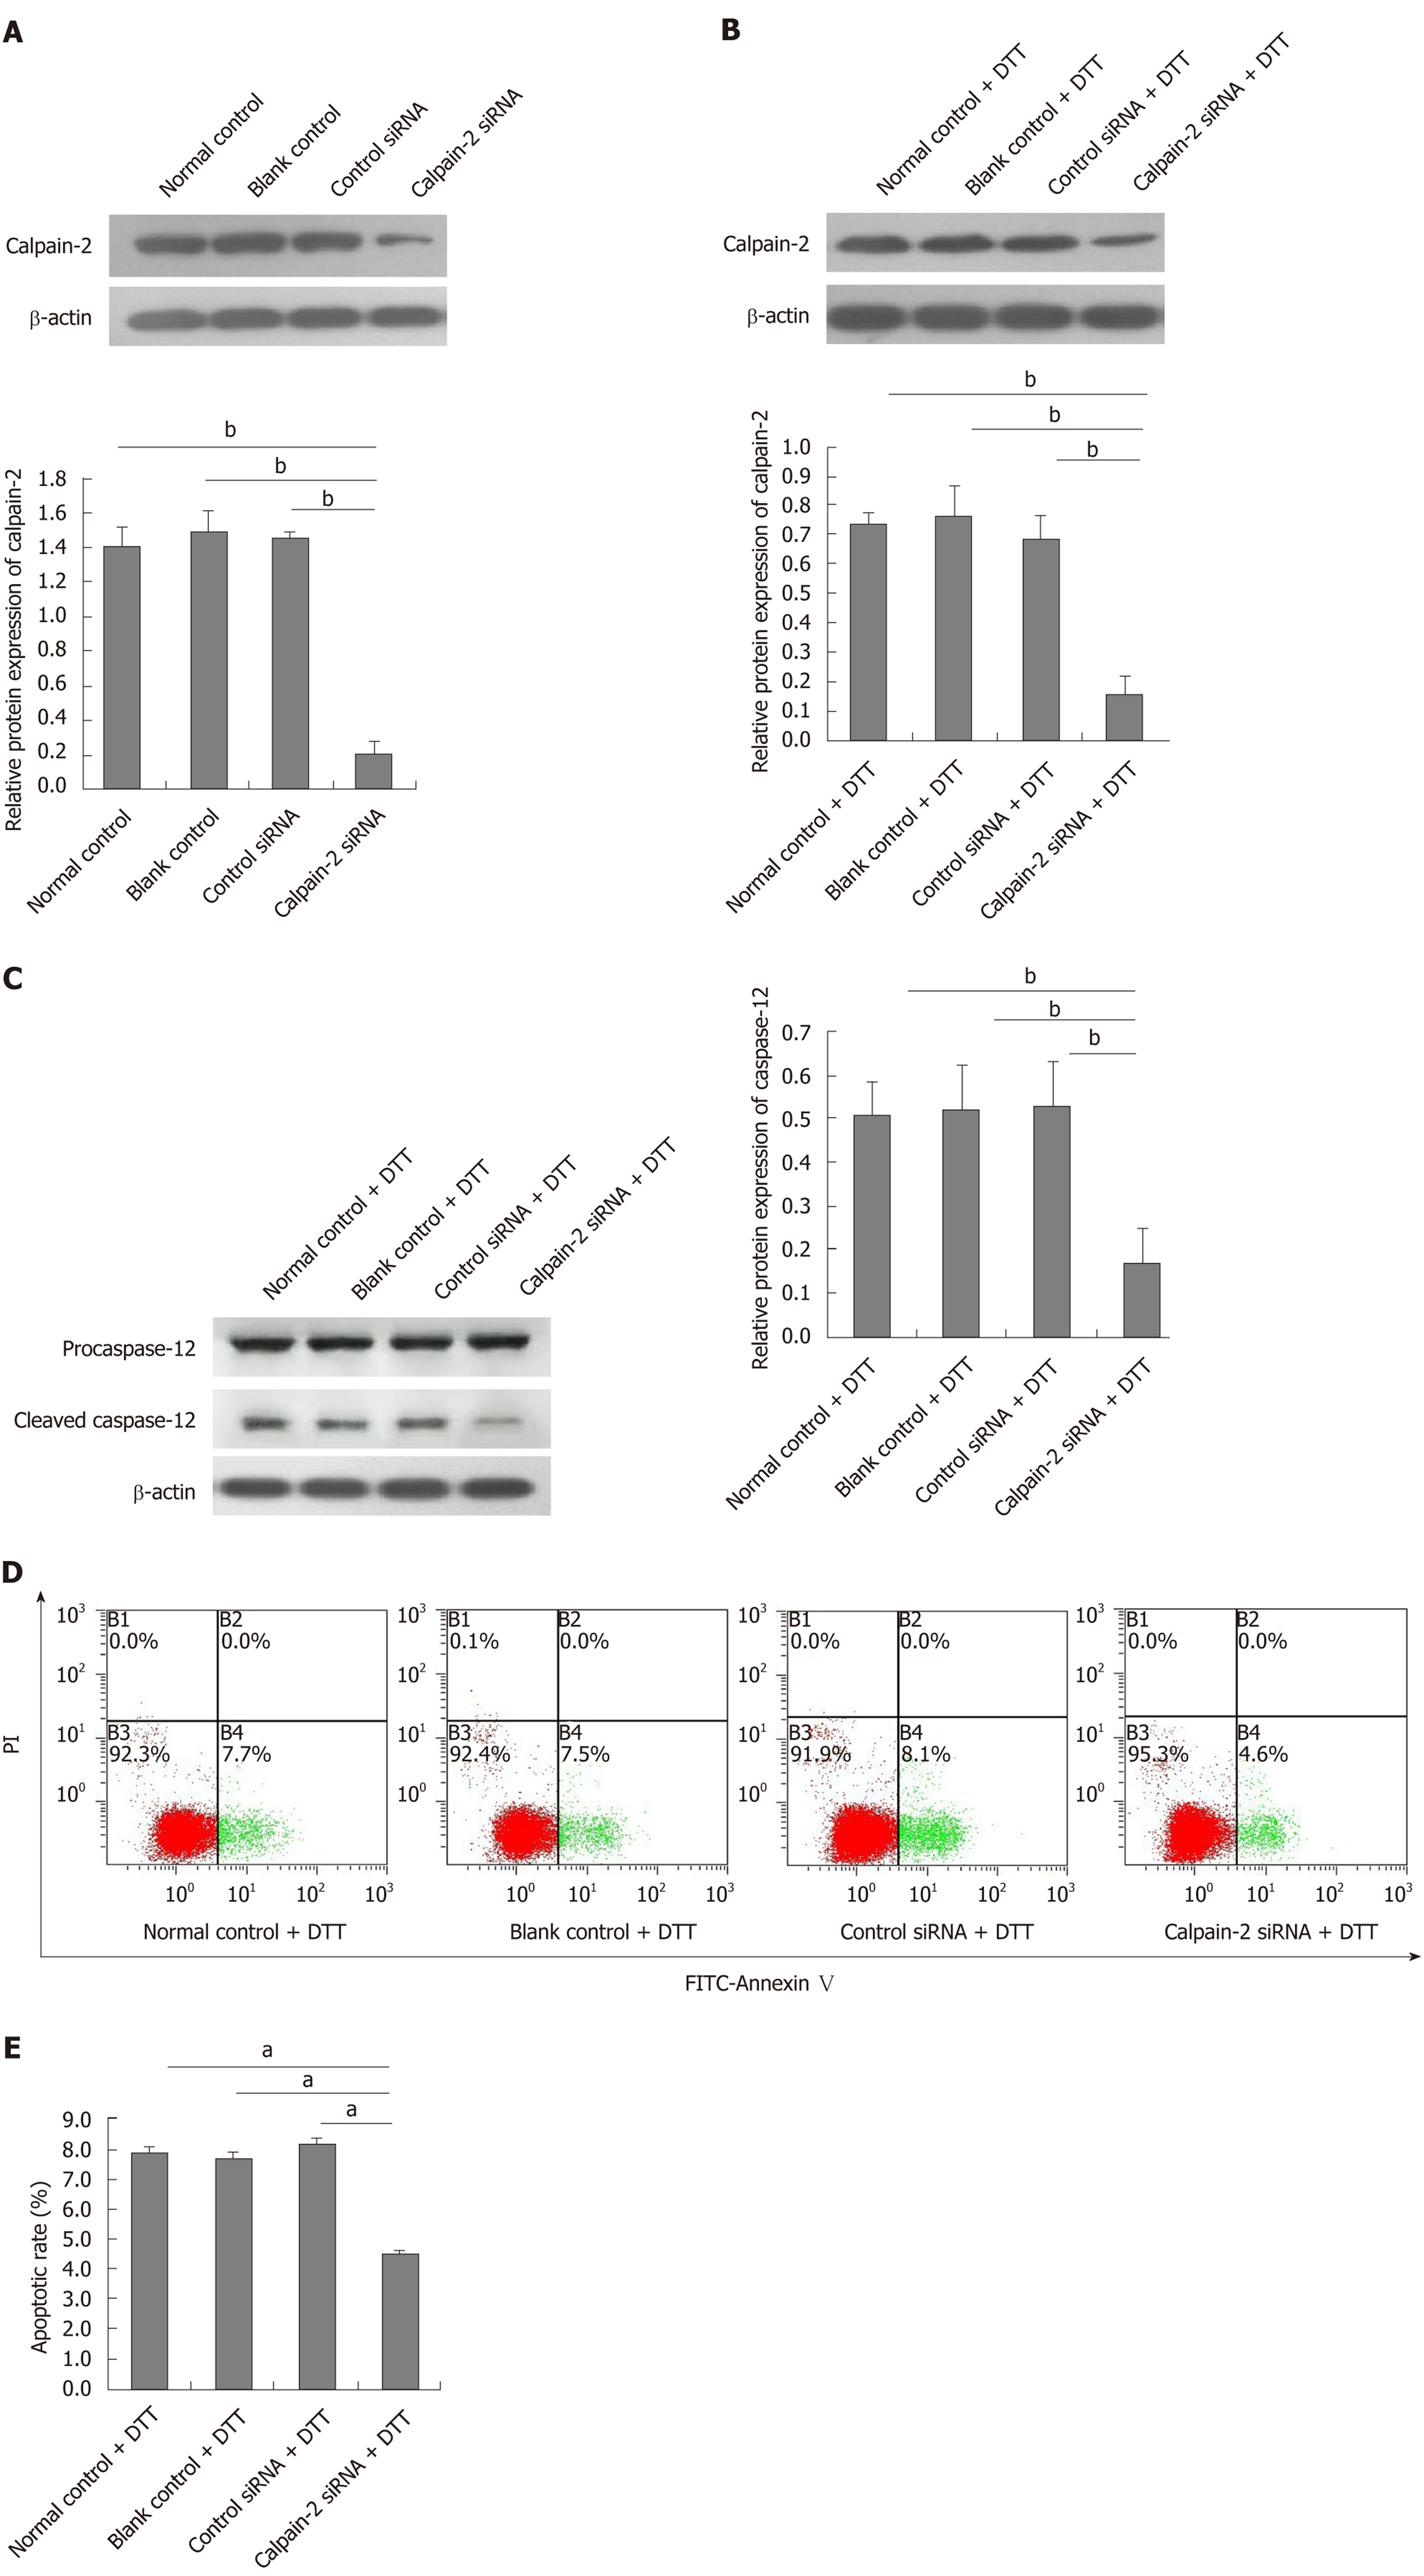
Figure 6 Calpain-2 silencing mitigates dithiothreitol-upregulated calpain-2 expression, caspase-12 activation and apoptosis of BRL-3A cells.
BRL-3A cells were transfected with, or without, control or calpain-2 specific siRNA for 48 h and treated with, or without, dithiothreitol (DTT). The relative levels of calpain-2 expression and caspase-12 activation were quantified by Western blot. The percentages of apoptotic cells were quantified by flow cytometry. Data are representative images or expressed as the mean ± SD of each group of cells from three separate experiments. A: Calpain-2 silencing; B: Calpain-2 silencing mitigates DTT-upregulated calpain-2 expression; C: Calpain-2 silencing decreases DTT-induced caspase-12 activation; D, E: Calpain-2 silencing mitigates DTT-triggered apoptosis of BRL-3A cells. aP < 0.05, bP < 0.01.
- Citation: Xie RJ, Hu XX, Zheng L, Cai S, Chen YS, Yang Y, Yang T, Han B, Yang Q. Calpain-2 activity promotes aberrant endoplasmic reticulum stress-related apoptosis in hepatocytes. World J Gastroenterol 2020; 26(13): 1450-1462
- URL: https://www.wjgnet.com/1007-9327/full/v26/i13/1450.htm
- DOI: https://dx.doi.org/10.3748/wjg.v26.i13.1450


