Copyright
©The Author(s) 2020.
World J Gastroenterol. Jan 7, 2020; 26(1): 97-108
Published online Jan 7, 2020. doi: 10.3748/wjg.v26.i1.97
Published online Jan 7, 2020. doi: 10.3748/wjg.v26.i1.97
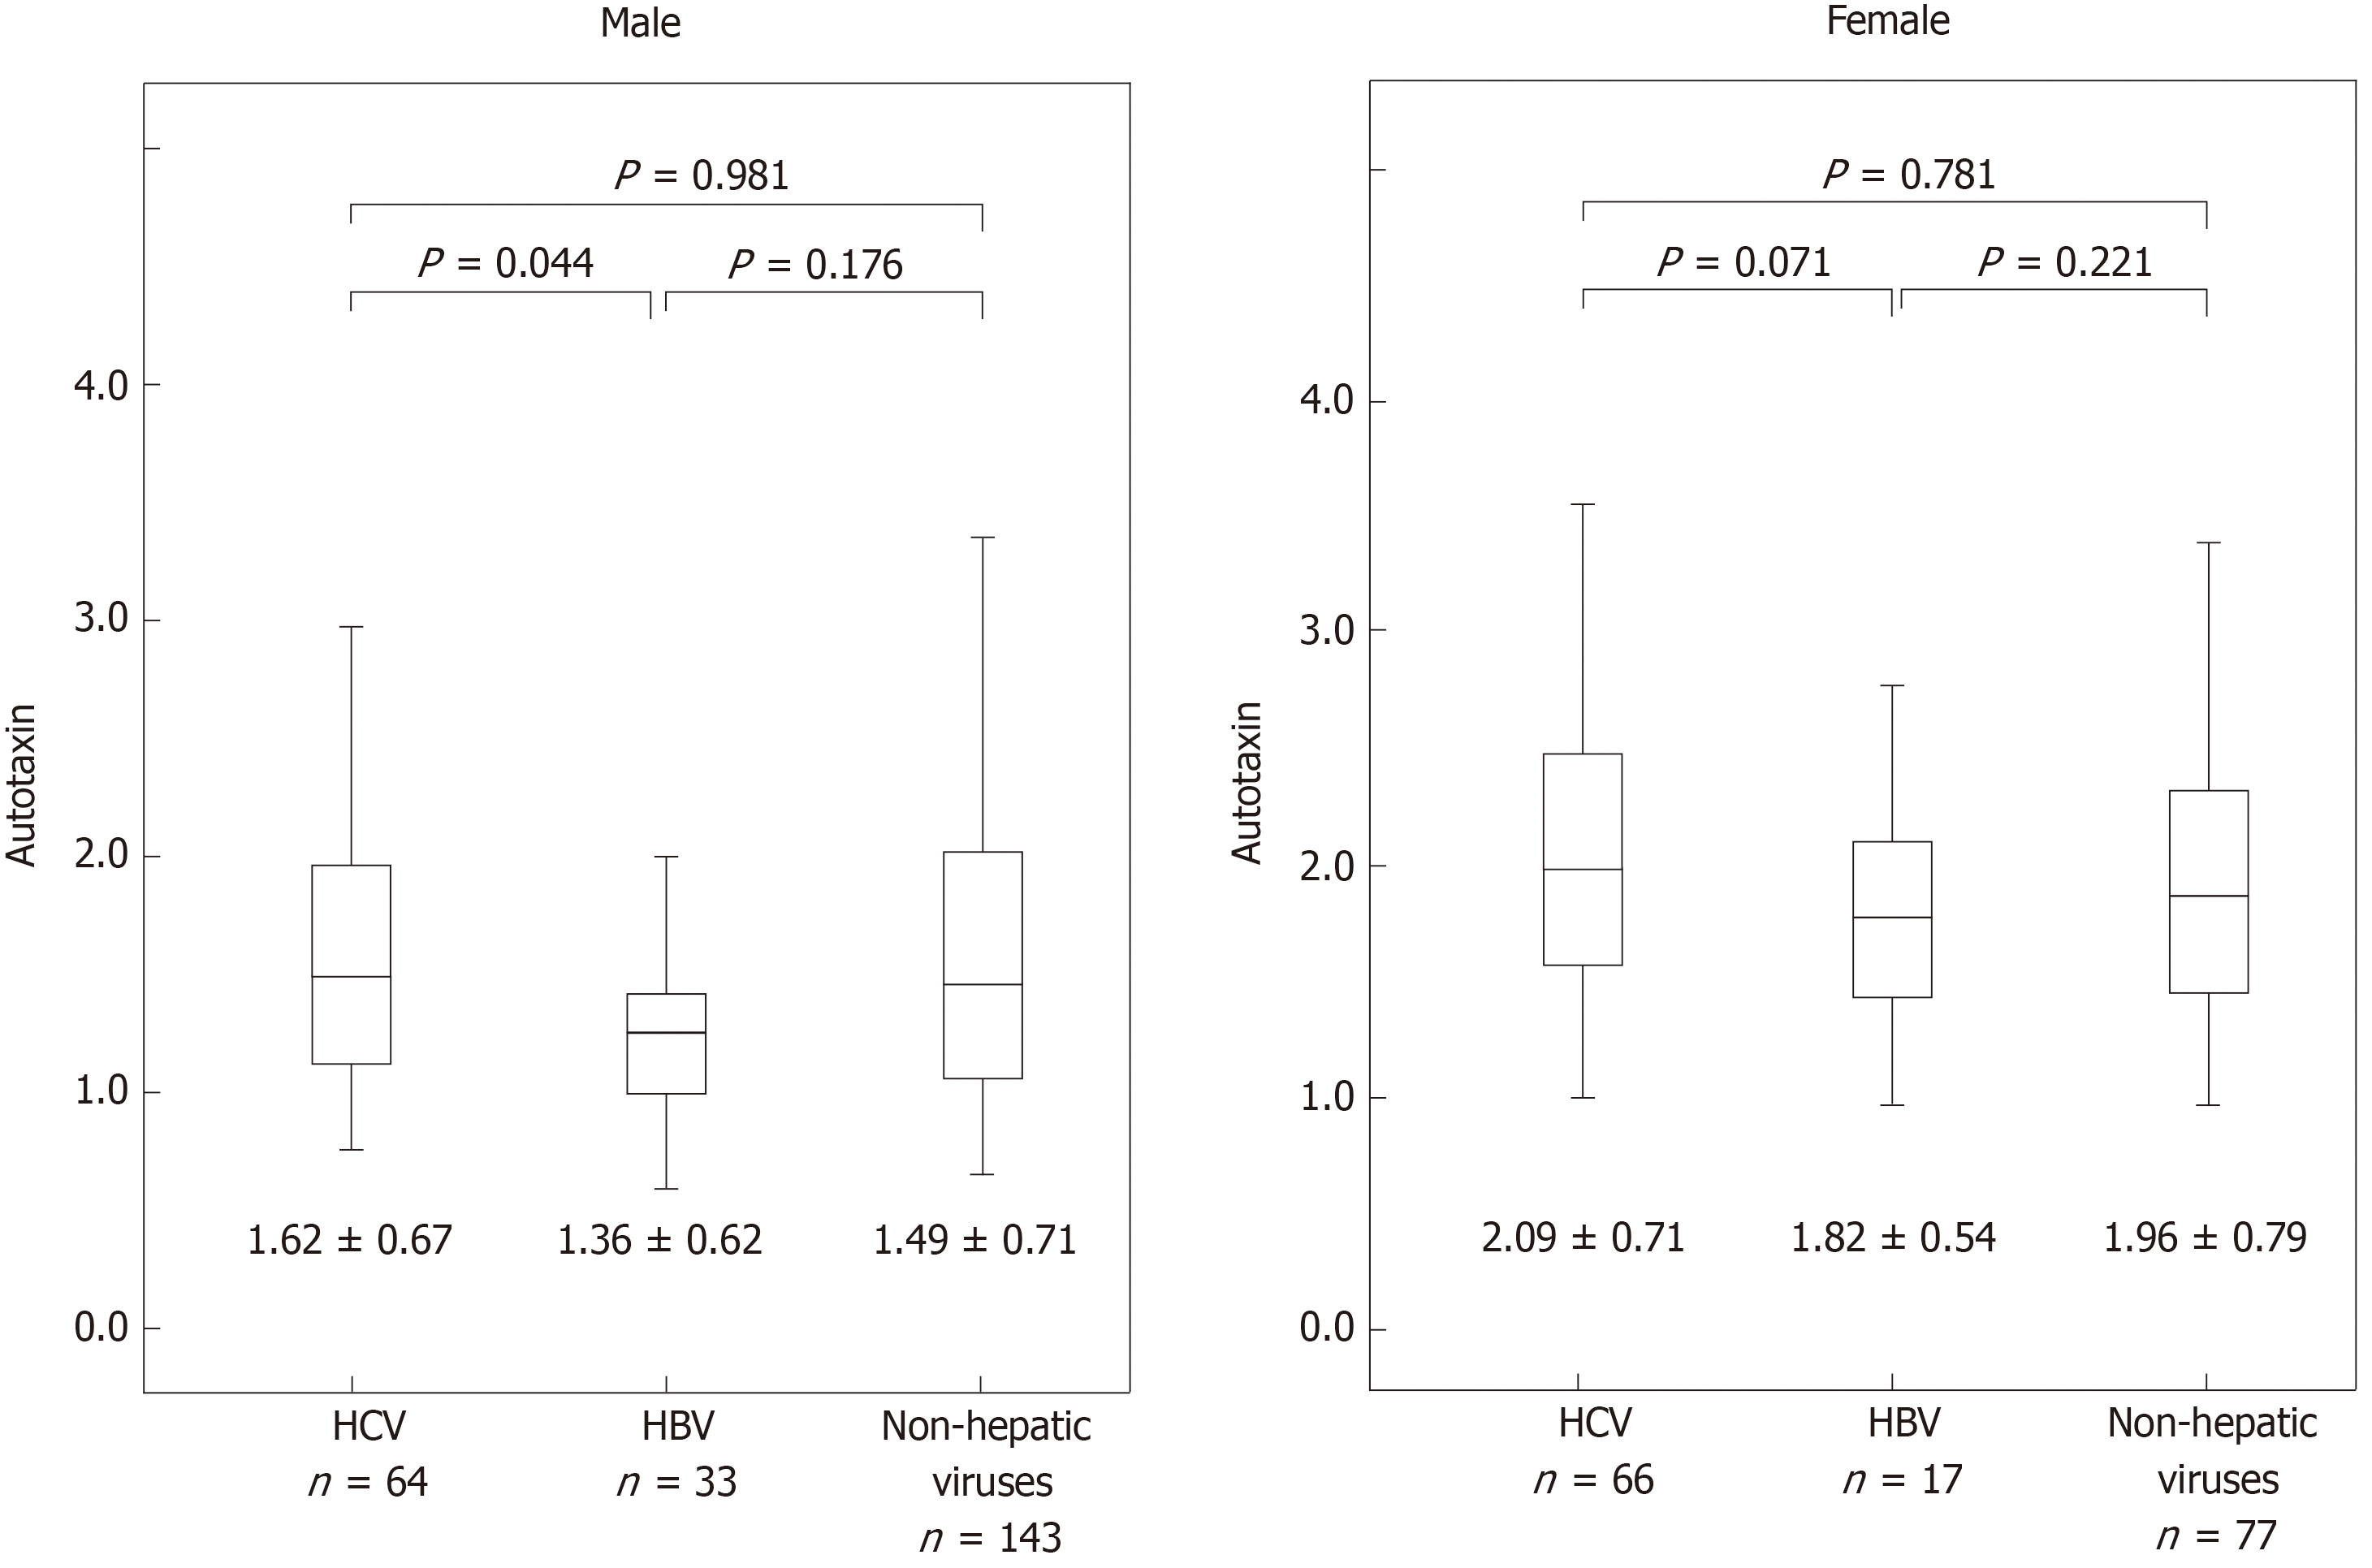
Figure 1 Comparison of autotaxin levels and the etiology.
Data are expressed as mean ± SD. Separate analyses of the etiology are compared using Tukey’s honestly significant difference test. HCV: Hepatitis C virus; HBV: Hepatitis B virus.
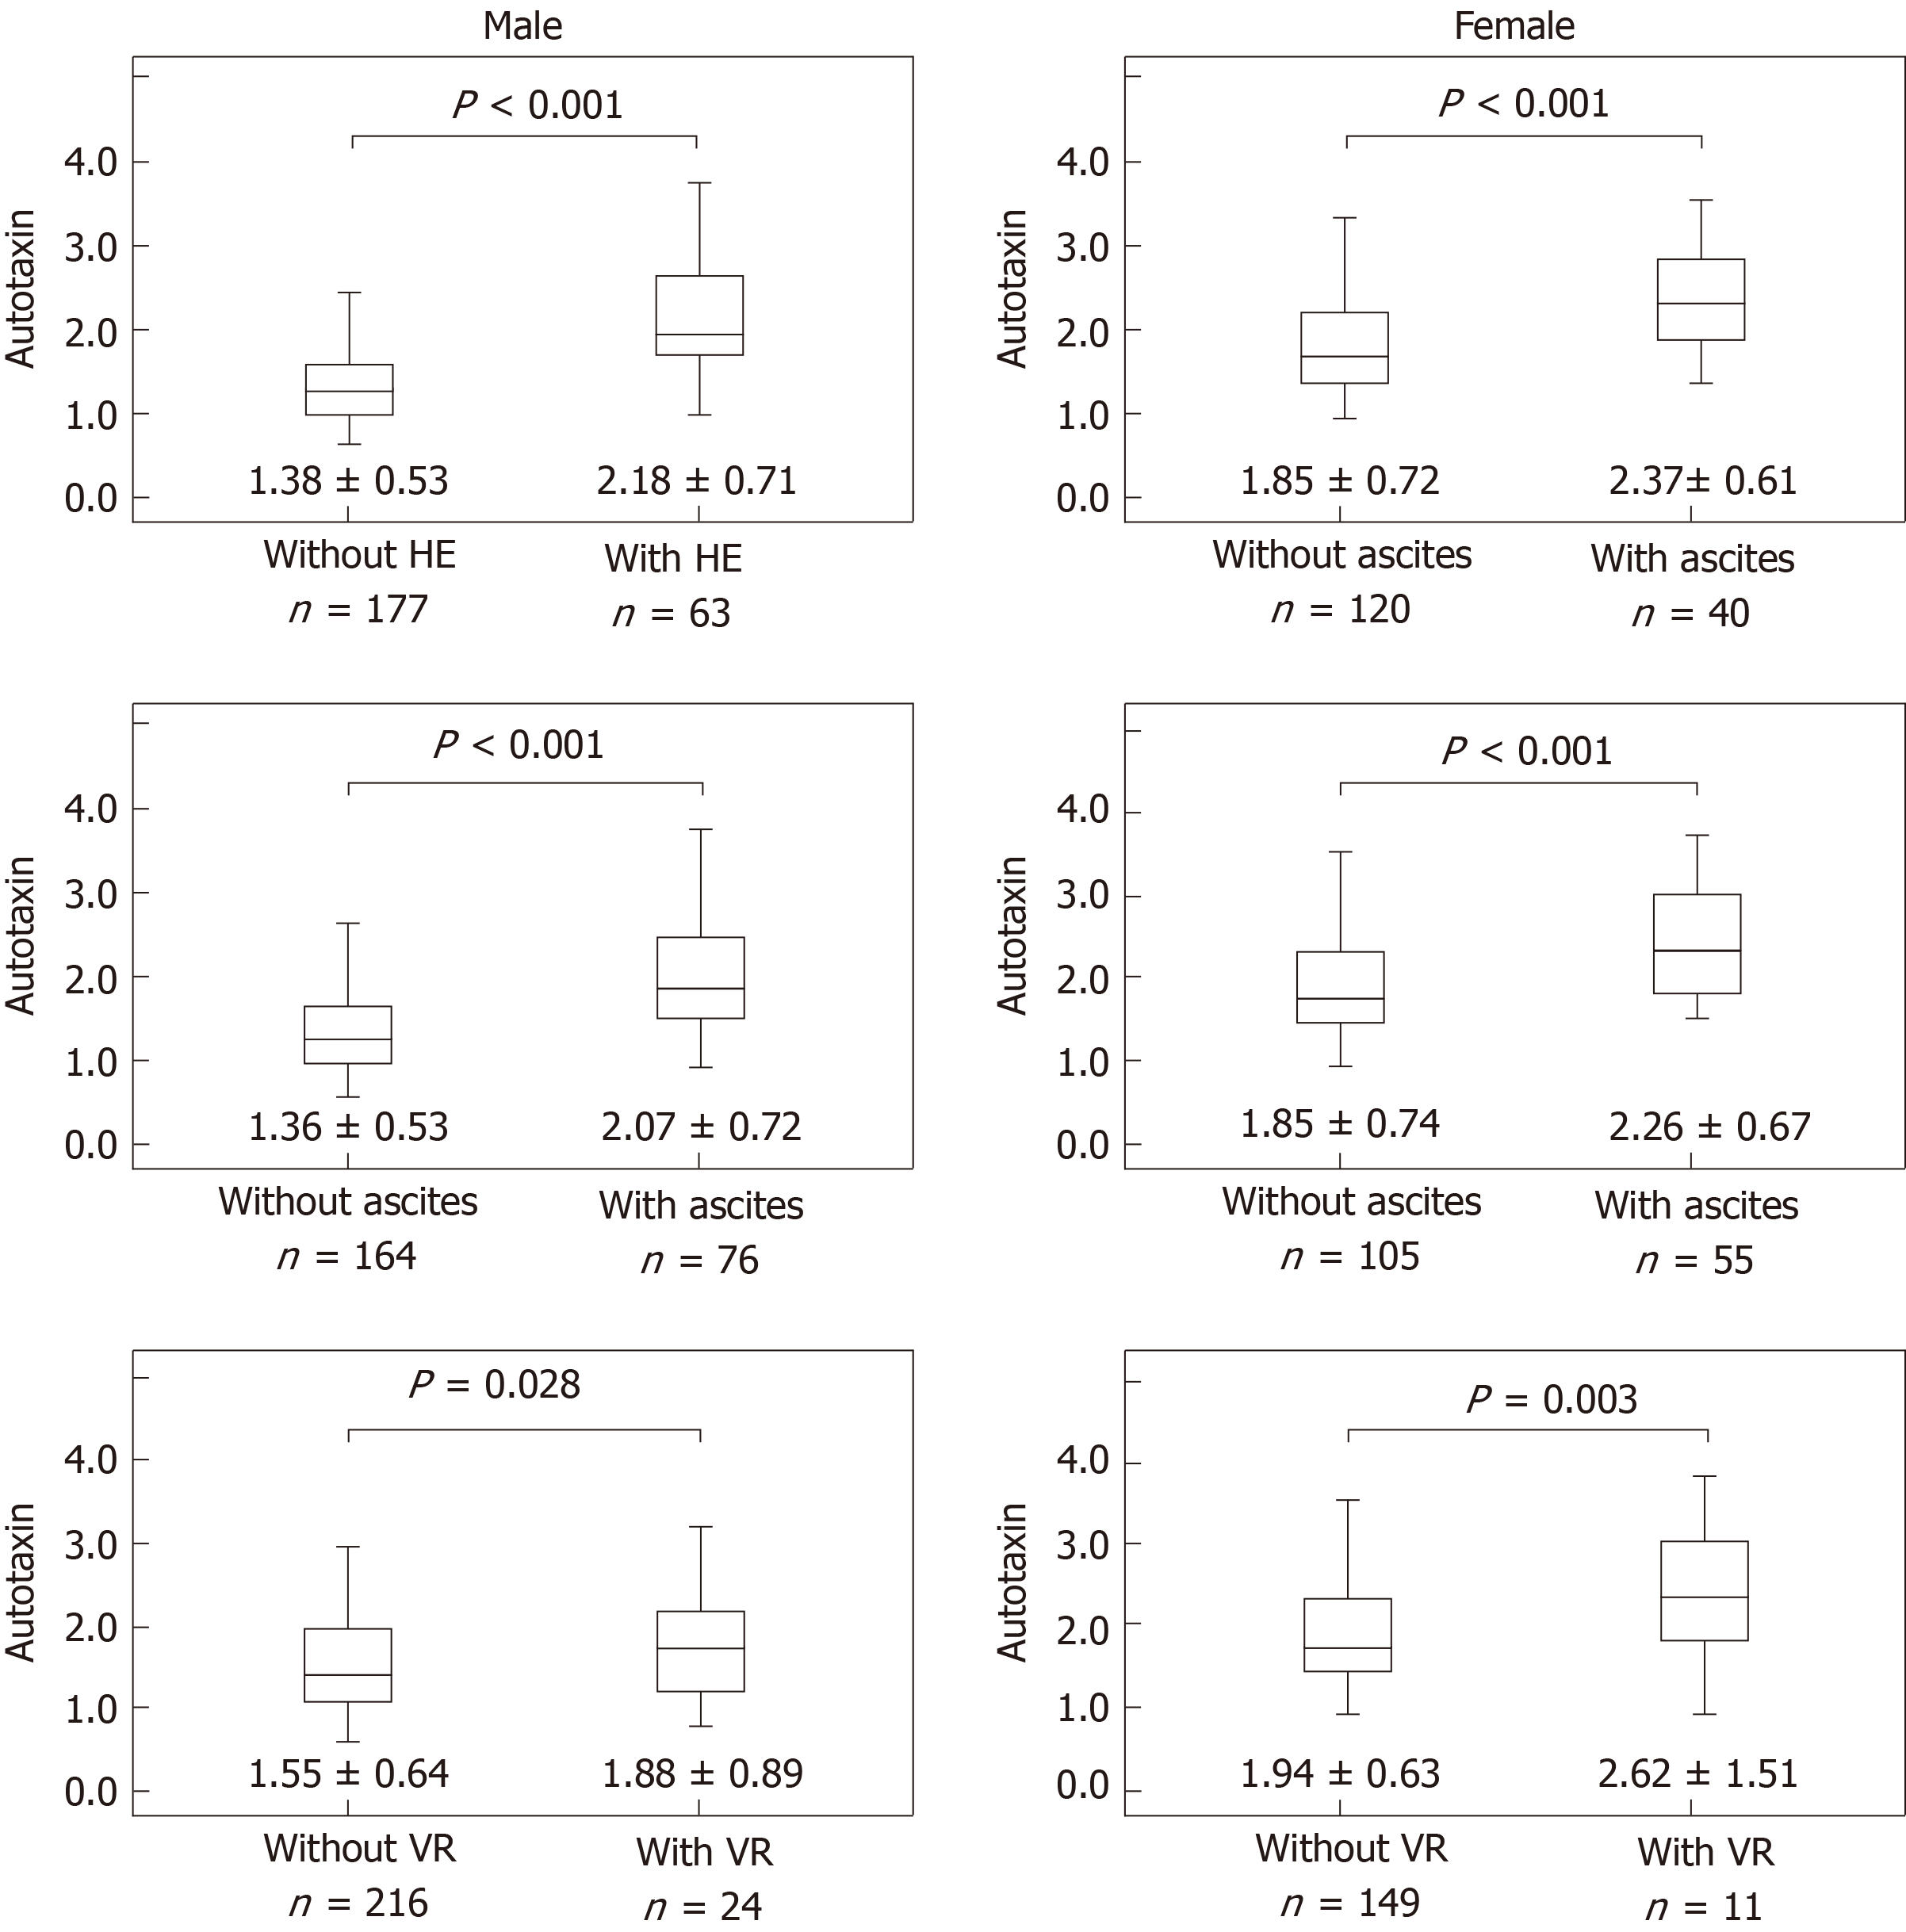
Figure 2 Comparison of autotaxin levels and severe complications of liver cirrosis.
Data are expressed as mean ± SD. Separate analyses of complications were compared using the unpaired t-test. HE: Hepatic encephalopathy; VR: Varix ruptu.
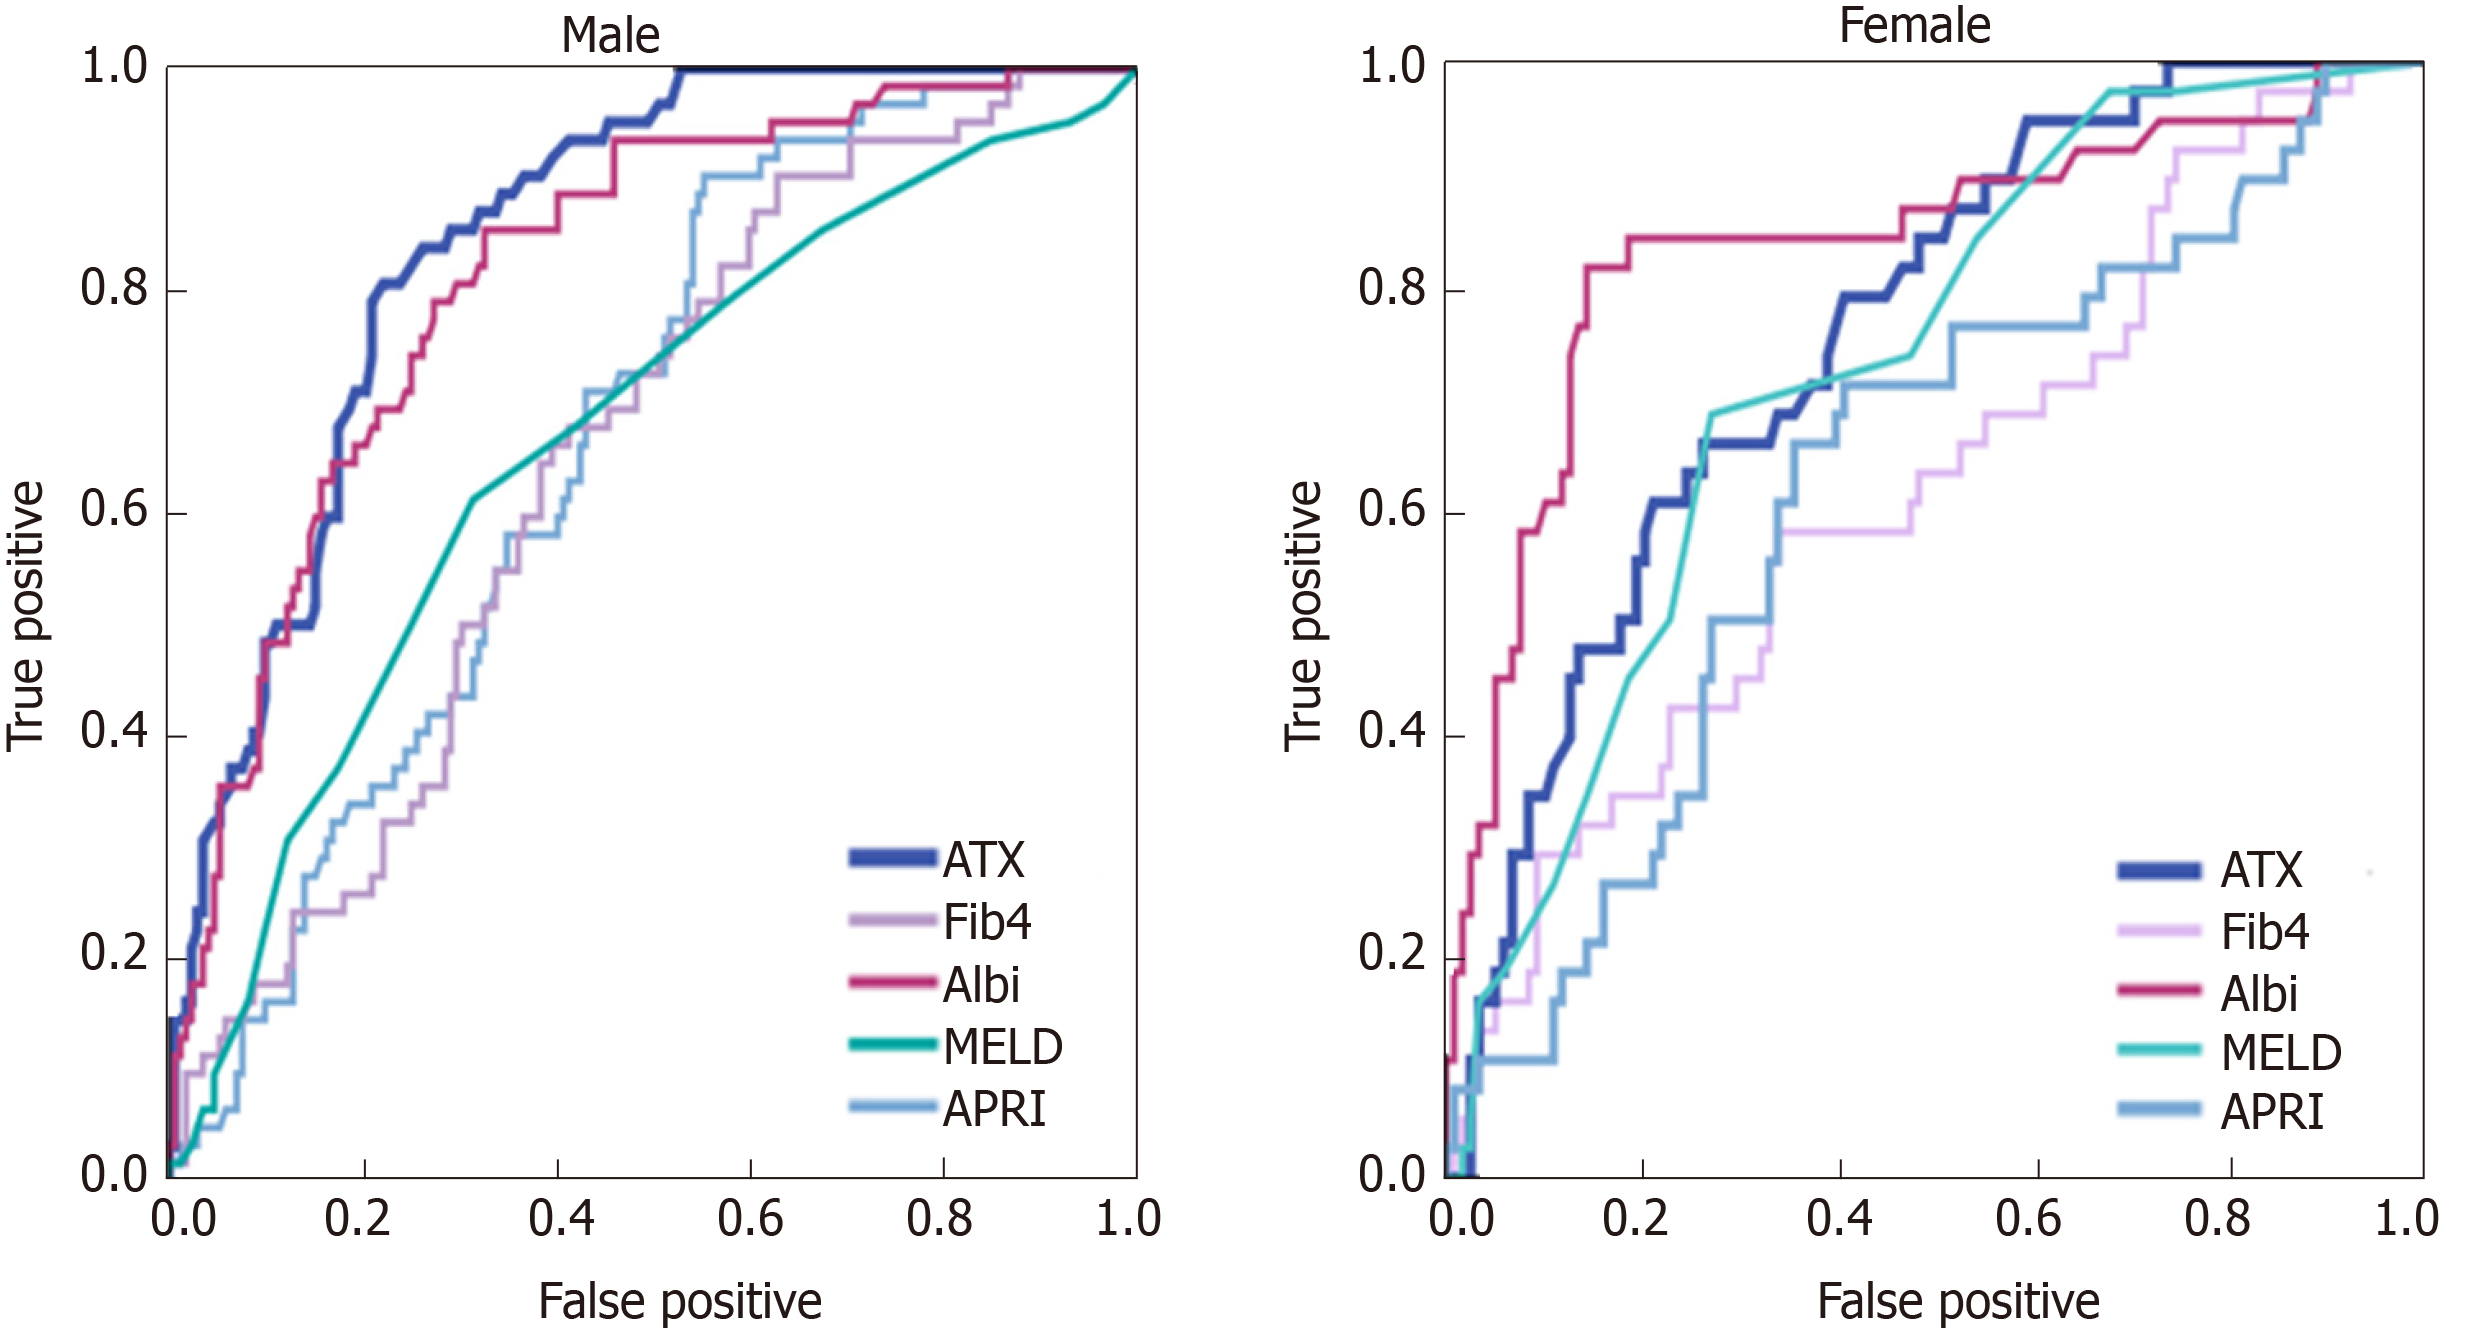
Figure 3 Comparison of autotaxin and serum biomarkers for assessment of hepatic encephalopathy by the receiver operating characteristic curve analysis.
The Area under the curves of autotaxin in men were higher than those in women and all the other biomarkers for detecting encephalopathy. ATX: Autotaxin; Fib-4: Fibrosis-4; ALBI: Albumin-bilirubin index; MELD: Model for end-stage liver disease; APRI: Aspartate aminotransferase-to-platelet ratio index.
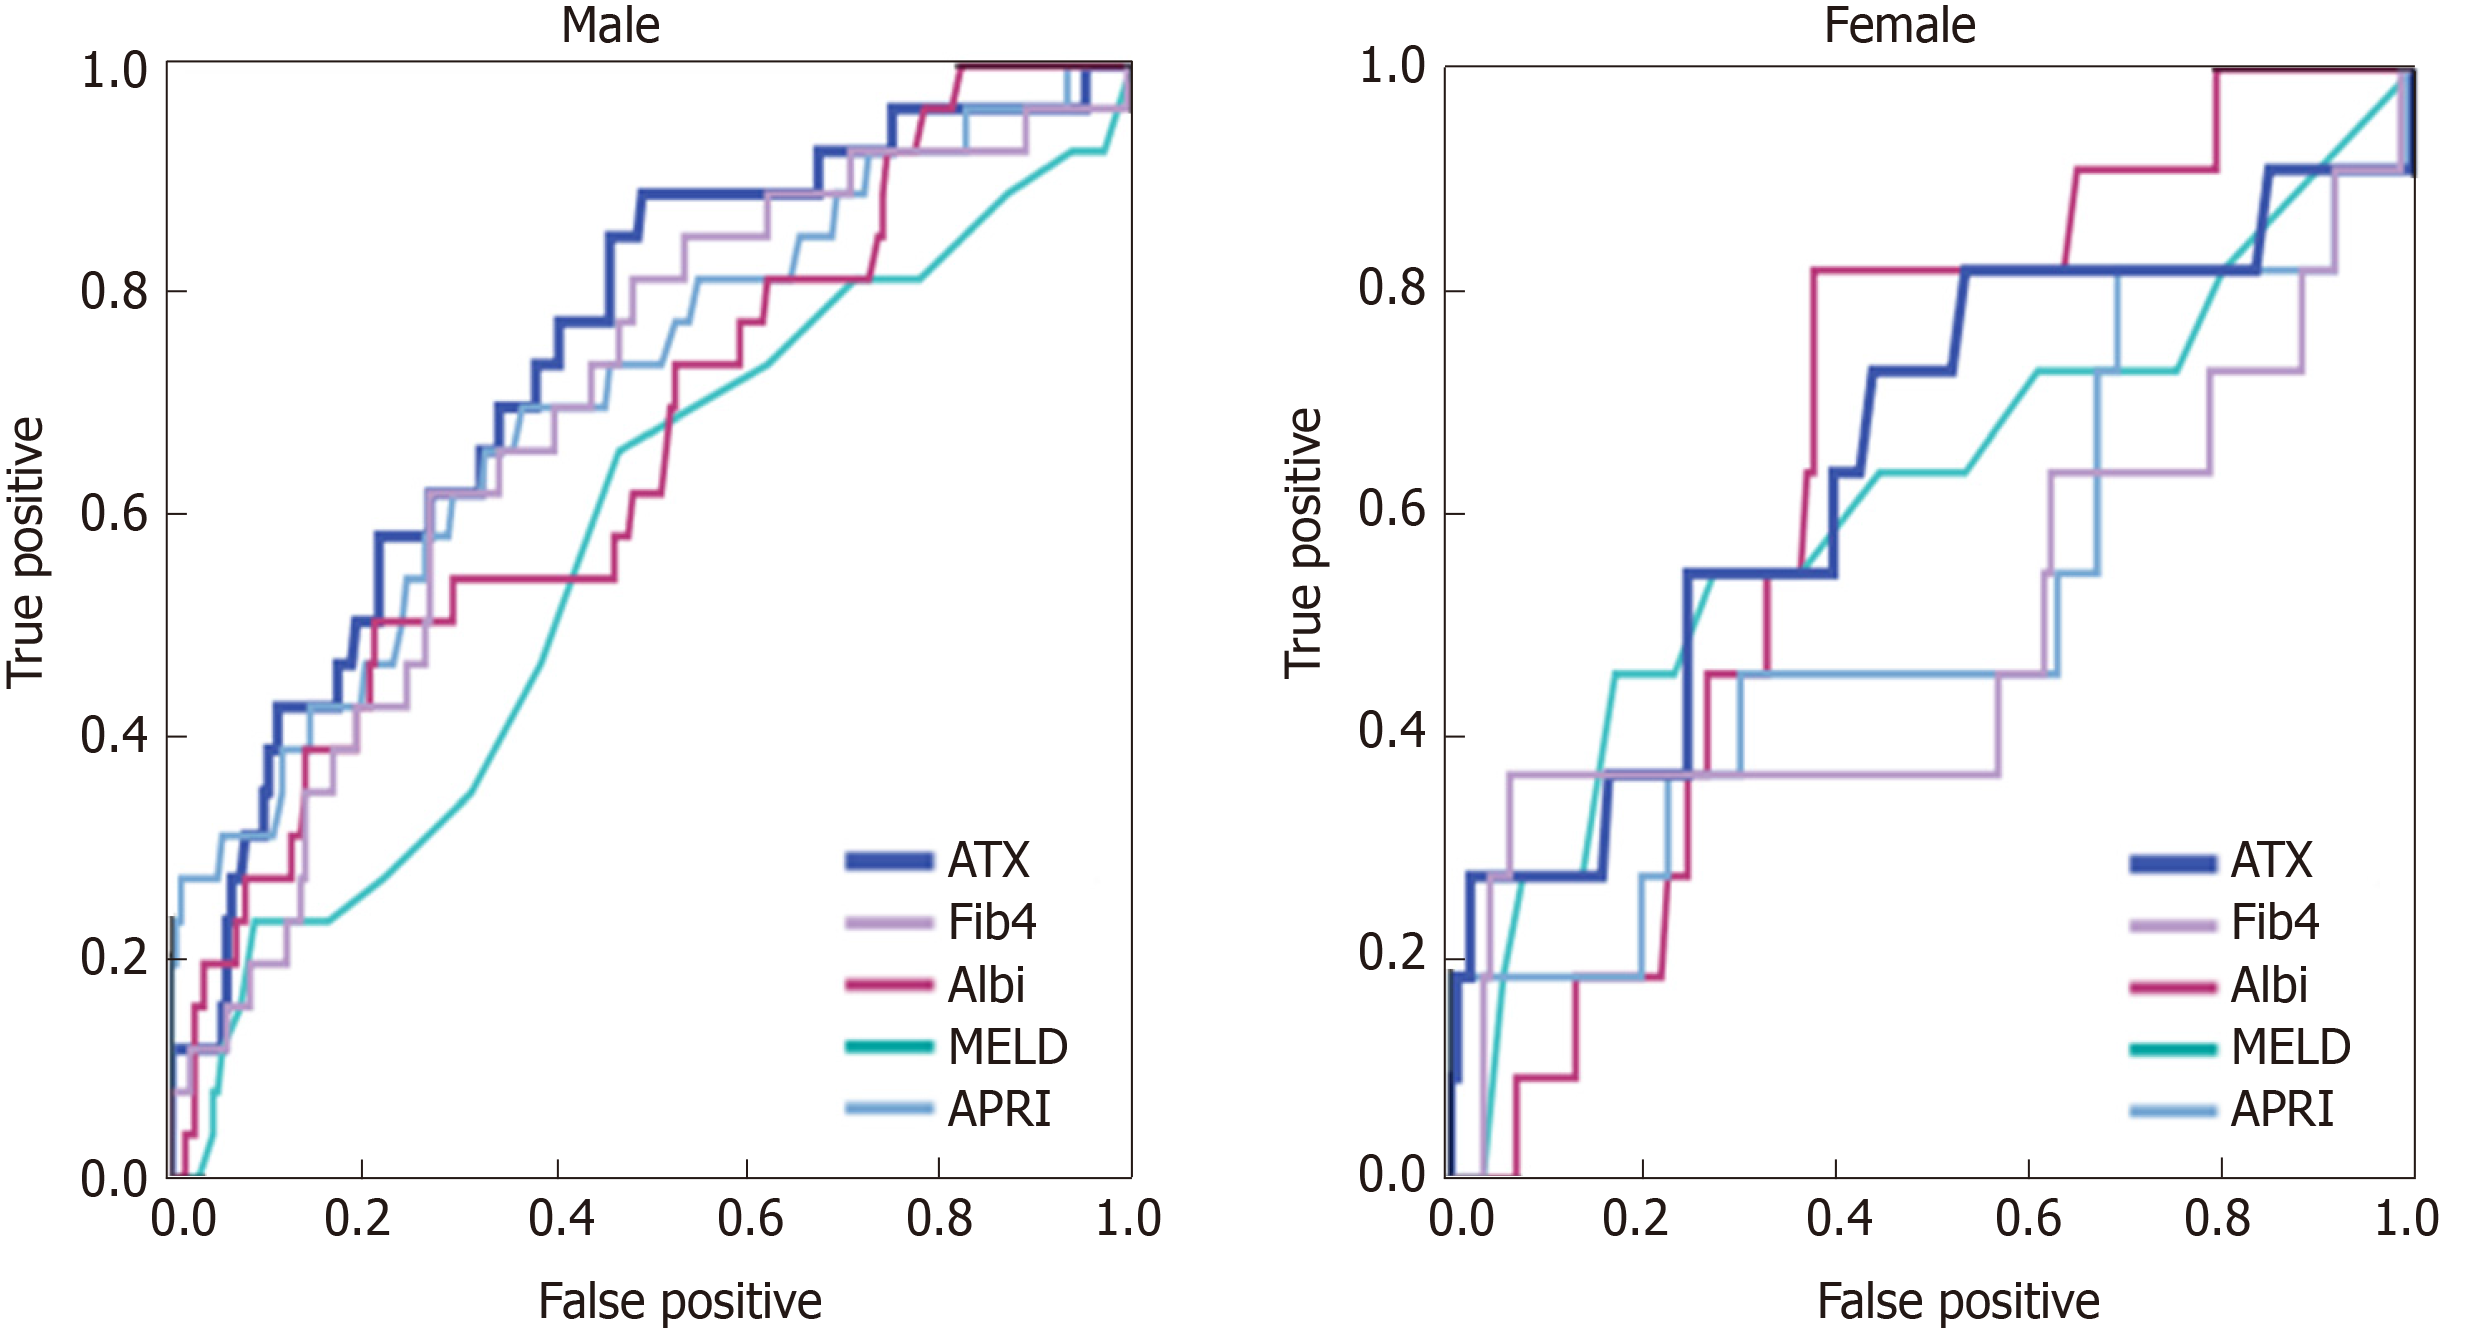
Figure 4 Comparison of autotoxin and serum biomarkers for assessment of varix ruptures by the receiver operating characteristic curve analysis.
The area under the curves of autotaxin in men were higher than those in women and all the other biomarkers for detecting varix ruptures. ATX: Autotaxin; Fib-4: Fibrosis-4; ALBI: Albumin-bilirubin index; MELD: Model for end-stage liver disease; APRI: Aspartate aminotransferase-to-platelet ratio index.
- Citation: Shao X, Uojima H, Setsu T, Okubo T, Atsukawa M, Furuichi Y, Arase Y, Hidaka H, Tanaka Y, Nakazawa T, Kako M, Kagawa T, Iwakiri K, Terai S, Koizumi W. Usefulness of autotaxin for the complications of liver cirrhosis. World J Gastroenterol 2020; 26(1): 97-108
- URL: https://www.wjgnet.com/1007-9327/full/v26/i1/97.htm
- DOI: https://dx.doi.org/10.3748/wjg.v26.i1.97


