Copyright
©The Author(s) 2020.
World J Gastroenterol. Jan 7, 2020; 26(1): 11-20
Published online Jan 7, 2020. doi: 10.3748/wjg.v26.i1.11
Published online Jan 7, 2020. doi: 10.3748/wjg.v26.i1.11
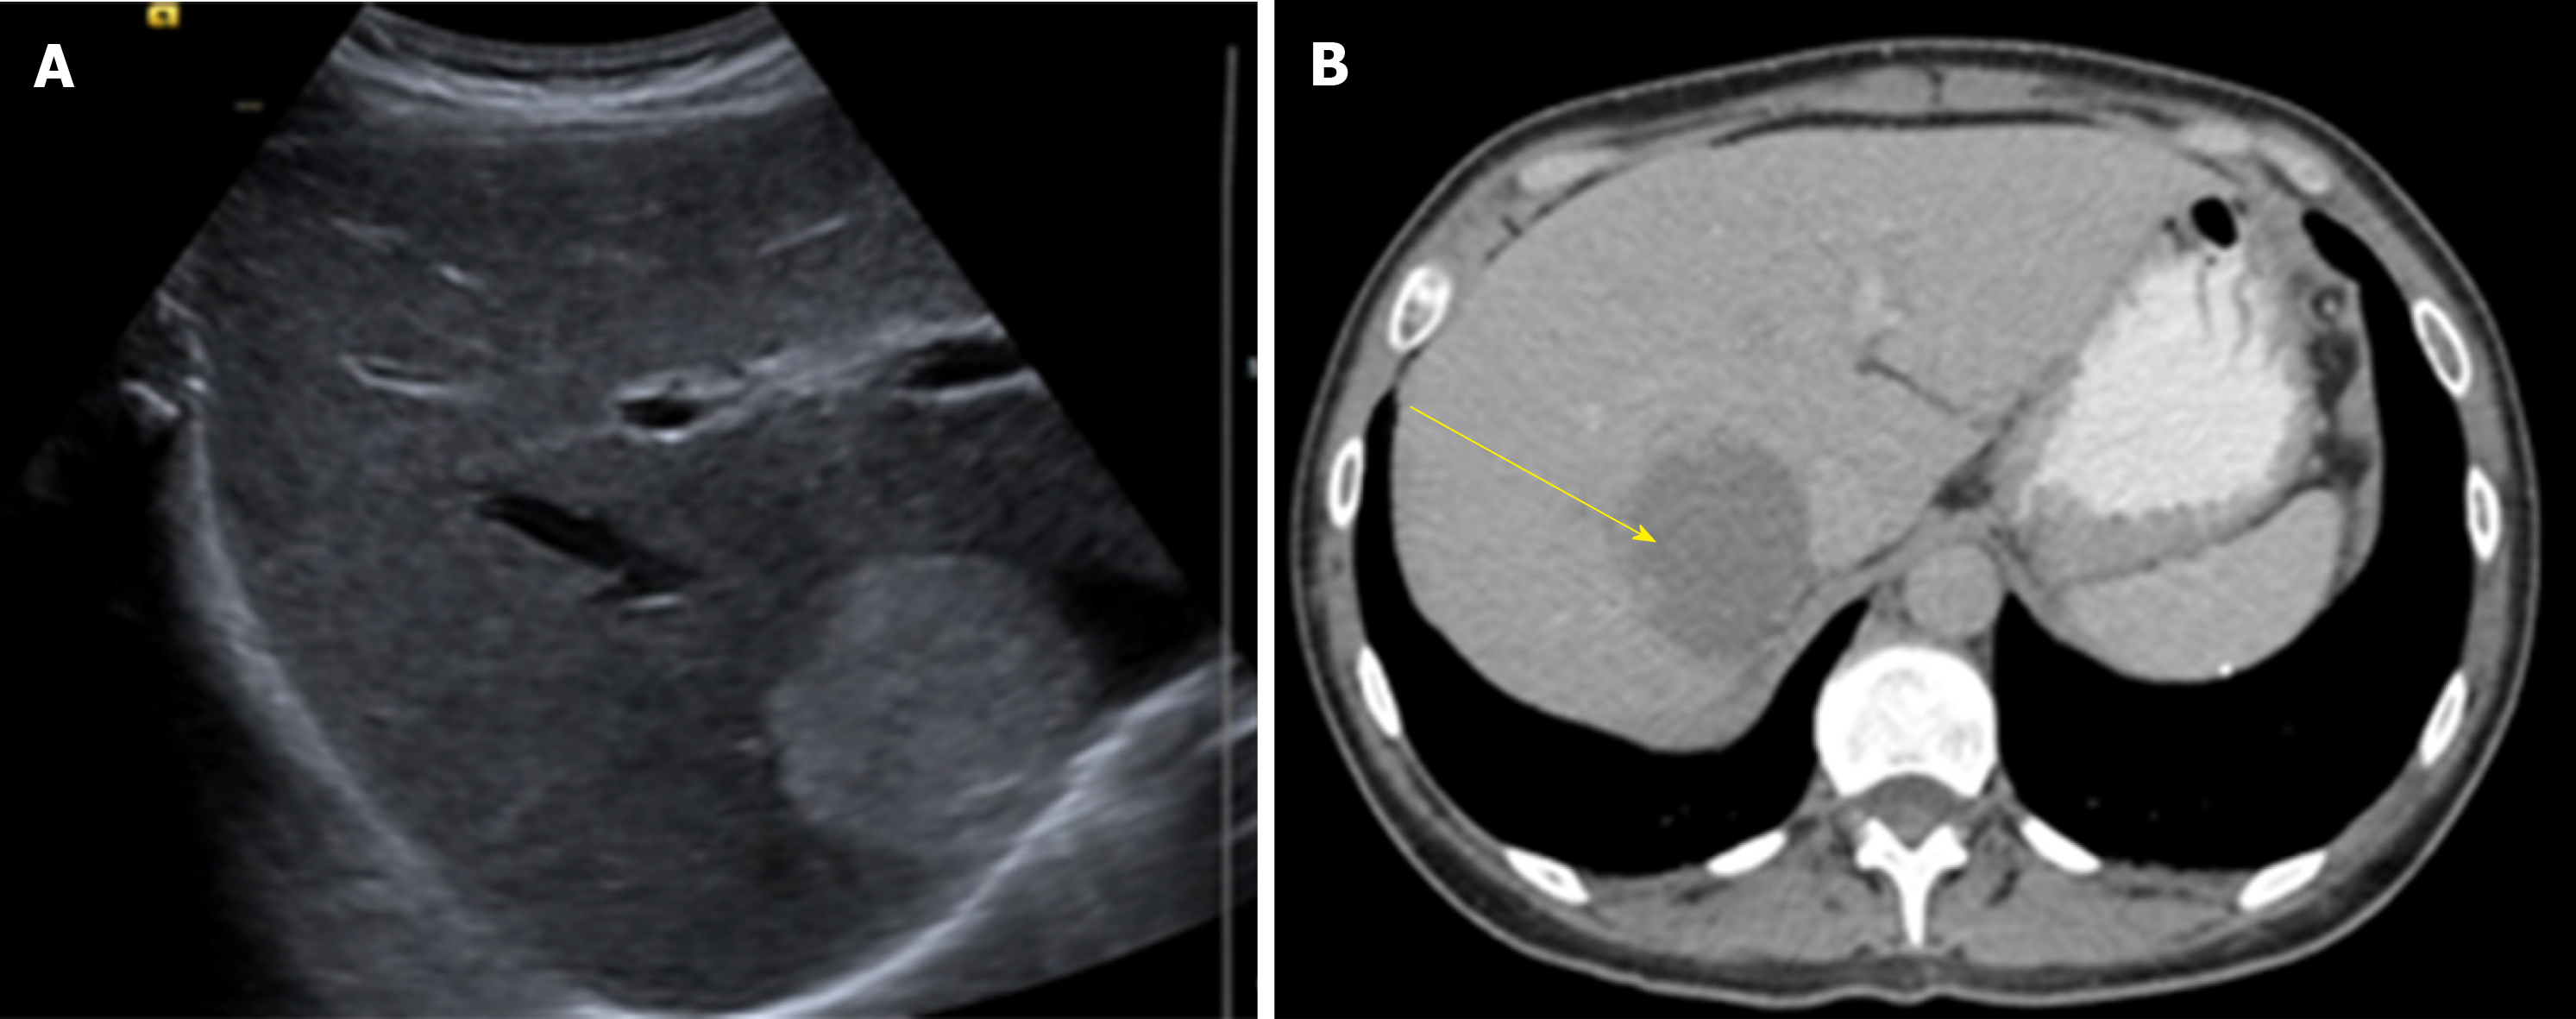
Figure 1 Liver ultrasound and computed tomography abdomen with contrast of a patient with hepatic hemangioma (55 mm × 46 mm).
A: Image of ultrasound; B: Image of computed tomography.
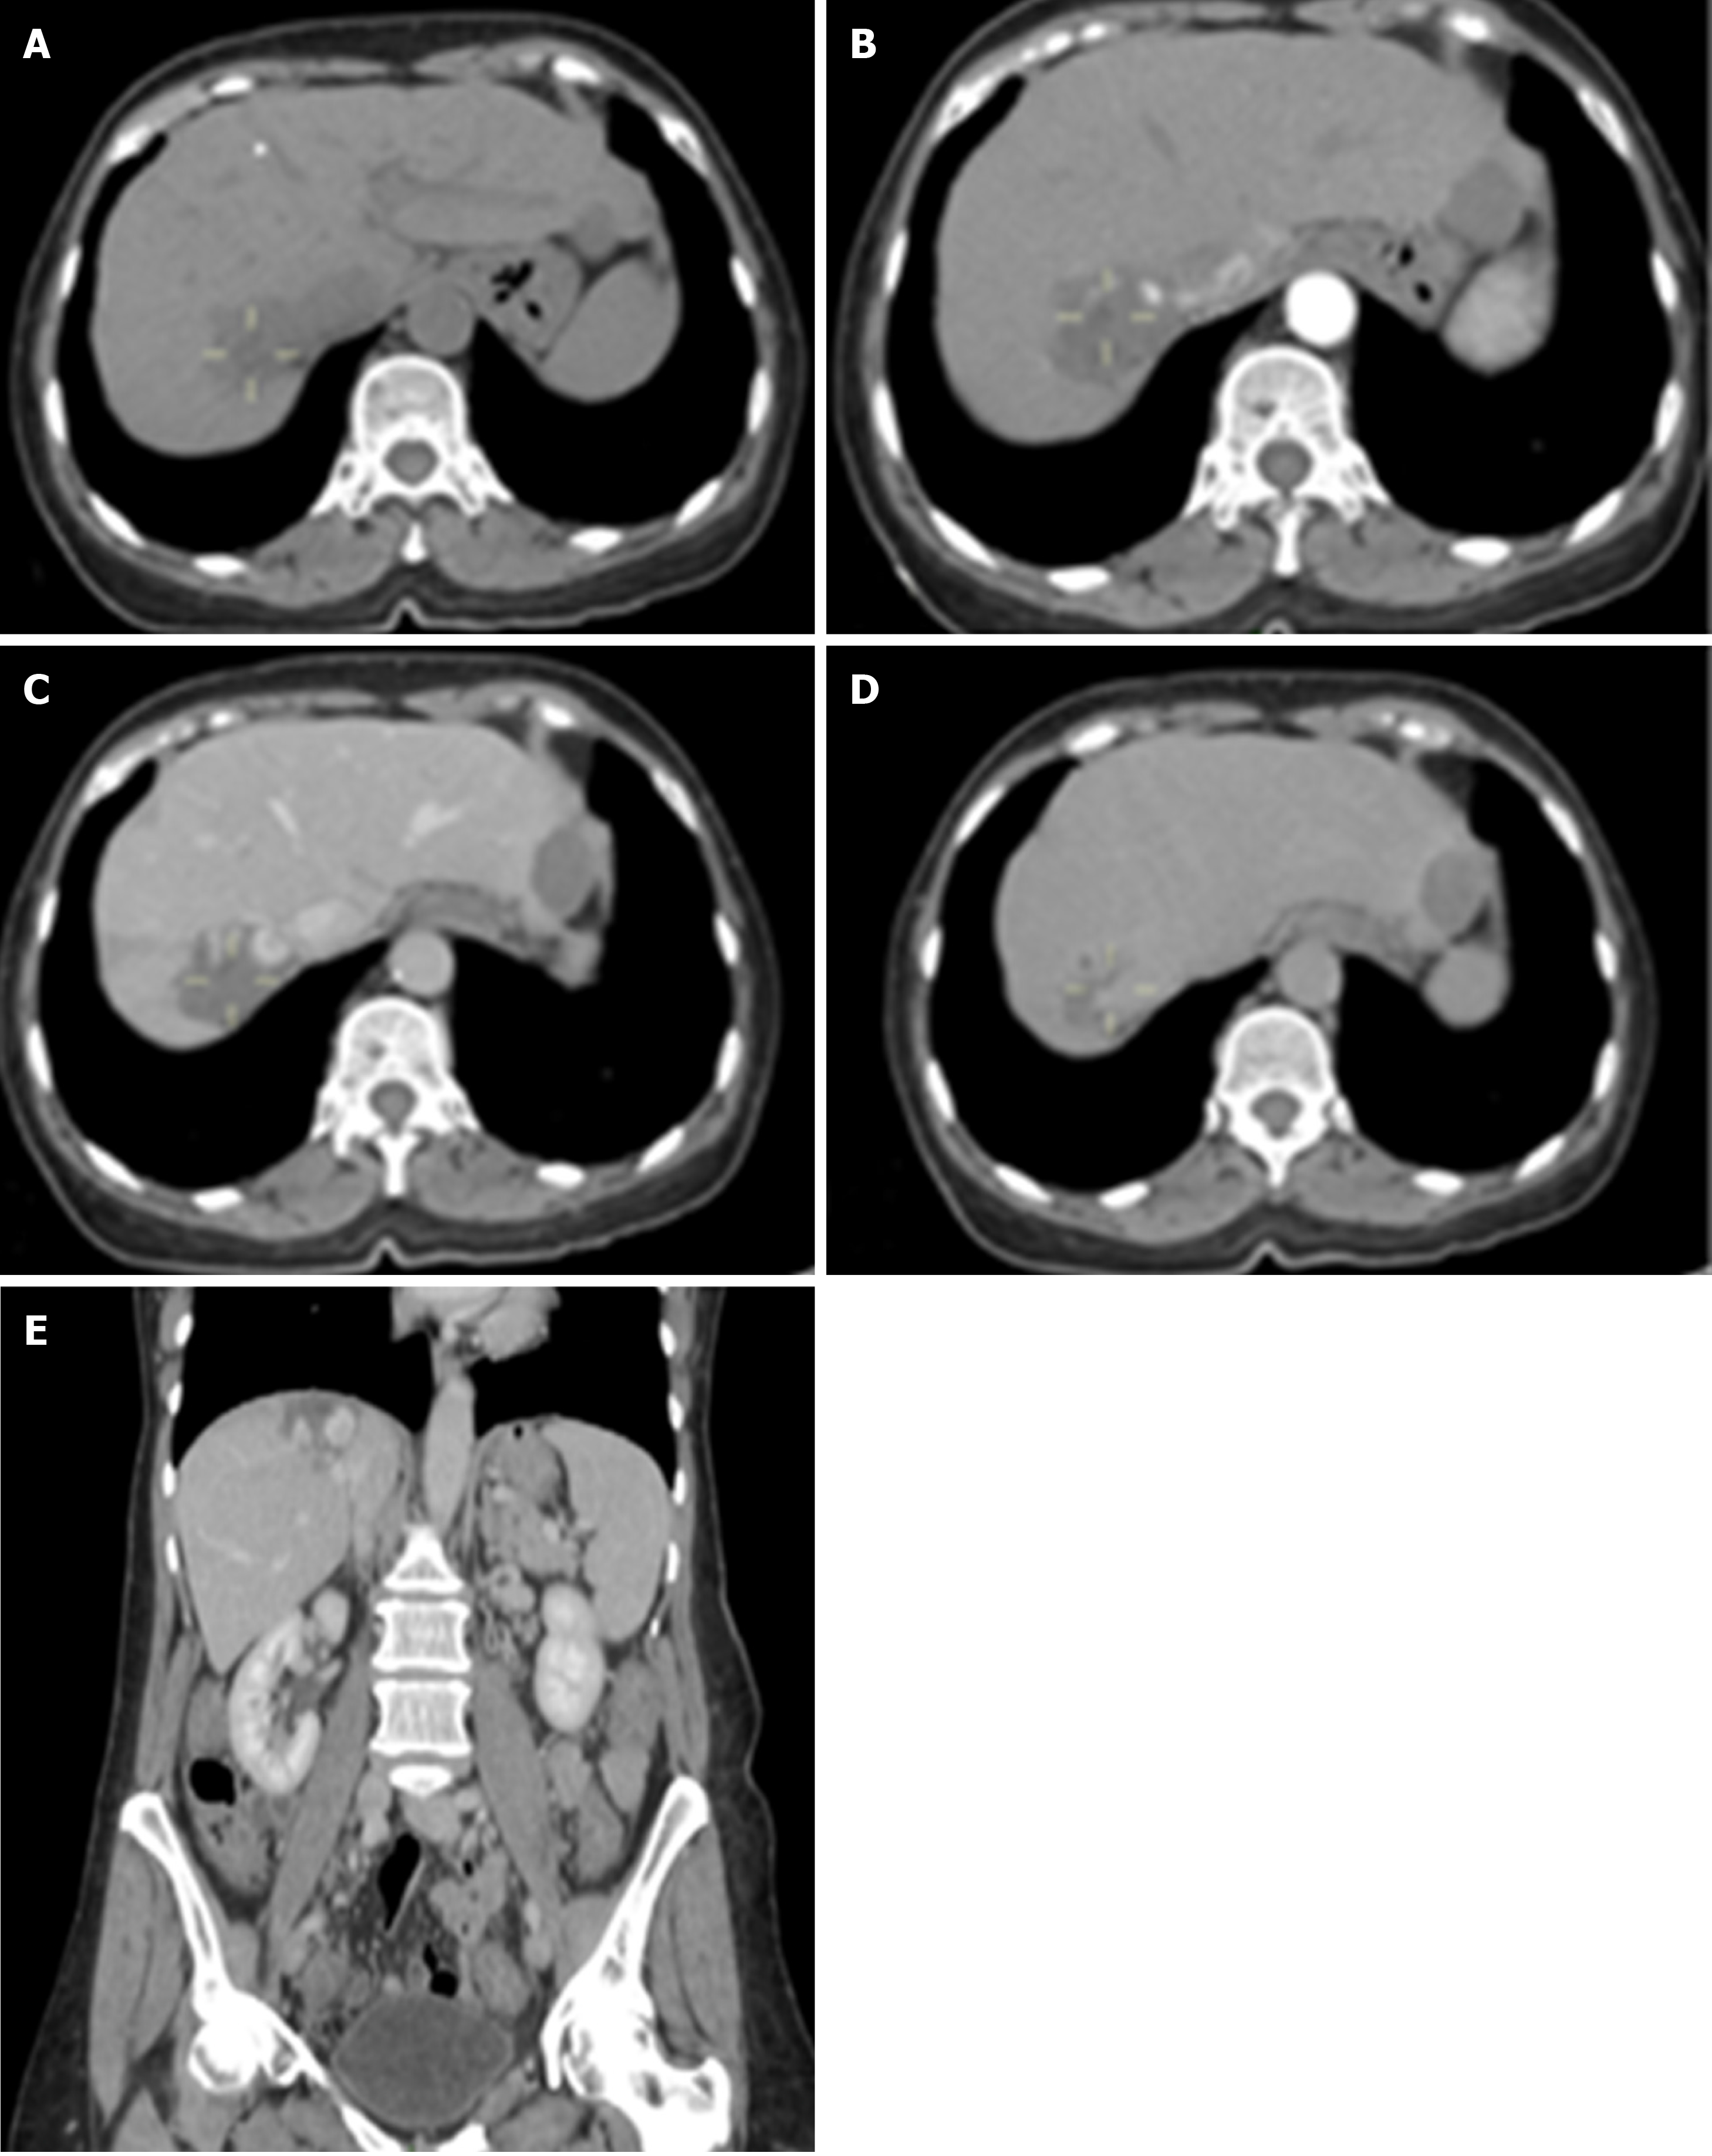
Figure 2 Hepatic hemangioma of 49 mm × 30 mm.
A: Non-contrast phase; B: Arterial phase; C: Venous phase; D: Delayed phase; E: Coronal view of computed tomography scan (venous phase).
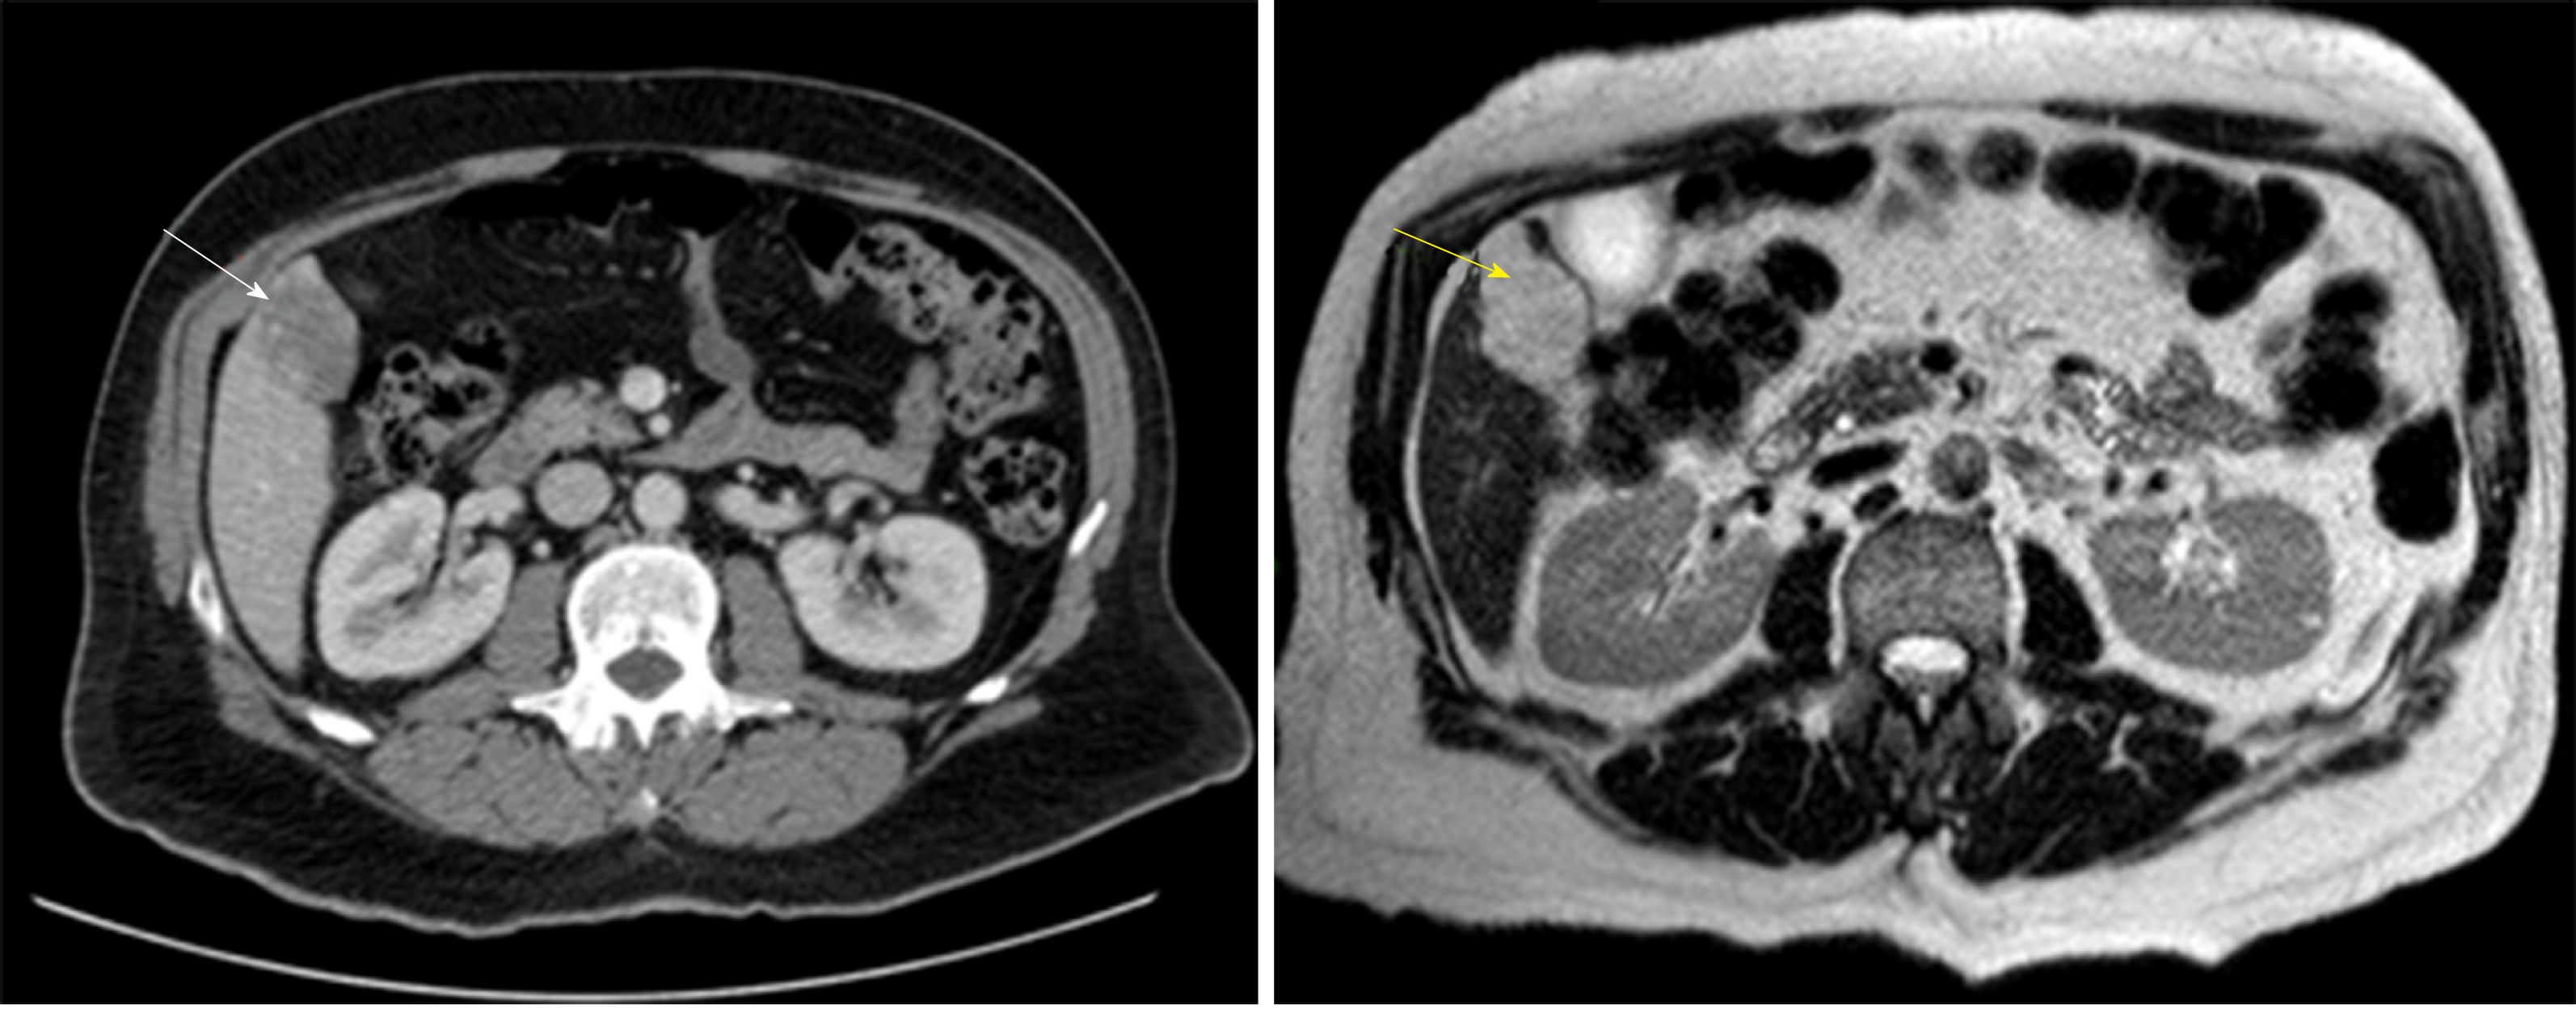
Figure 3 Computed tomography abdomen with contrast (white arrow) and magnetic resonance imaging T2-weighted scan (yellow arrow) with hepatic hemangioma 45 mm × 30 mm.
- Citation: Leon M, Chavez L, Surani S. Hepatic hemangioma: What internists need to know. World J Gastroenterol 2020; 26(1): 11-20
- URL: https://www.wjgnet.com/1007-9327/full/v26/i1/11.htm
- DOI: https://dx.doi.org/10.3748/wjg.v26.i1.11


