Copyright
©The Author(s) 2019.
World J Gastroenterol. Feb 28, 2019; 25(8): 941-954
Published online Feb 28, 2019. doi: 10.3748/wjg.v25.i8.941
Published online Feb 28, 2019. doi: 10.3748/wjg.v25.i8.941
Figure 1 Dynamic changes in serum biochemical parameters during the process of fibrosis.
A: Albumin, total protein, and globulin; B: Alanine aminotransferase, aspartate aminotransferase, and alkaline phosphatase; C: Bile acid, total bilirubin, and creatinine. ALB: Albumin; TP: Total protein; GLO: Globulin; ALT: Alanine aminotransferase; AST: Aspartate aminotransferase; AKP: Alkaline phosphatase; BA: Bile acid; TBIL: Total bilirubin; CR: Creatinine.
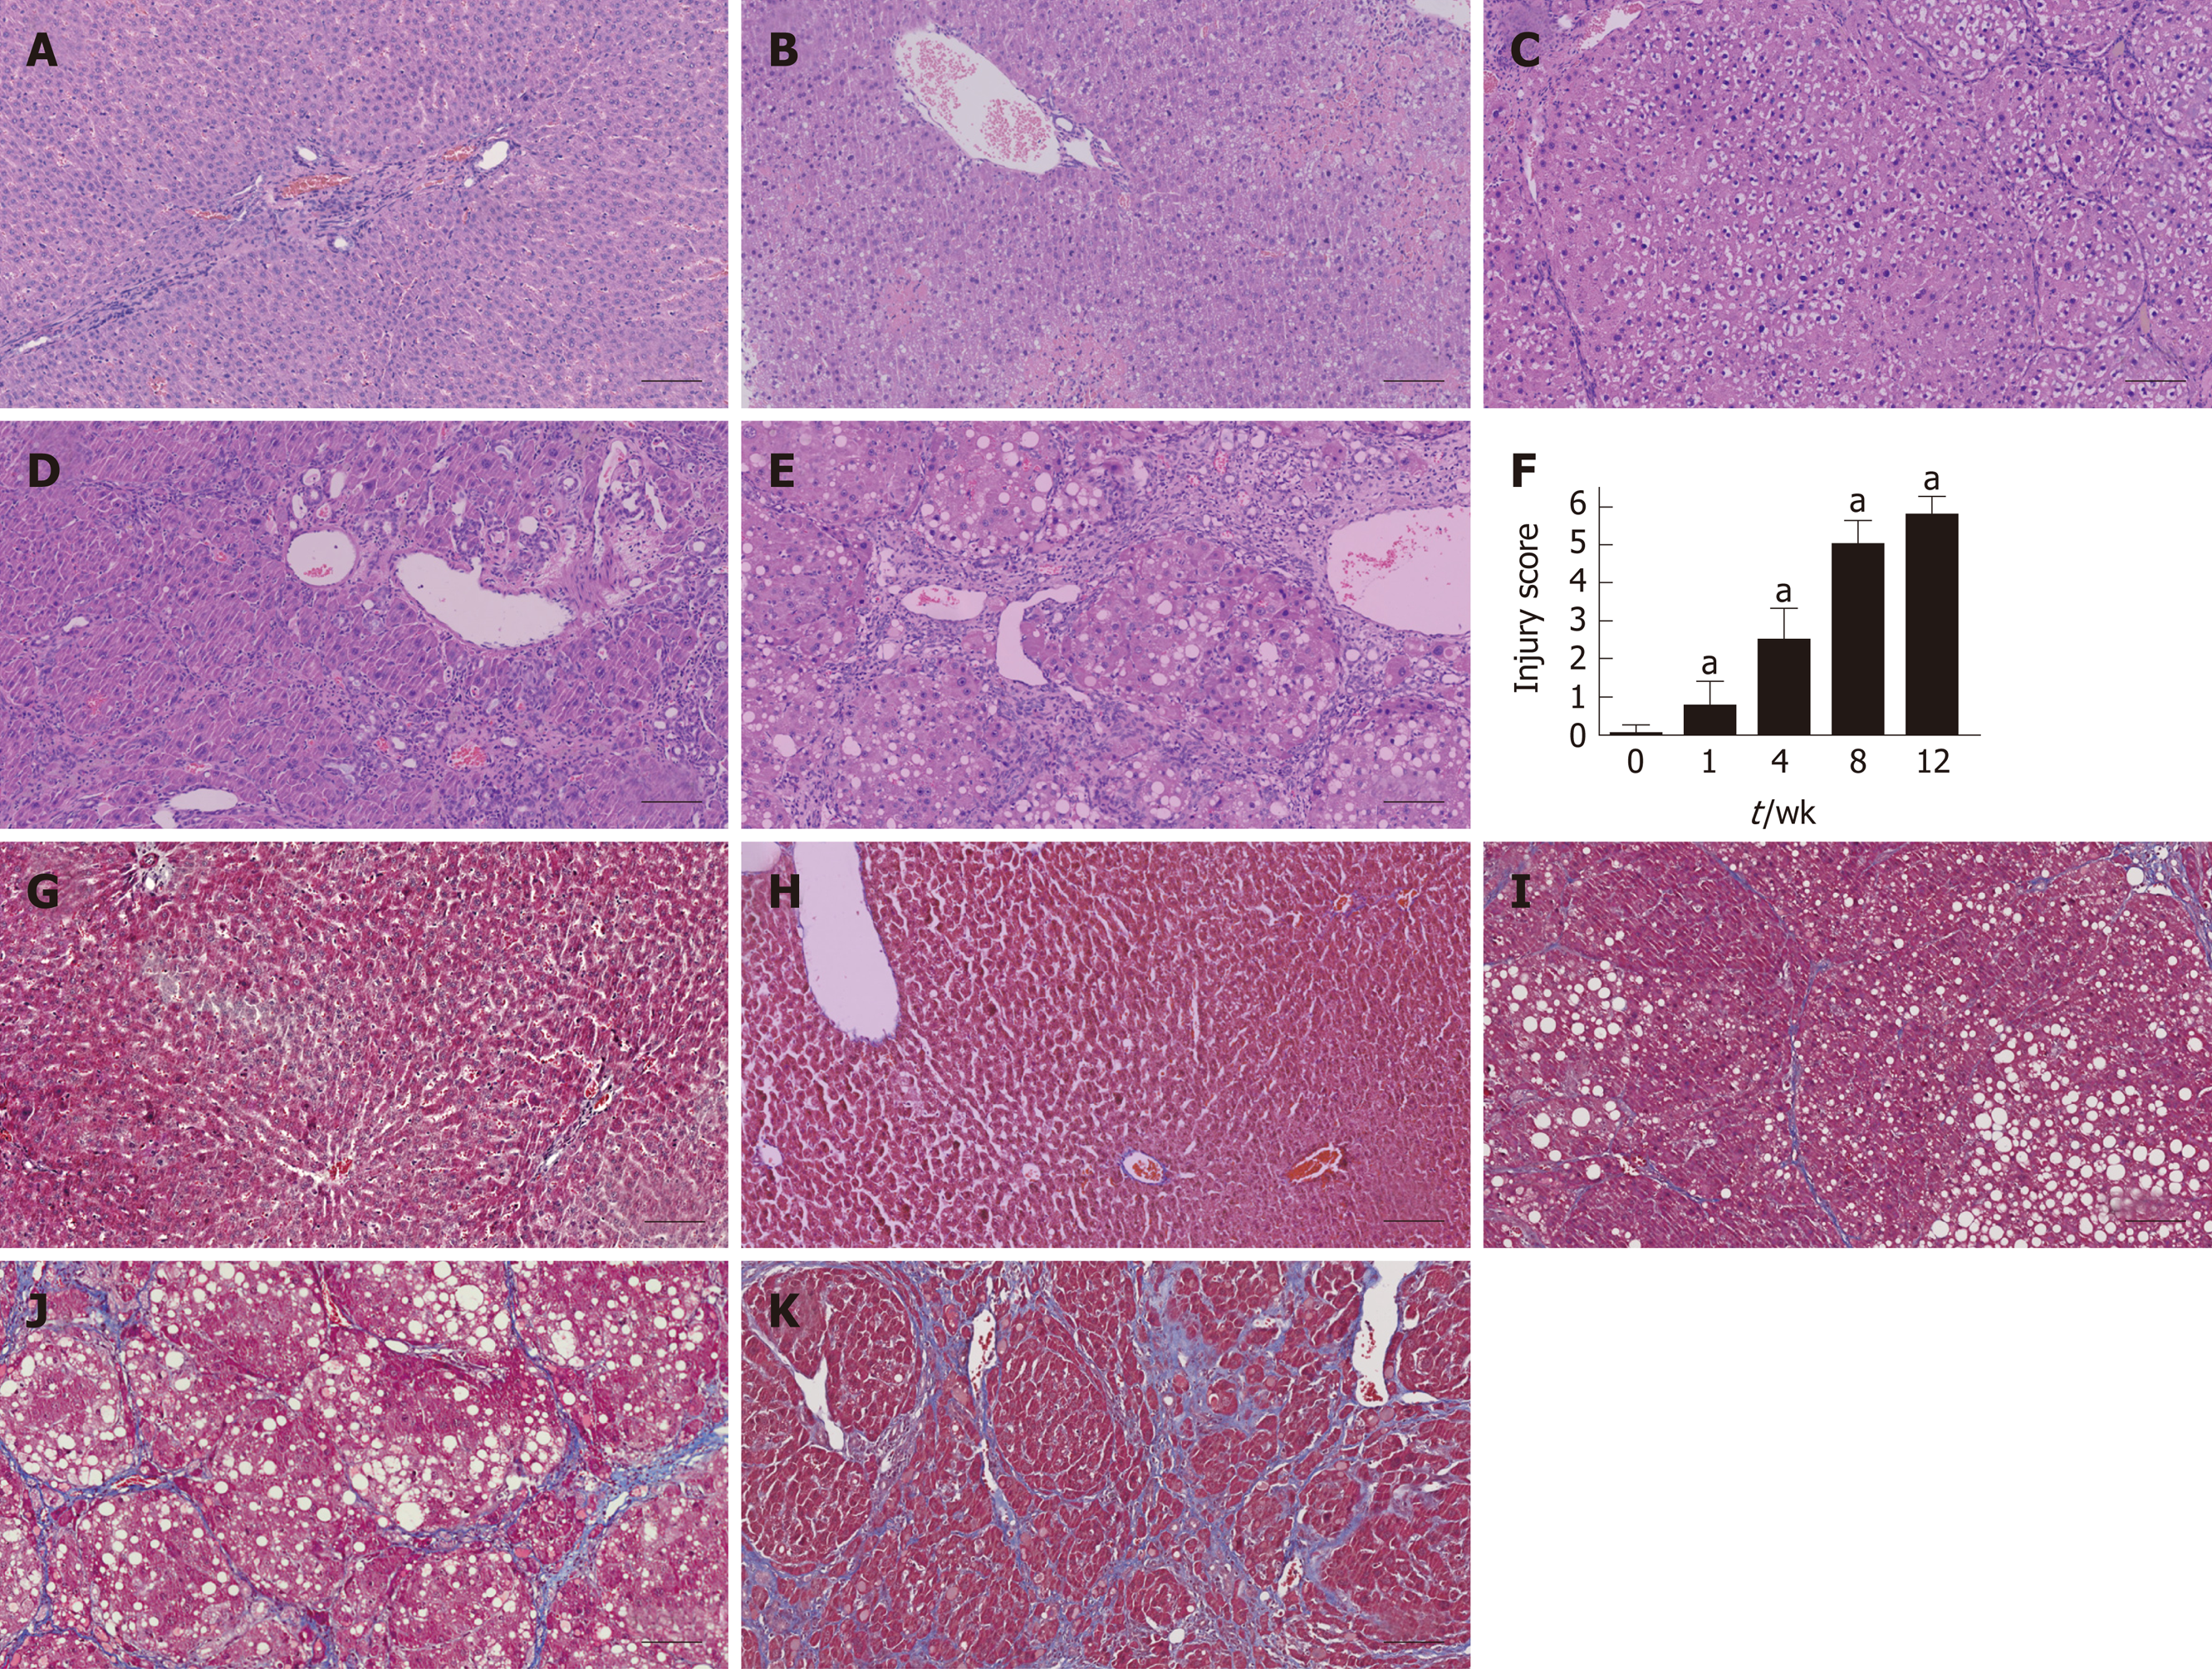
Figure 2 Histological assessment in each group using hematoxylin and eosin and Masson’s trichrome staining.
A-E: Liver tissues were stained with HE in the control and fibrosis model groups at weeks 1, 4, 8, and 12; F: The injury score of fibrosis in each group; G-K: Liver tissues were stained using MTC in the control and fibrosis model groups at weeks 1, 4, 8, and 12 (aP < 0.01 vs control). Scale bars: 100 μm. HE: Hematoxylin and eosin; MTC: Masson’s trichrome.
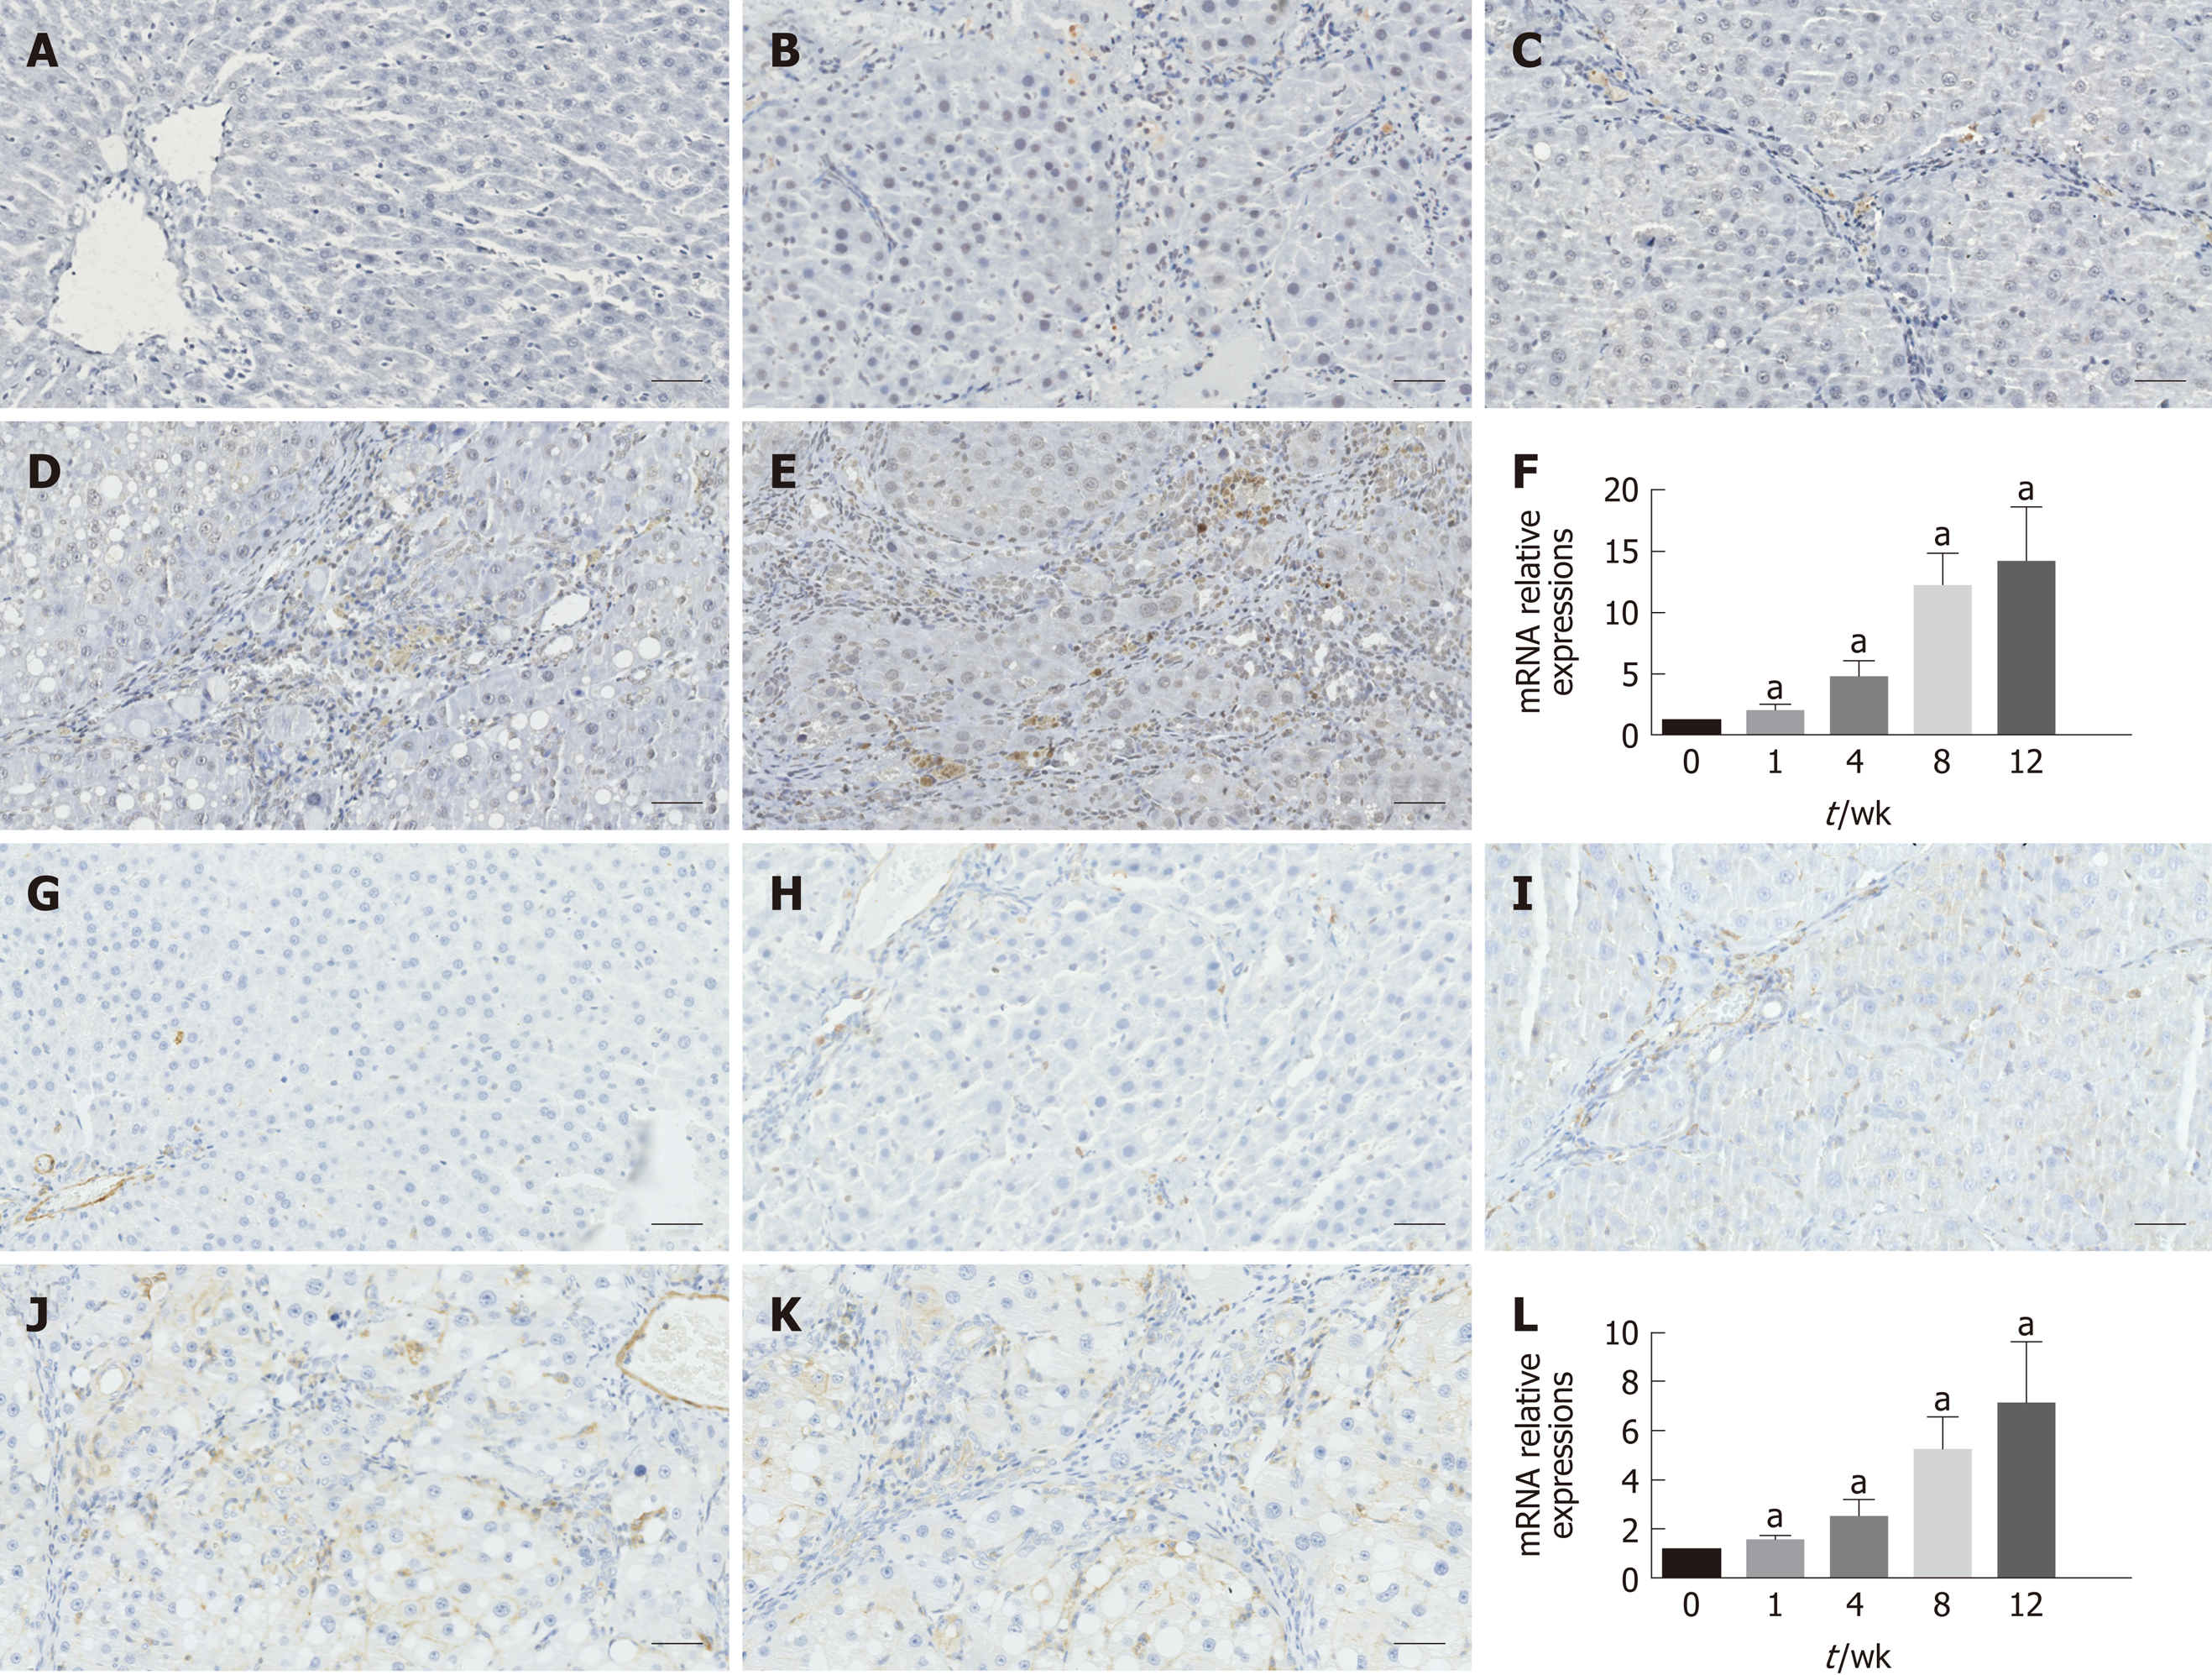
Figure 3 Immunohistochemistry results and relative mRNA expression levels of α-smooth muscle actin and transforming growth factor β1.
A-E: Immunohistochemical staining for α-SMA; F: qRT-PCR results of α-SMA at each time point; G-K: Immunohistochemical staining for TGF-β1; L: qRT-PCR results of TGF-β1 at each time point. The data are presented as the mean ± SD (error bars) and were statistically analyzed using a Student’s t-test. aP < 0.01 vs control. Scale bars: 100 μm. α-SMA: α-smooth muscle actin; TGF-β1: Transforming growth factor-β1; qRT-PCR: Quantitative real-time polymerase chain reaction.
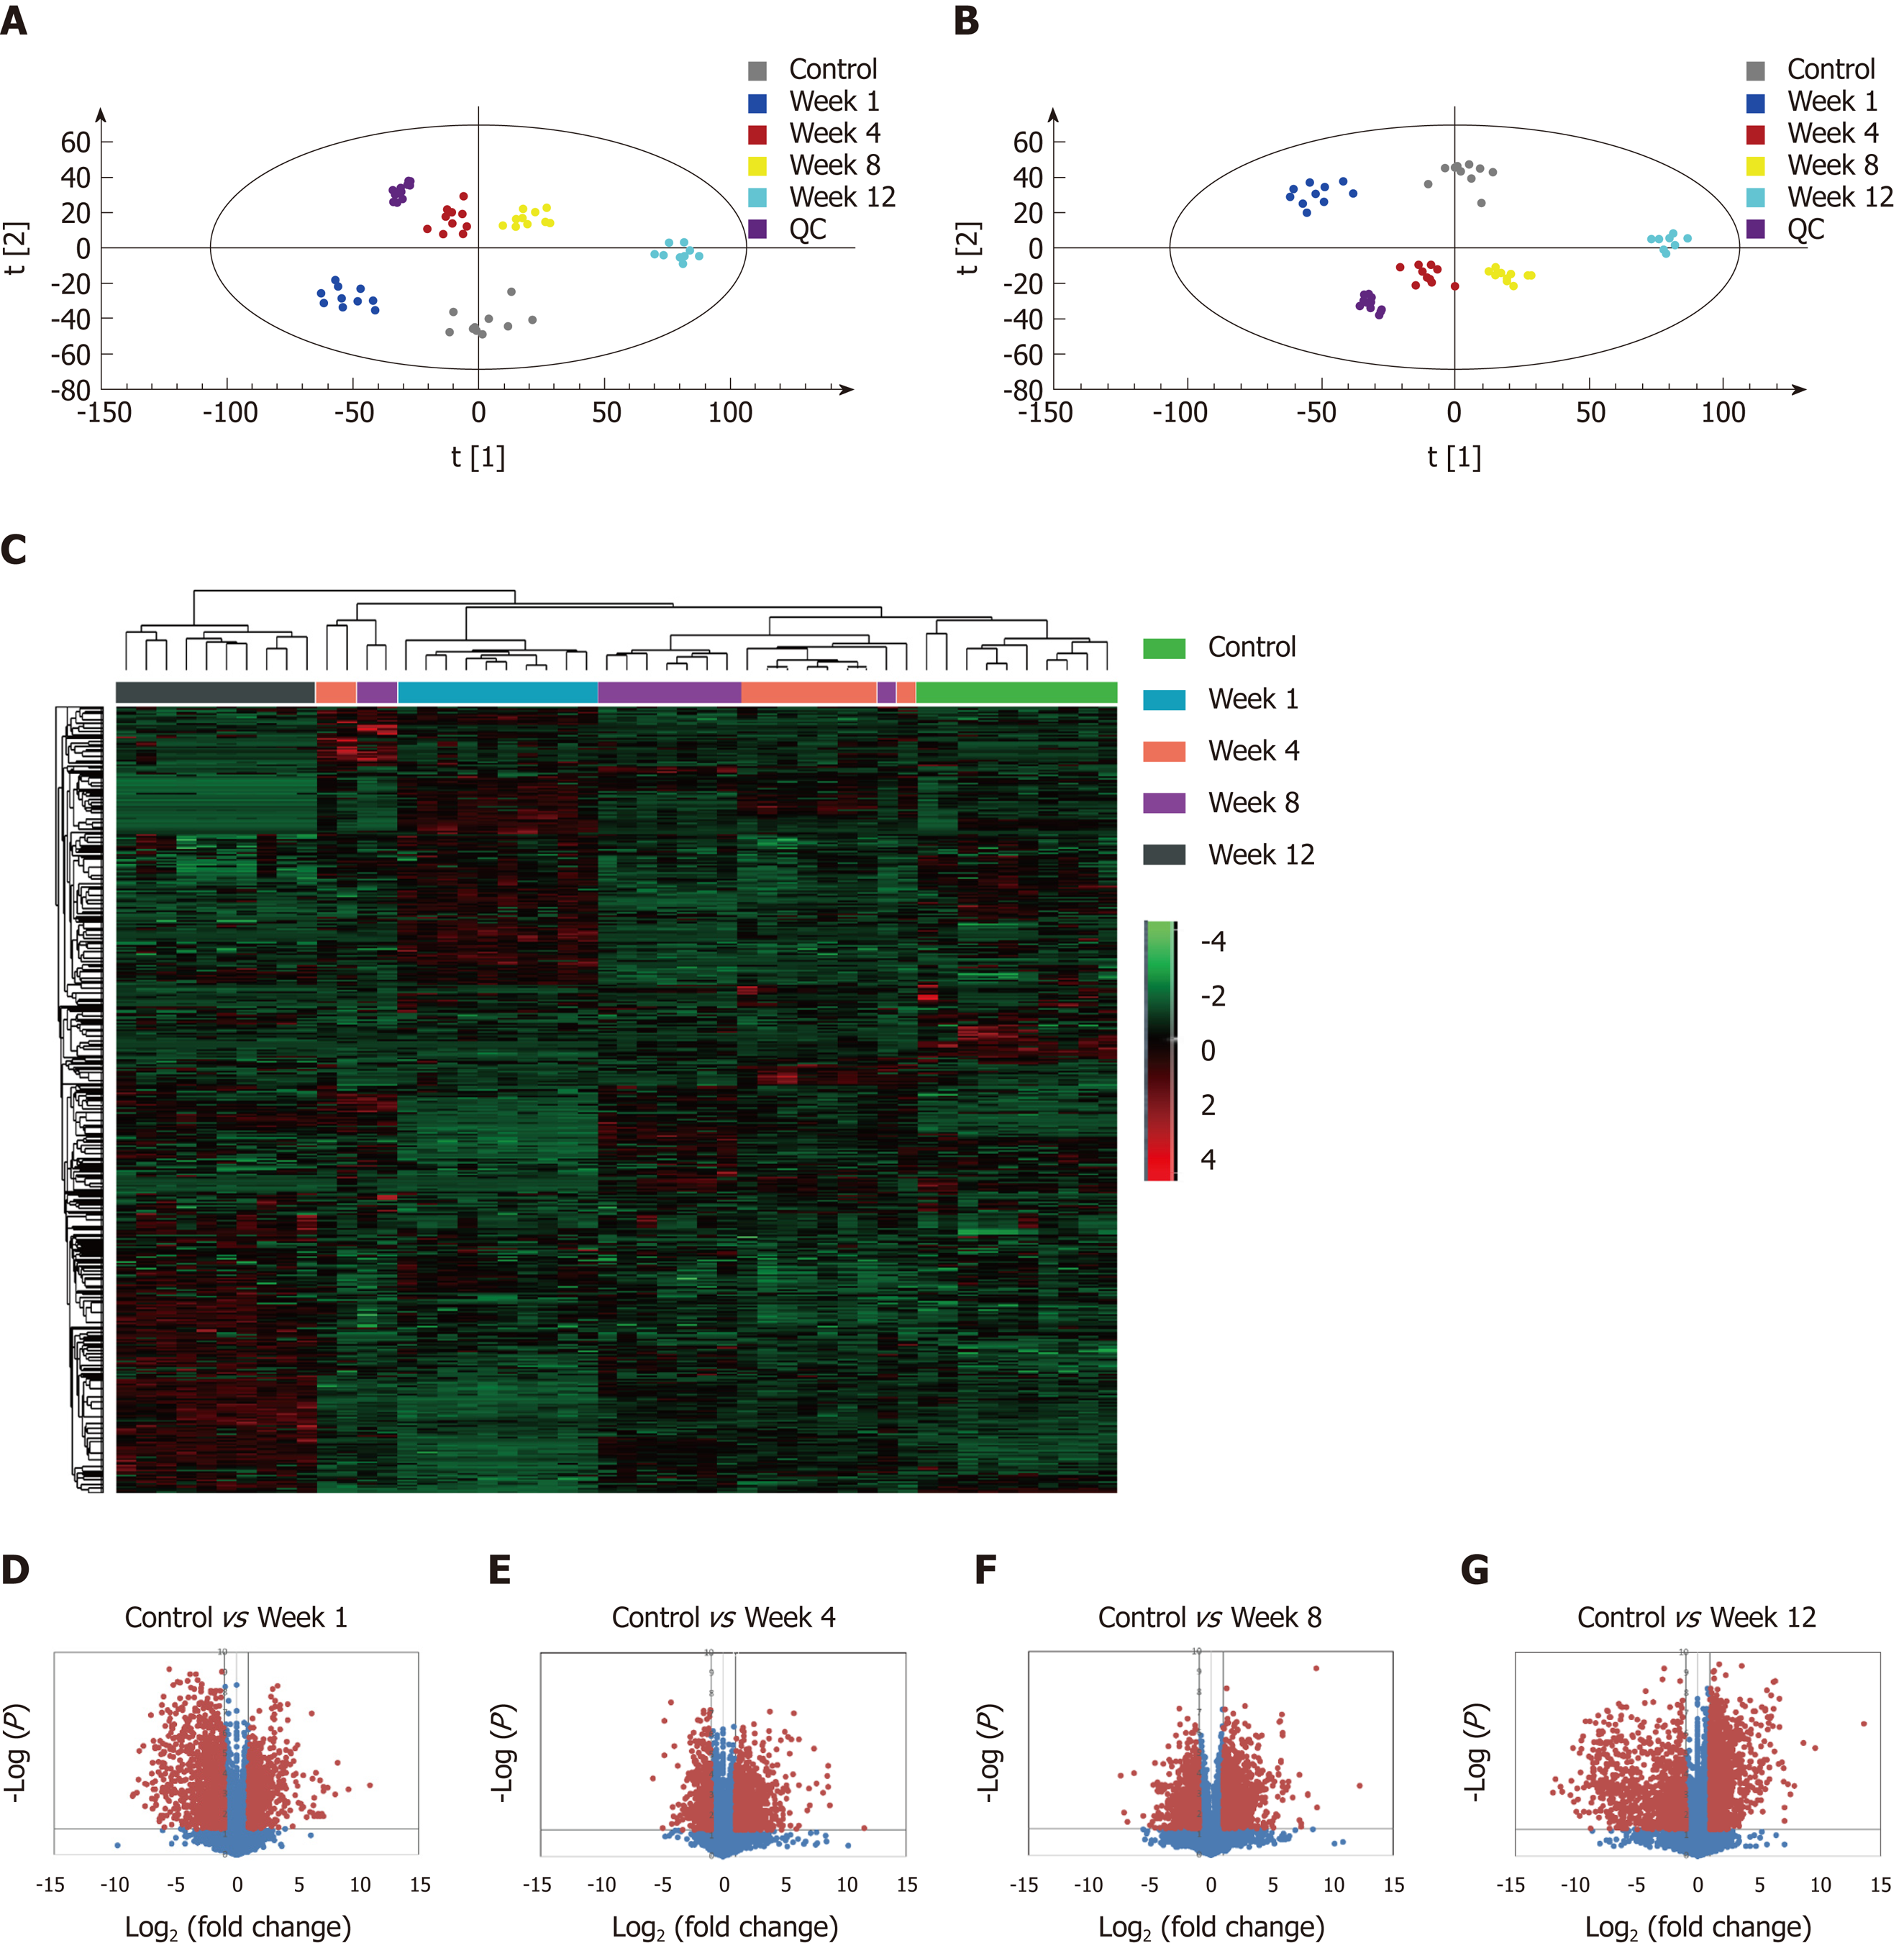
Figure 4 Metabolomic profiling and flux analyses.
A: Principle component analysis for the control and fibrosis model groups at weeks 1, 4, 8, and 12; B: Orthogonal partial least squares discriminant analysis score plots for the control and fibrosis model groups at weeks 1, 4, 8, and 12; C: Heat map generated from the liquid chromatography-mass spectrometry data using the hierarchical clustering algorithm; D-G: Volcano plot analyses were used to determine the significant metabolites in the fibrosis model groups compared to controls at weeks 1, 4, 8, and 12. Data points with fold changes > 2 and P < 0.05 are labeled in red.
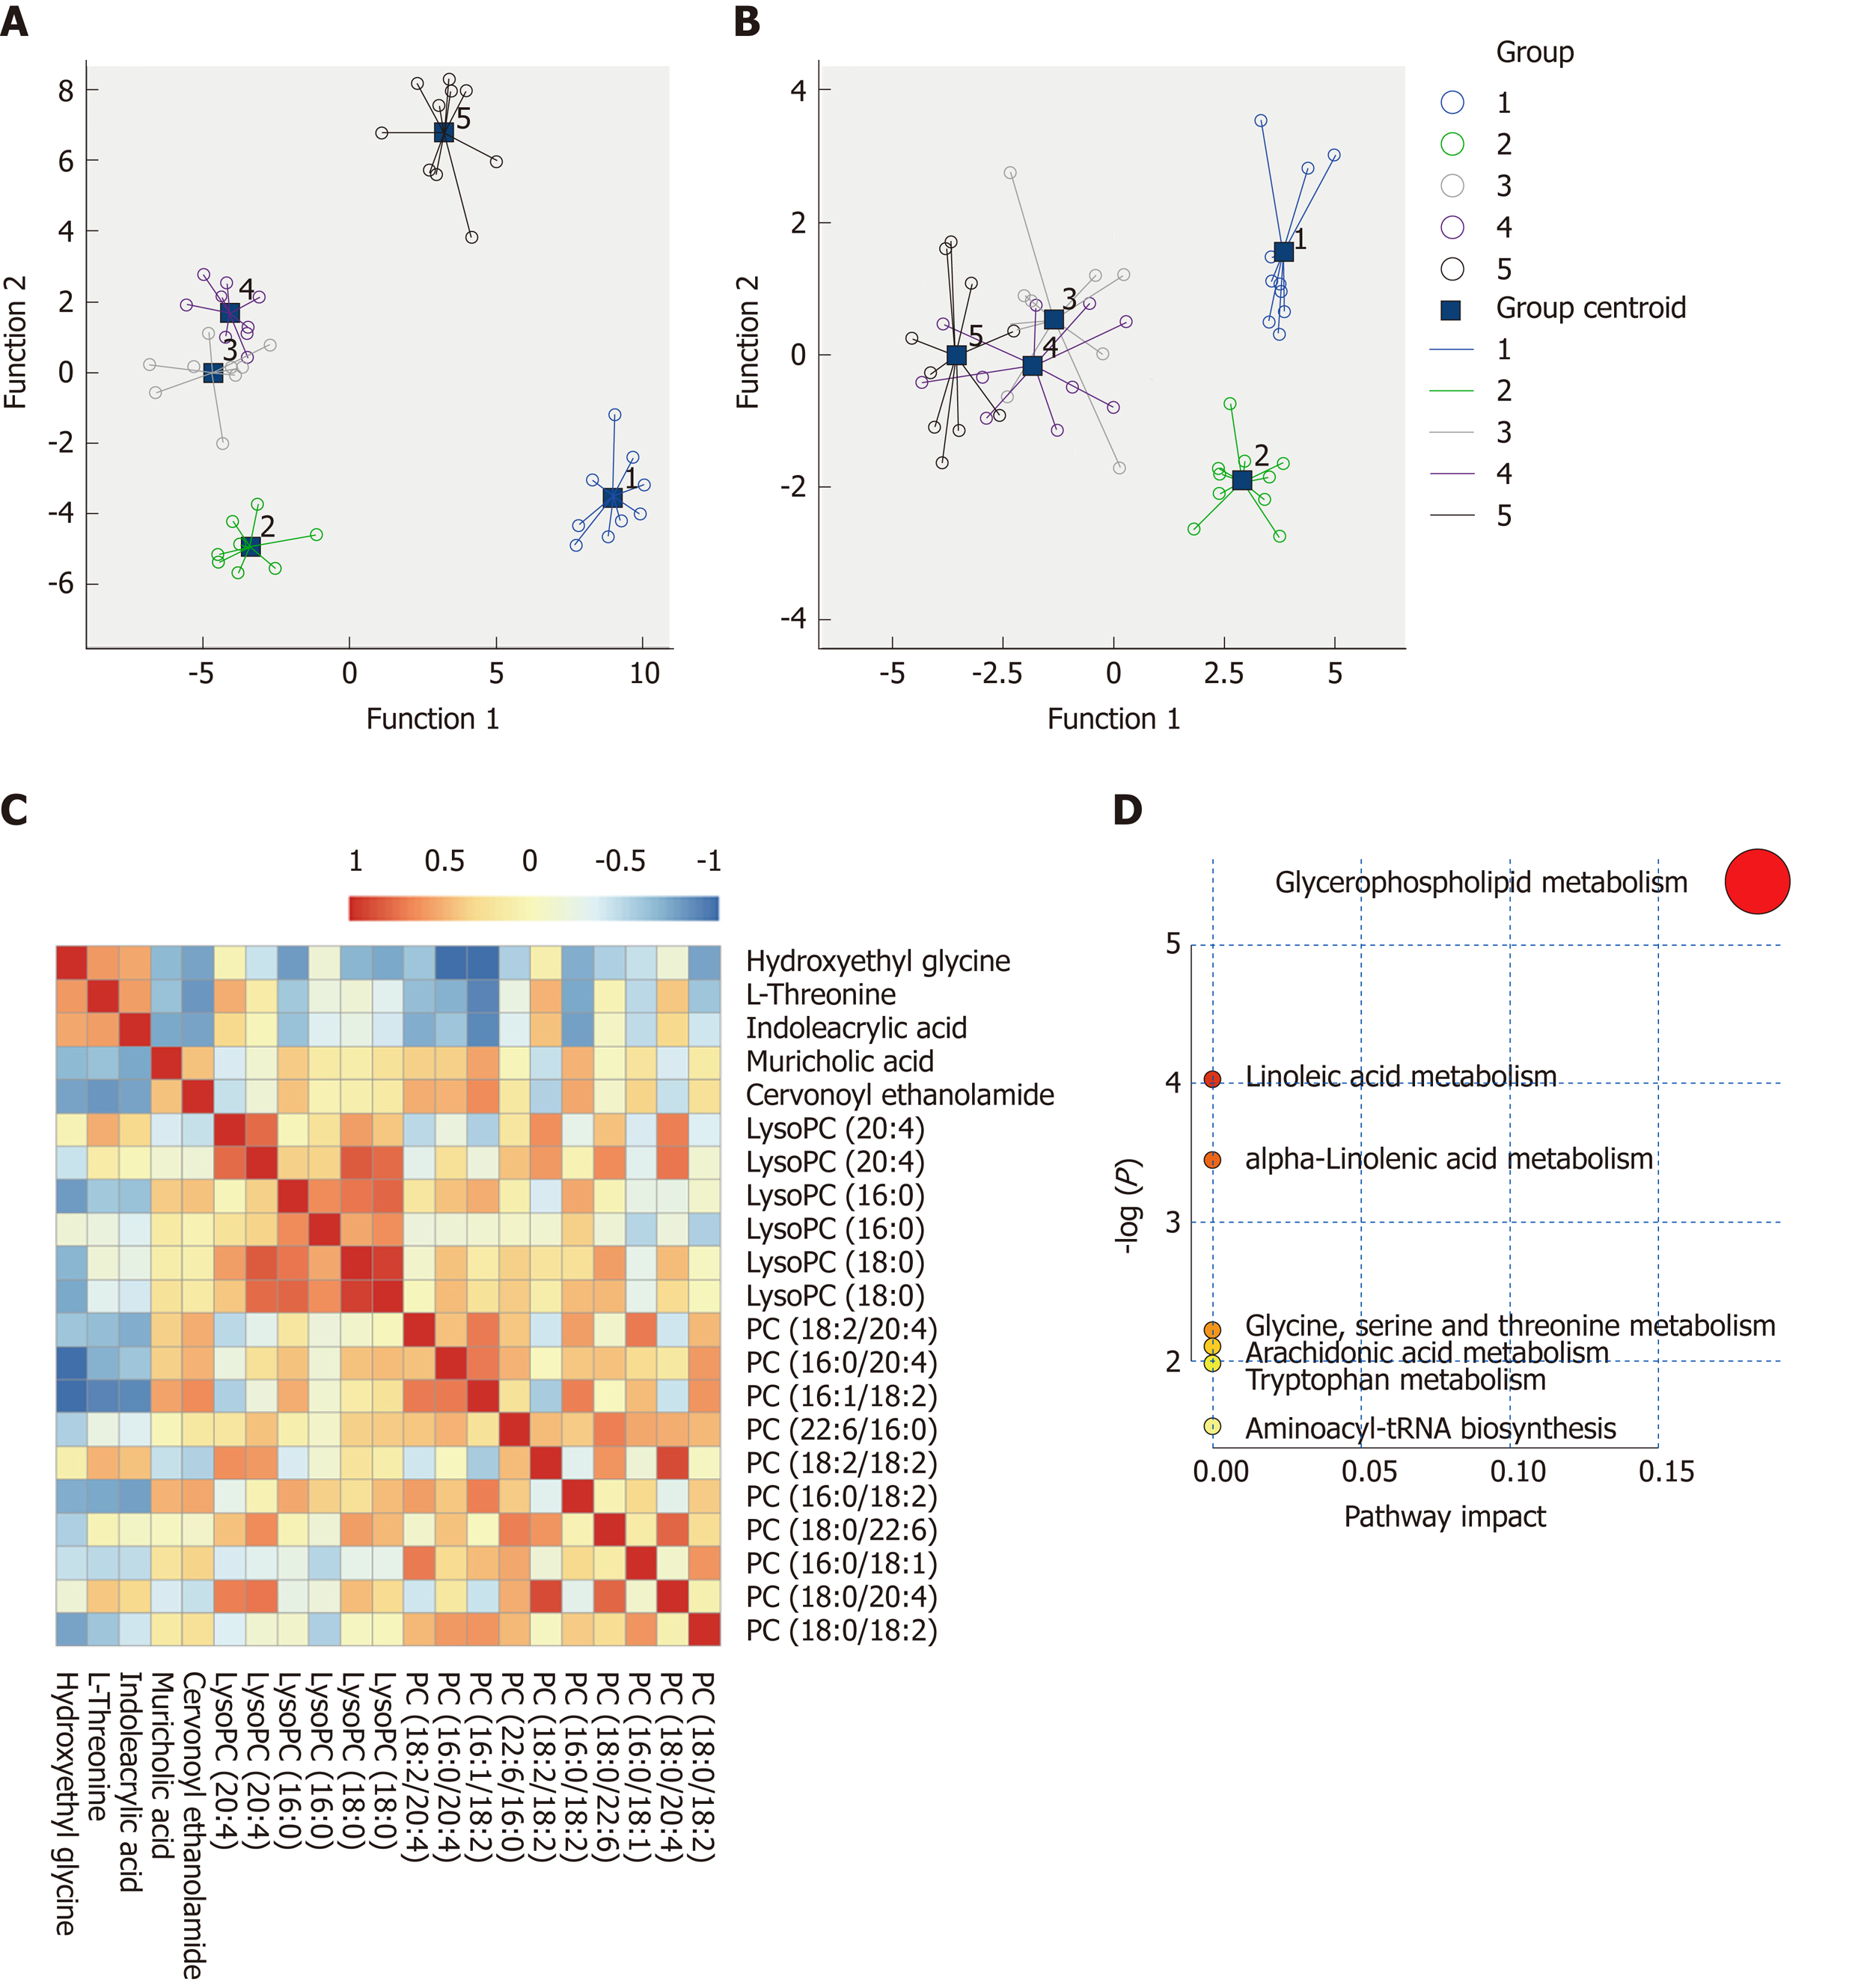
Figure 5 Metabolite quantification and identification.
A and B: Scatter plots of discriminant analyses in five groups based on metabolic profiles and biochemical parameters; C: Correlation analyses of the metabolic profiles. The color saturation of red and blue represents positive and negative correlation coefficients, respectively, between markers; D: Overview of pathway analyses based on selected metabolites.
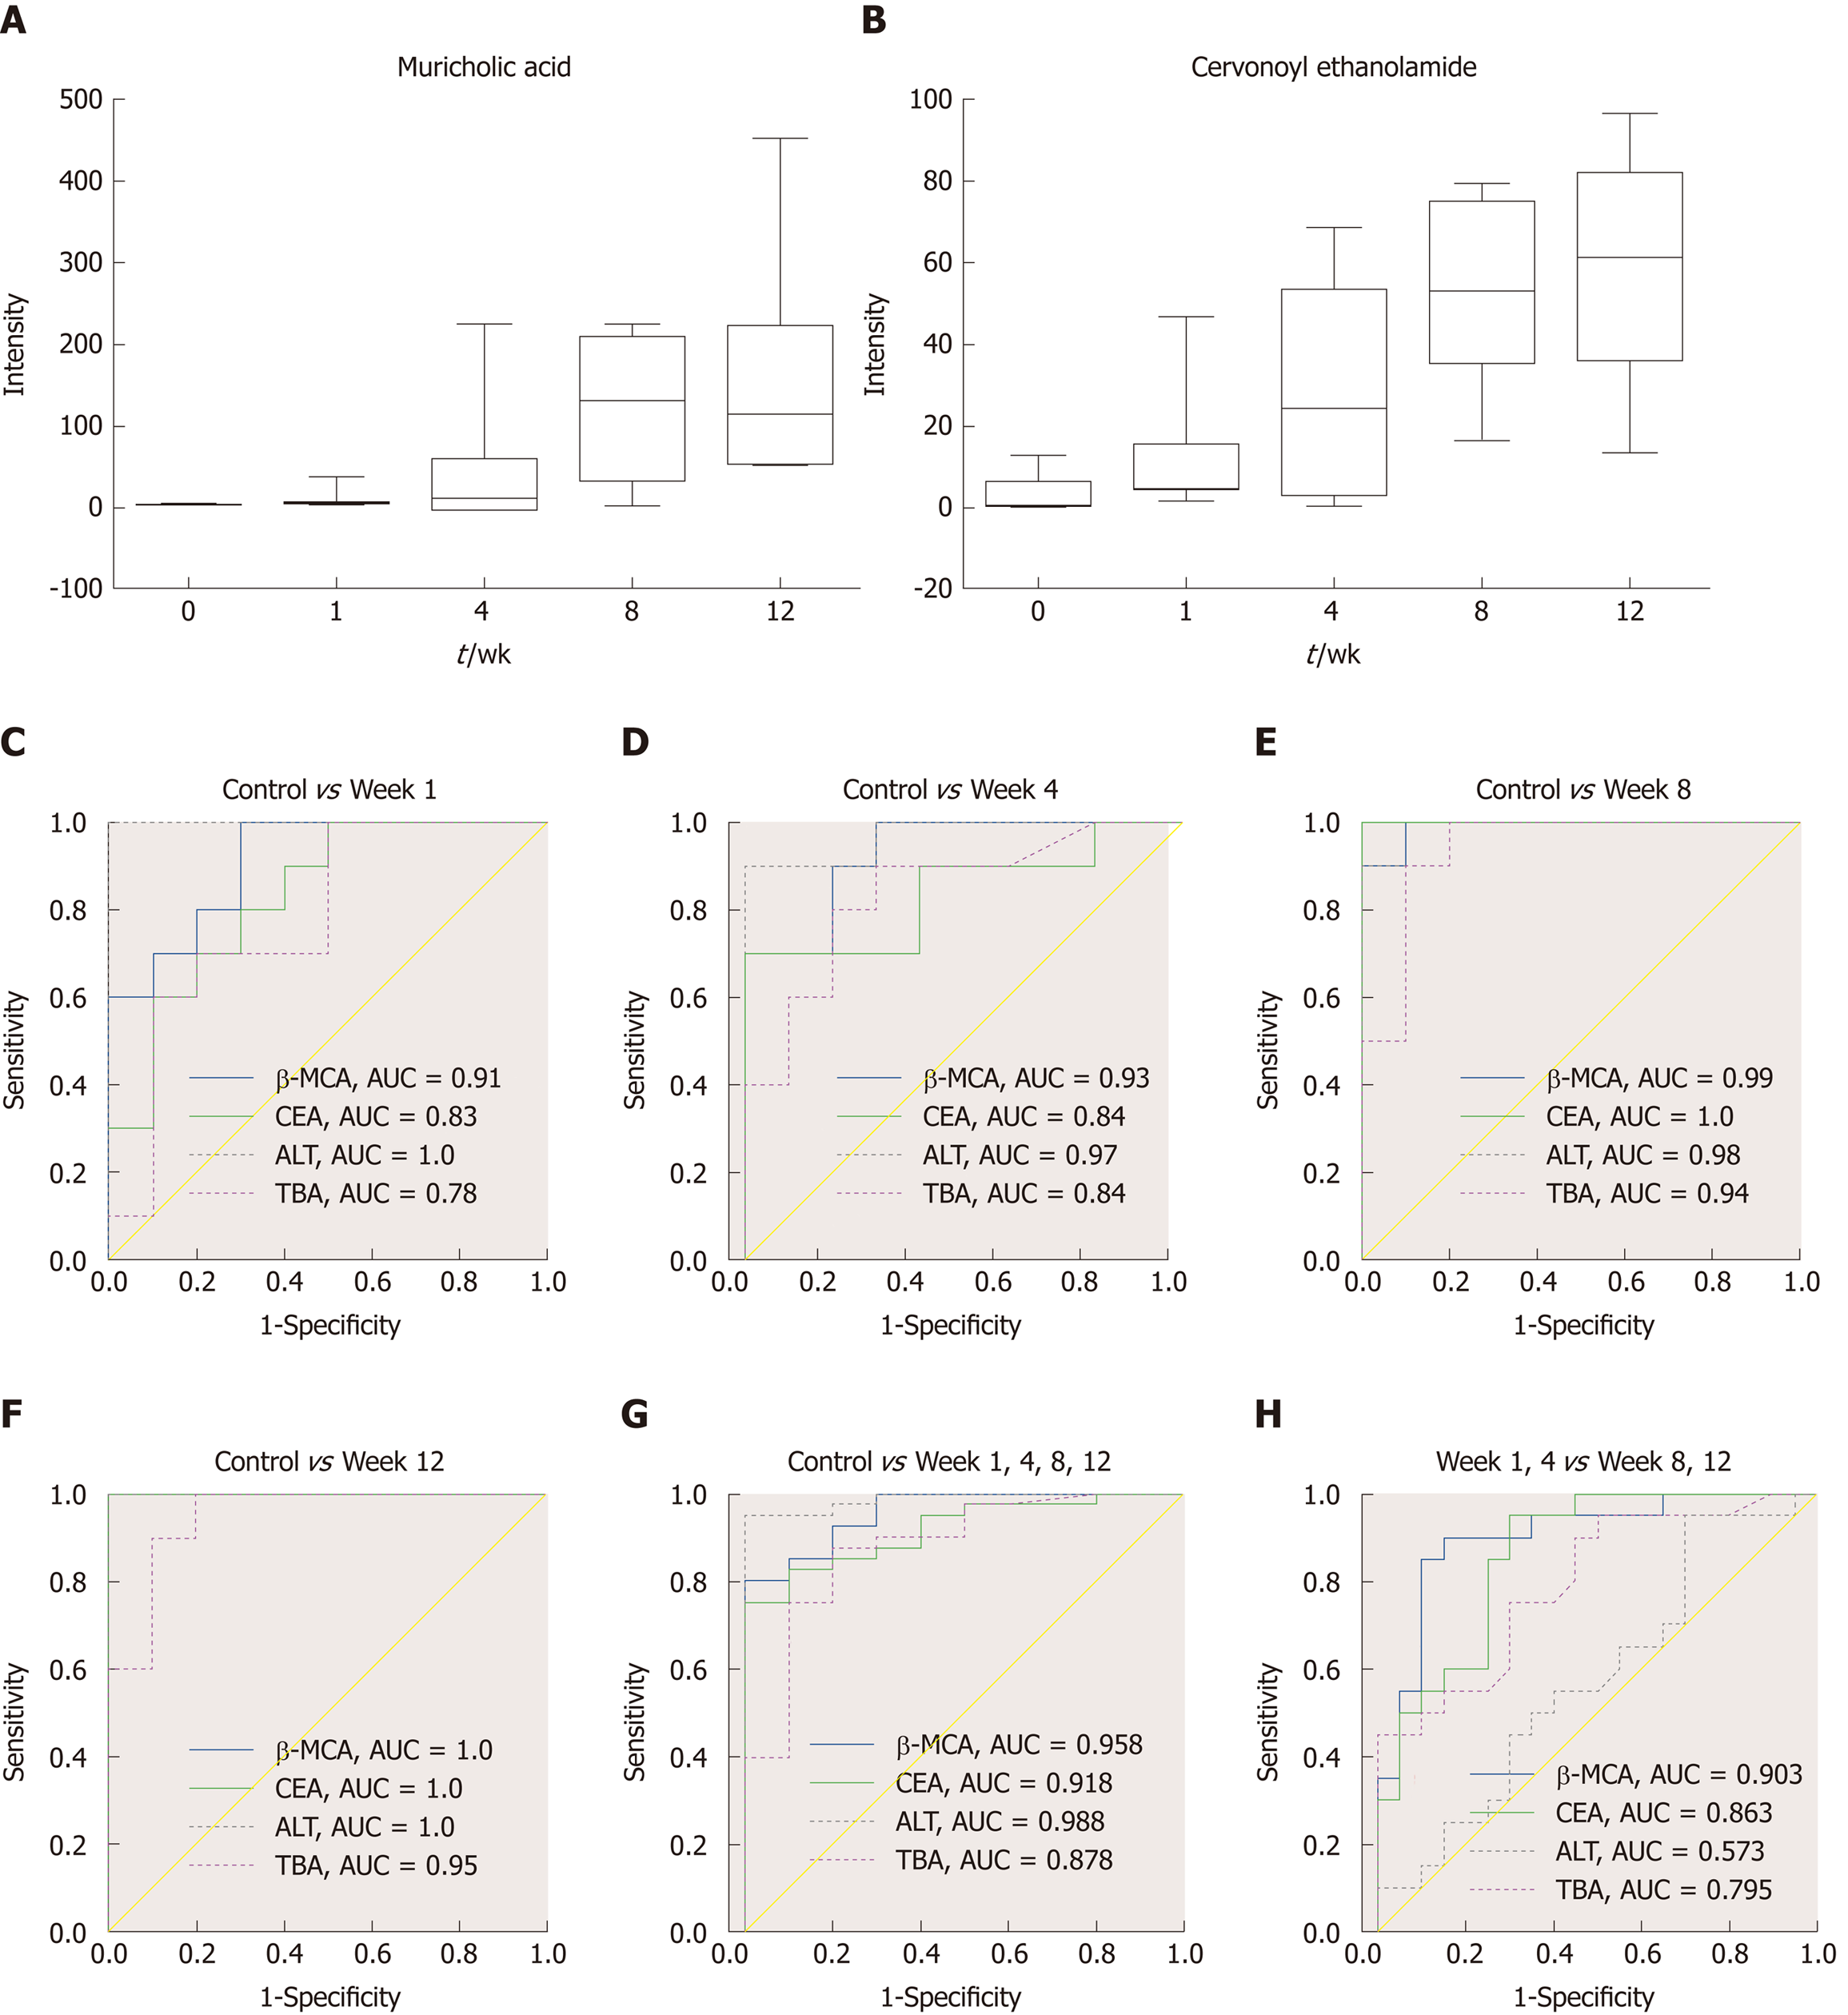
Figure 6 Biomarker candidates for liver fibrosis.
A and B: Dynamic changes in the identified metabolites in each group; C-H: Receiver operator characteristic curves for the diagnosis of liver fibrosis based on the potential biomarkers, TBA and ALT. TBA: Total bile acid; ALT: Alanine aminotransferase; AUC: Area under the curve; CEA: Cervonoyl ethanolamide; β-MCA: β-muricholic acid.
- Citation: Yu J, He JQ, Chen DY, Pan QL, Yang JF, Cao HC, Li LJ. Dynamic changes of key metabolites during liver fibrosis in rats. World J Gastroenterol 2019; 25(8): 941-954
- URL: https://www.wjgnet.com/1007-9327/full/v25/i8/941.htm
- DOI: https://dx.doi.org/10.3748/wjg.v25.i8.941


