Copyright
©The Author(s) 2019.
World J Gastroenterol. Feb 7, 2019; 25(5): 567-583
Published online Feb 7, 2019. doi: 10.3748/wjg.v25.i5.567
Published online Feb 7, 2019. doi: 10.3748/wjg.v25.i5.567
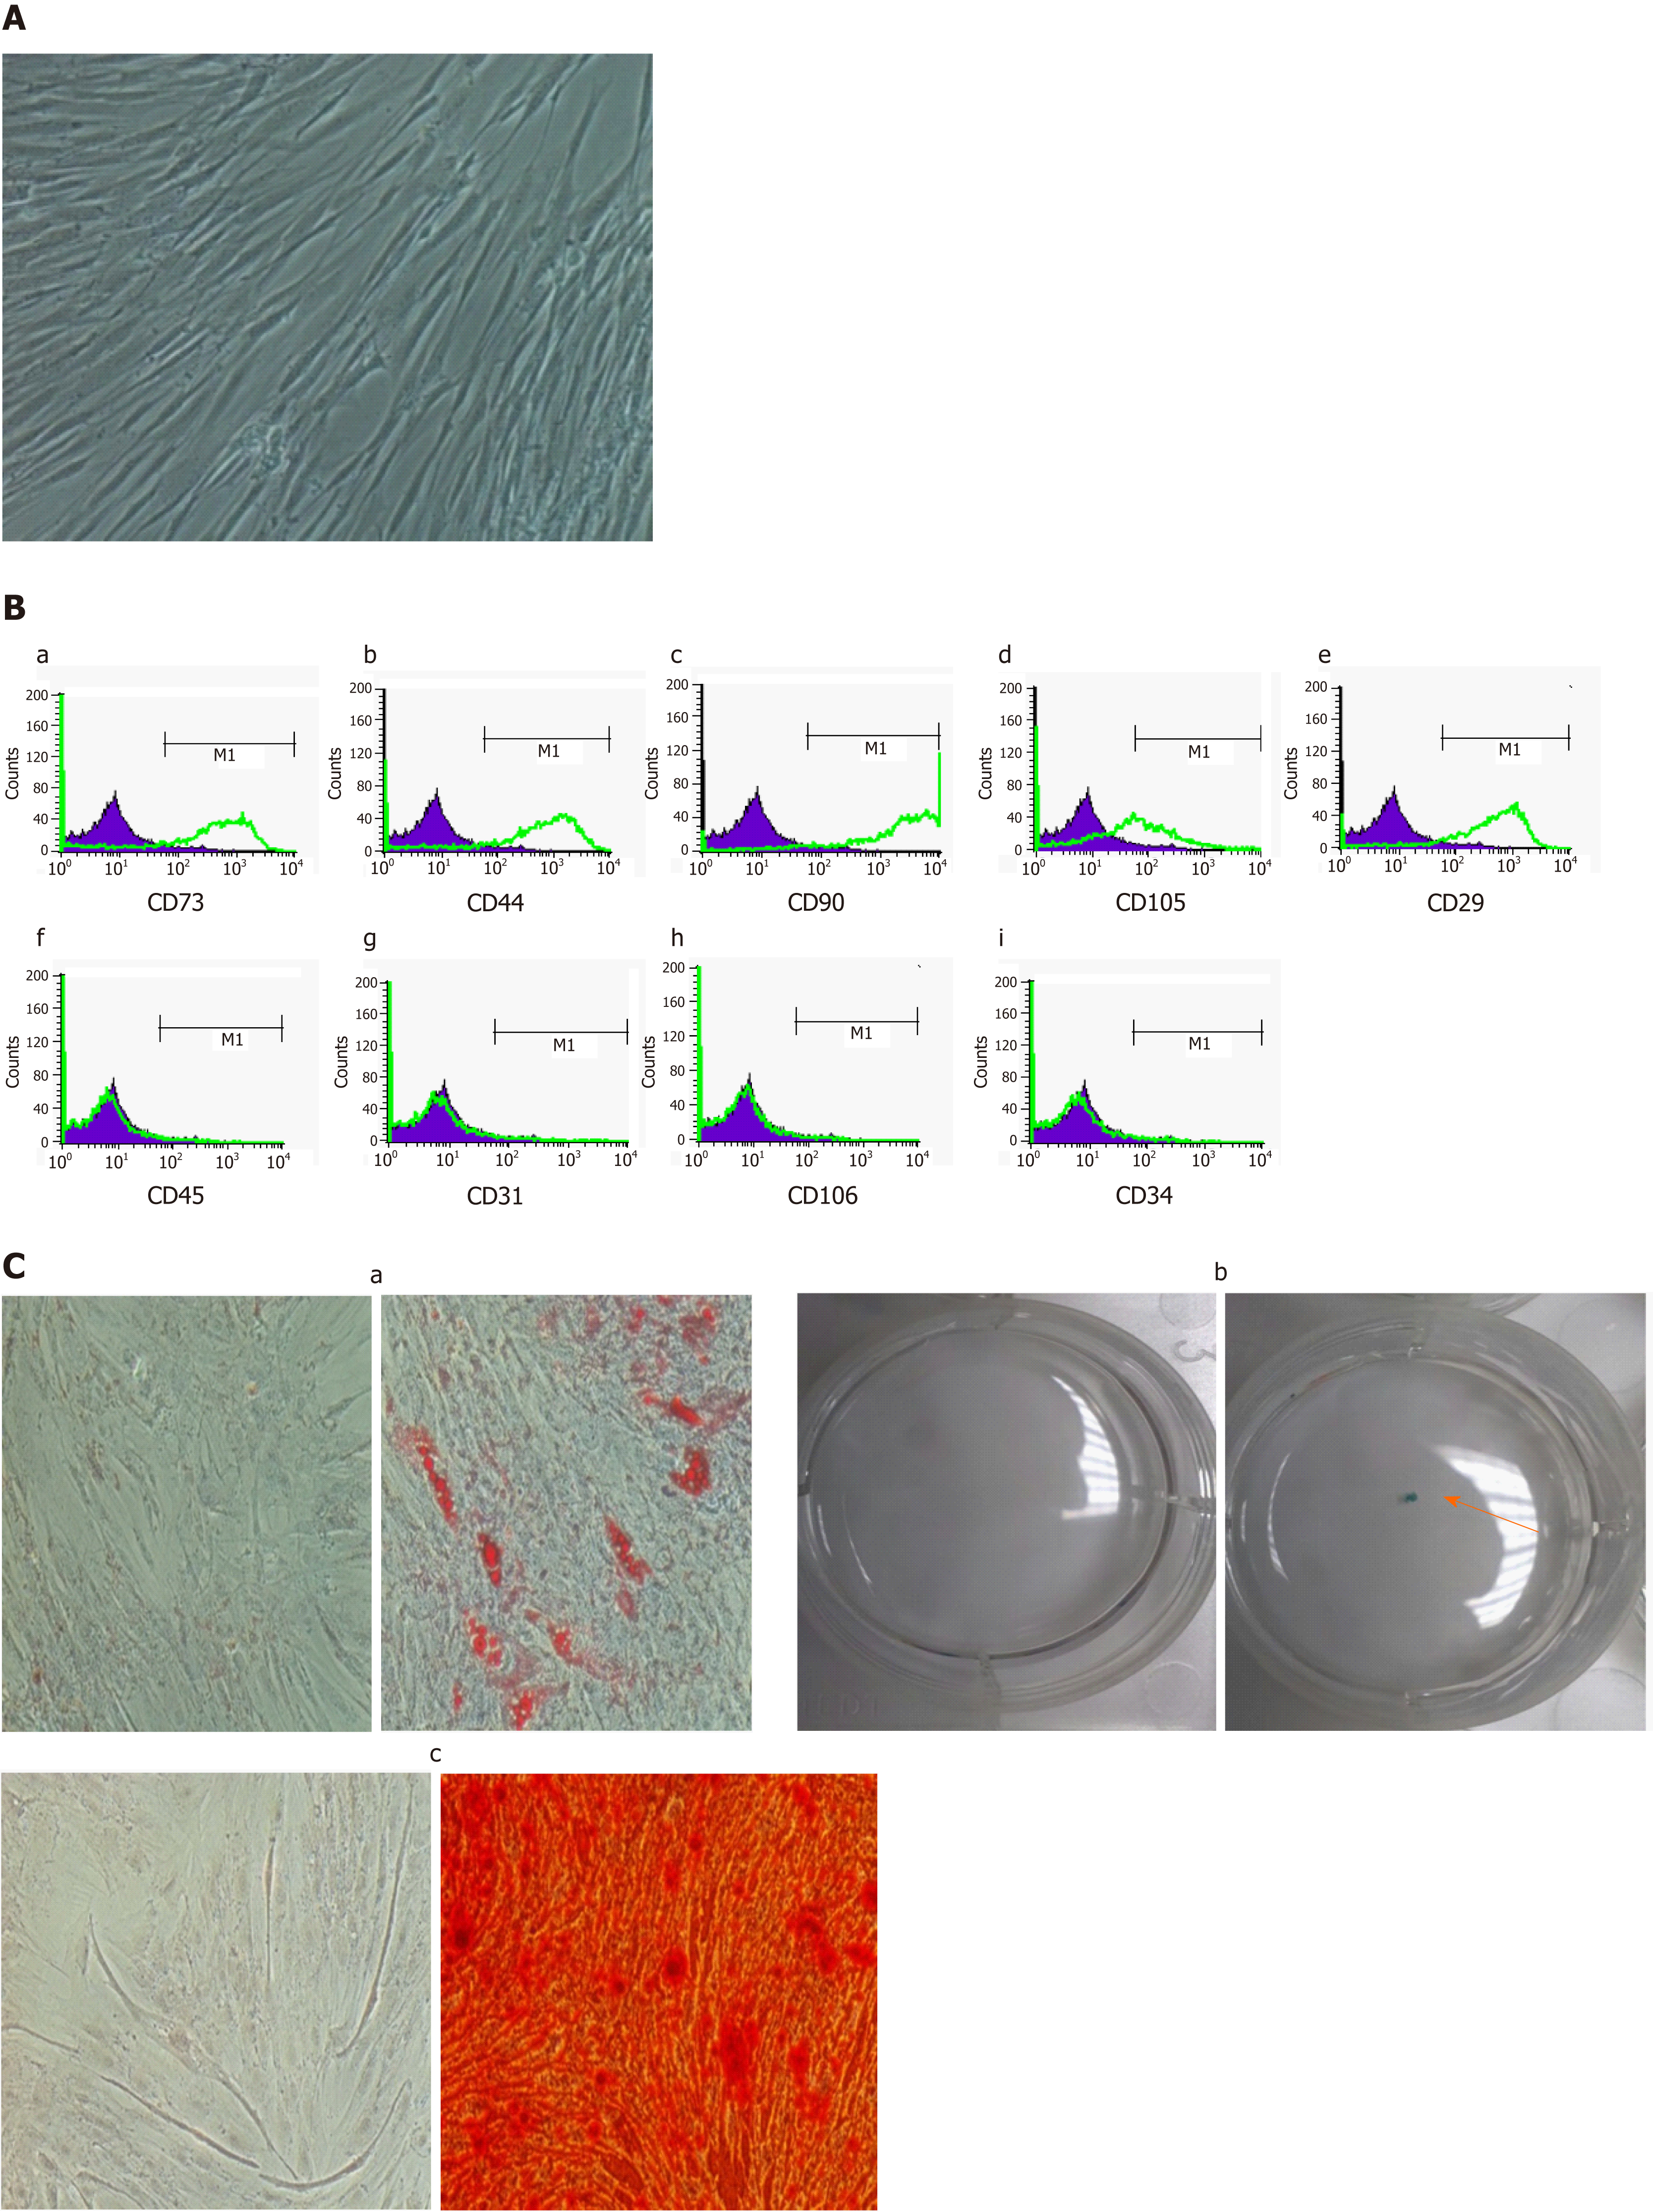
Figure 1 Characterization of adipose-derived mesenchymal stem cells.
A: Microscopic observation (magnification 100 ×) showed that isolated ADMSCs have a fibroblast-like morphology; B: Immunophenotyping of ADMSCs using flow cytometry analysis. The flow cytometry histograms of the ADMSCs at passage 1 for a representative donor are displayed. The percentage of positively stained cells is indicated in the middle right section of each histogram. The green line indicates the positively stained cells; whereas the purple line indicates the isotype-matched monoclonal antibody control. Histograms showed that ADMSCs were positive for (B-a) CD73, (B-b) CD44, (B-c) CD90, (B-d) CD105, (B-e) CD29, and were negative for (B-f) CD45, (B-g) CD31, (B-h) CD106, (B-i) CD34; C: Differentiation capacity of ADMSCs incubated for 3 wk in adipogenic, chondrogenic and osteogenic medium. (C-a) Representative images of adipogenic differentiation marked by the formation of intracellular lipid droplets colored using Oil Red O compared to control. (C-b) Solid chondrogenic micromass colored by Alcian blue, indicating the presence of glycosaminoglycans. (C-c) Representative images of osteogenic differentiation confirmed by the presence of calcium deposits colored by Alizarin Red. All immunophenotyping and differentiation experiments were repeated four times. ADMSCs: Adipose-derived mesenchymal stem cells.
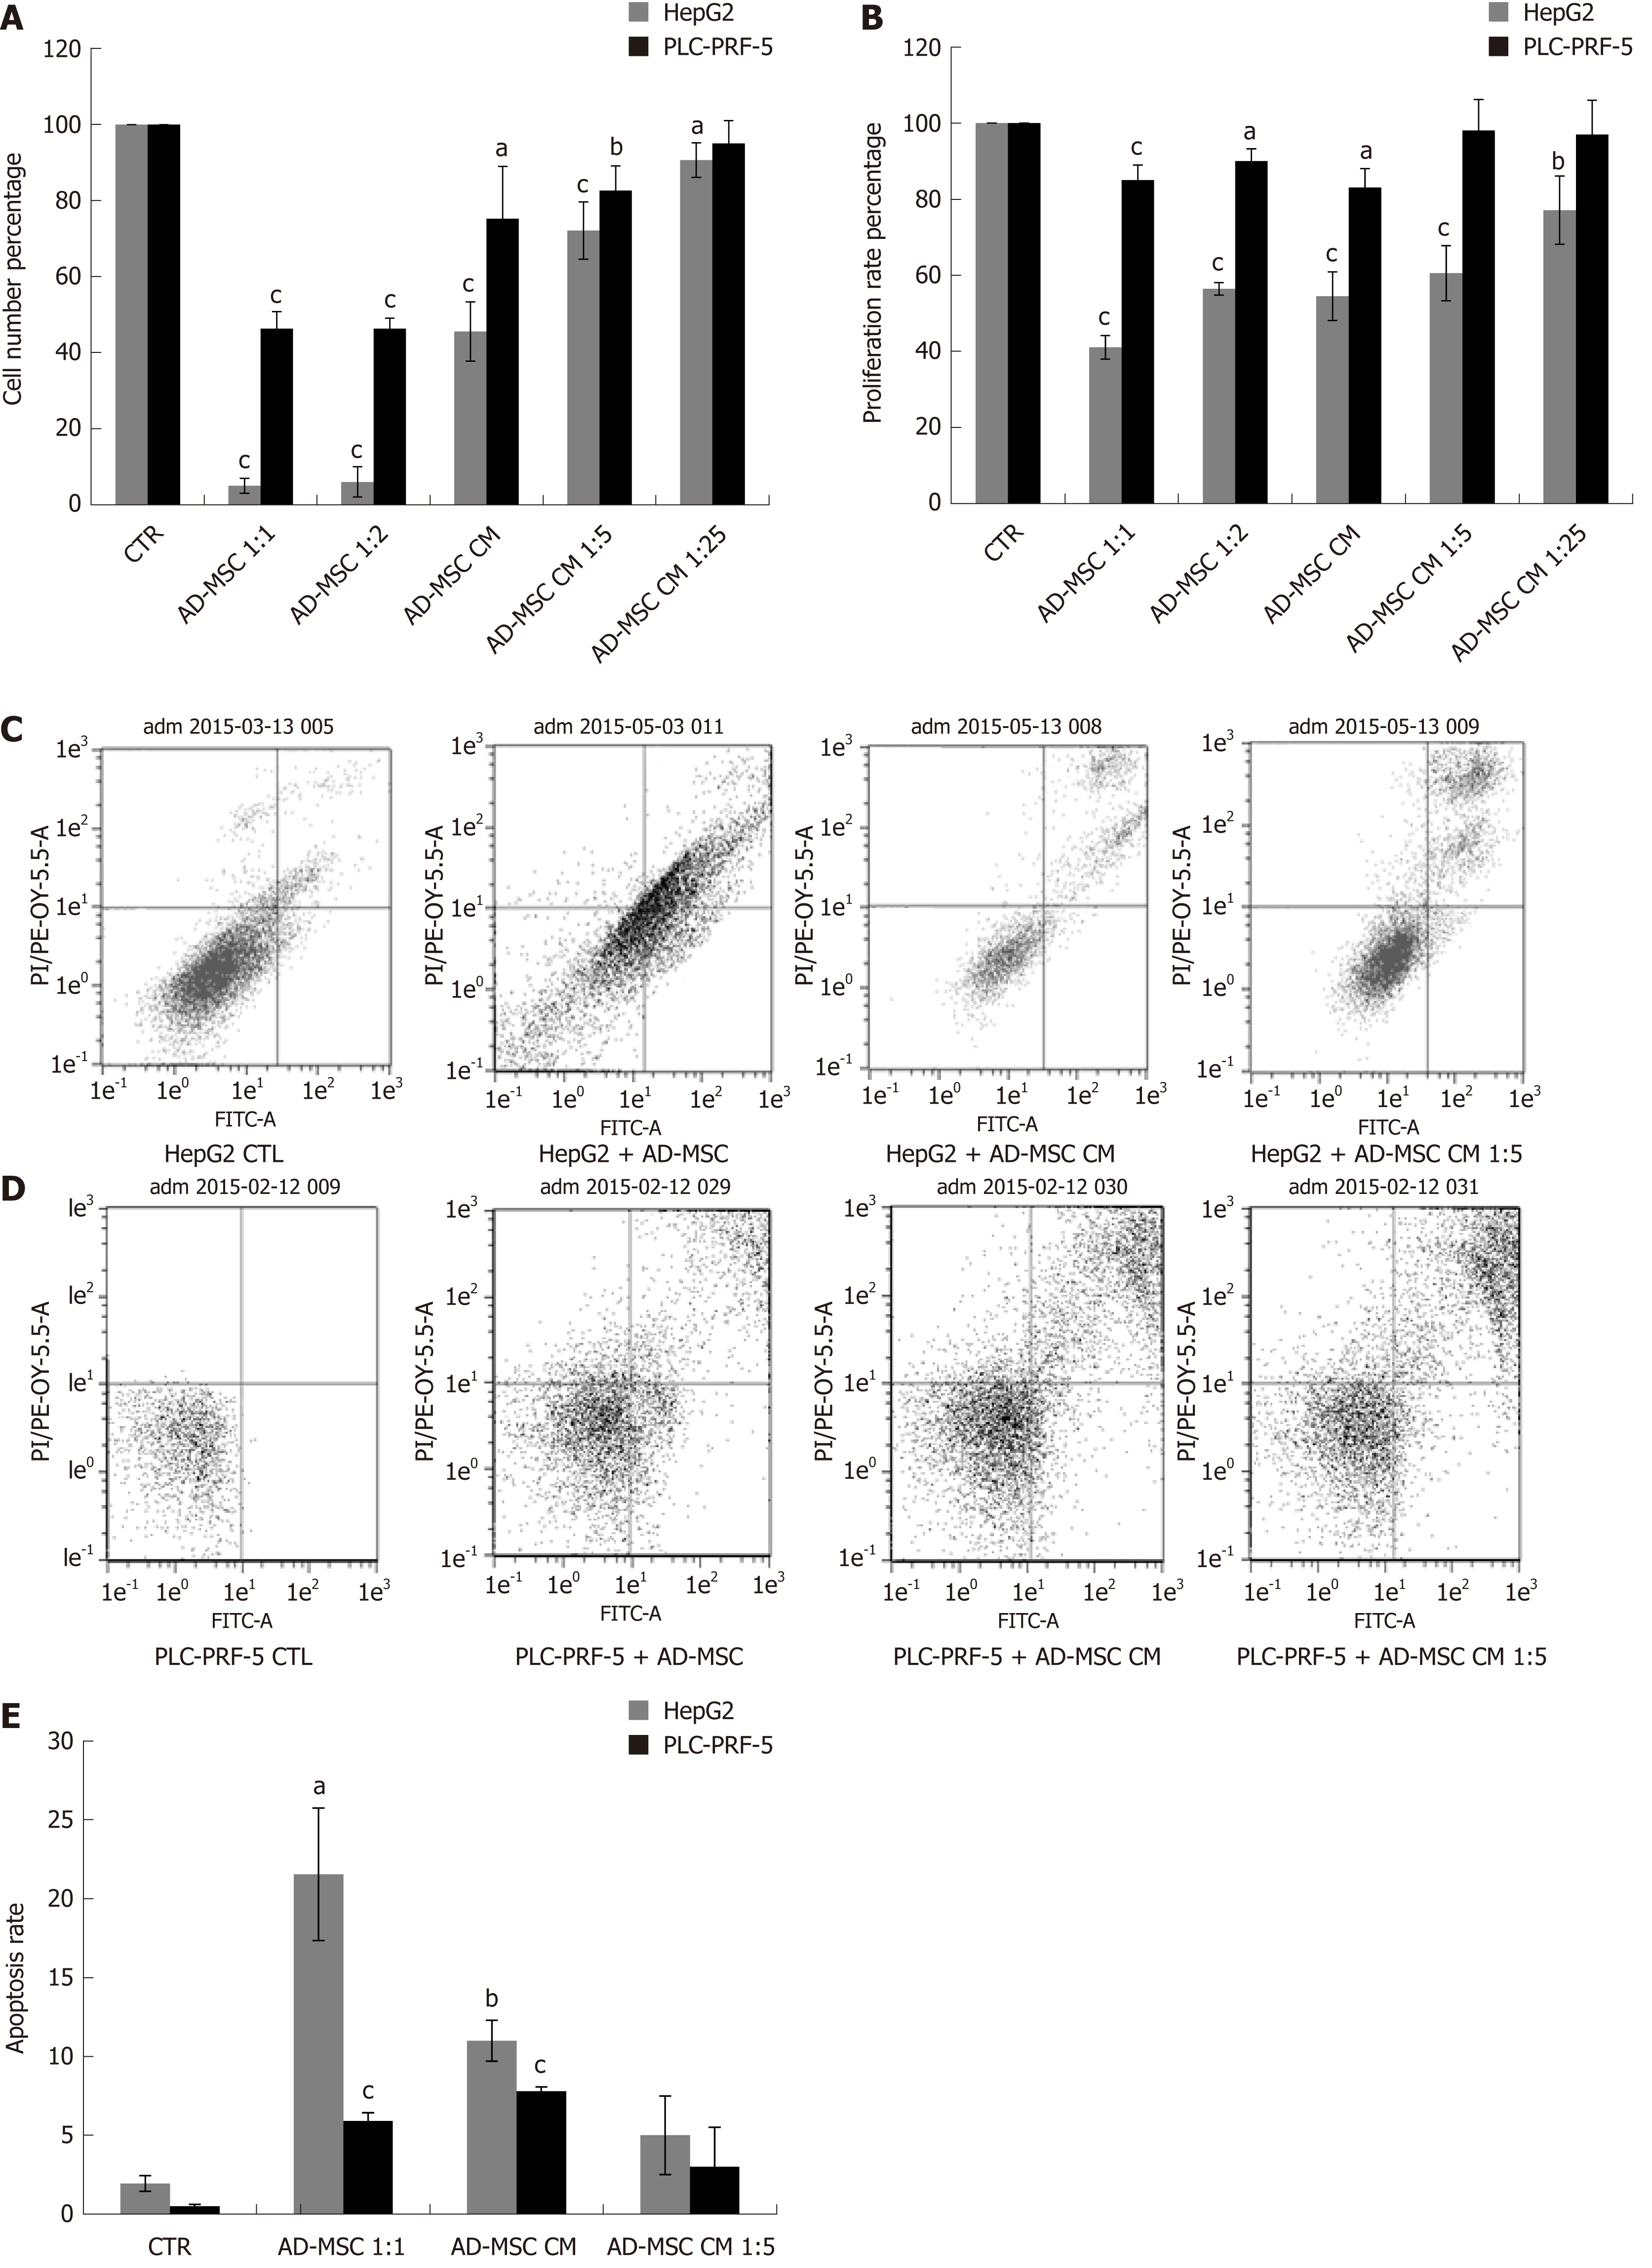
Figure 2 Effect of adipose-derived mesenchymal stem cells and their conditioned media on hepatocellular carcinoma cell proliferation and apoptosis.
HCC cells (2 × 10⁵) were seeded in six-well coculture plates in the presence or absence of ADMSCs and ADMSC CM, undiluted or diluted 1:5 or 1:25 for 48 h. The proliferation of HepG2 and PLC-PRF-5 HCC cell lines were measured by (A) cell count assay and (B) WST-8 proliferation tests; The apoptosis of HepG2 (C) and PLC-PRF (D) cells co-cultured as above was measured by flow cytometry using Annexin V/PI test kit; C and D: Two representative experiments of apoptosis in HepG2 and PLC-PRF cells, respectively; E: The average rate of apoptosis in HepG2 and PLC-PRF-5 cells induced by ADMSCs, ADMSC CM. Data are representative of three independent experiments, each repeated in triplicate. All data are represented as mean ± SD (aP < 0.05, bP < 0.01, cP < 0.001). CTR: Control; ADMSC: Adipose-derived mesenchymal stem cell; CM: Conditioned media; HCC: Hepatocellular carcinoma.
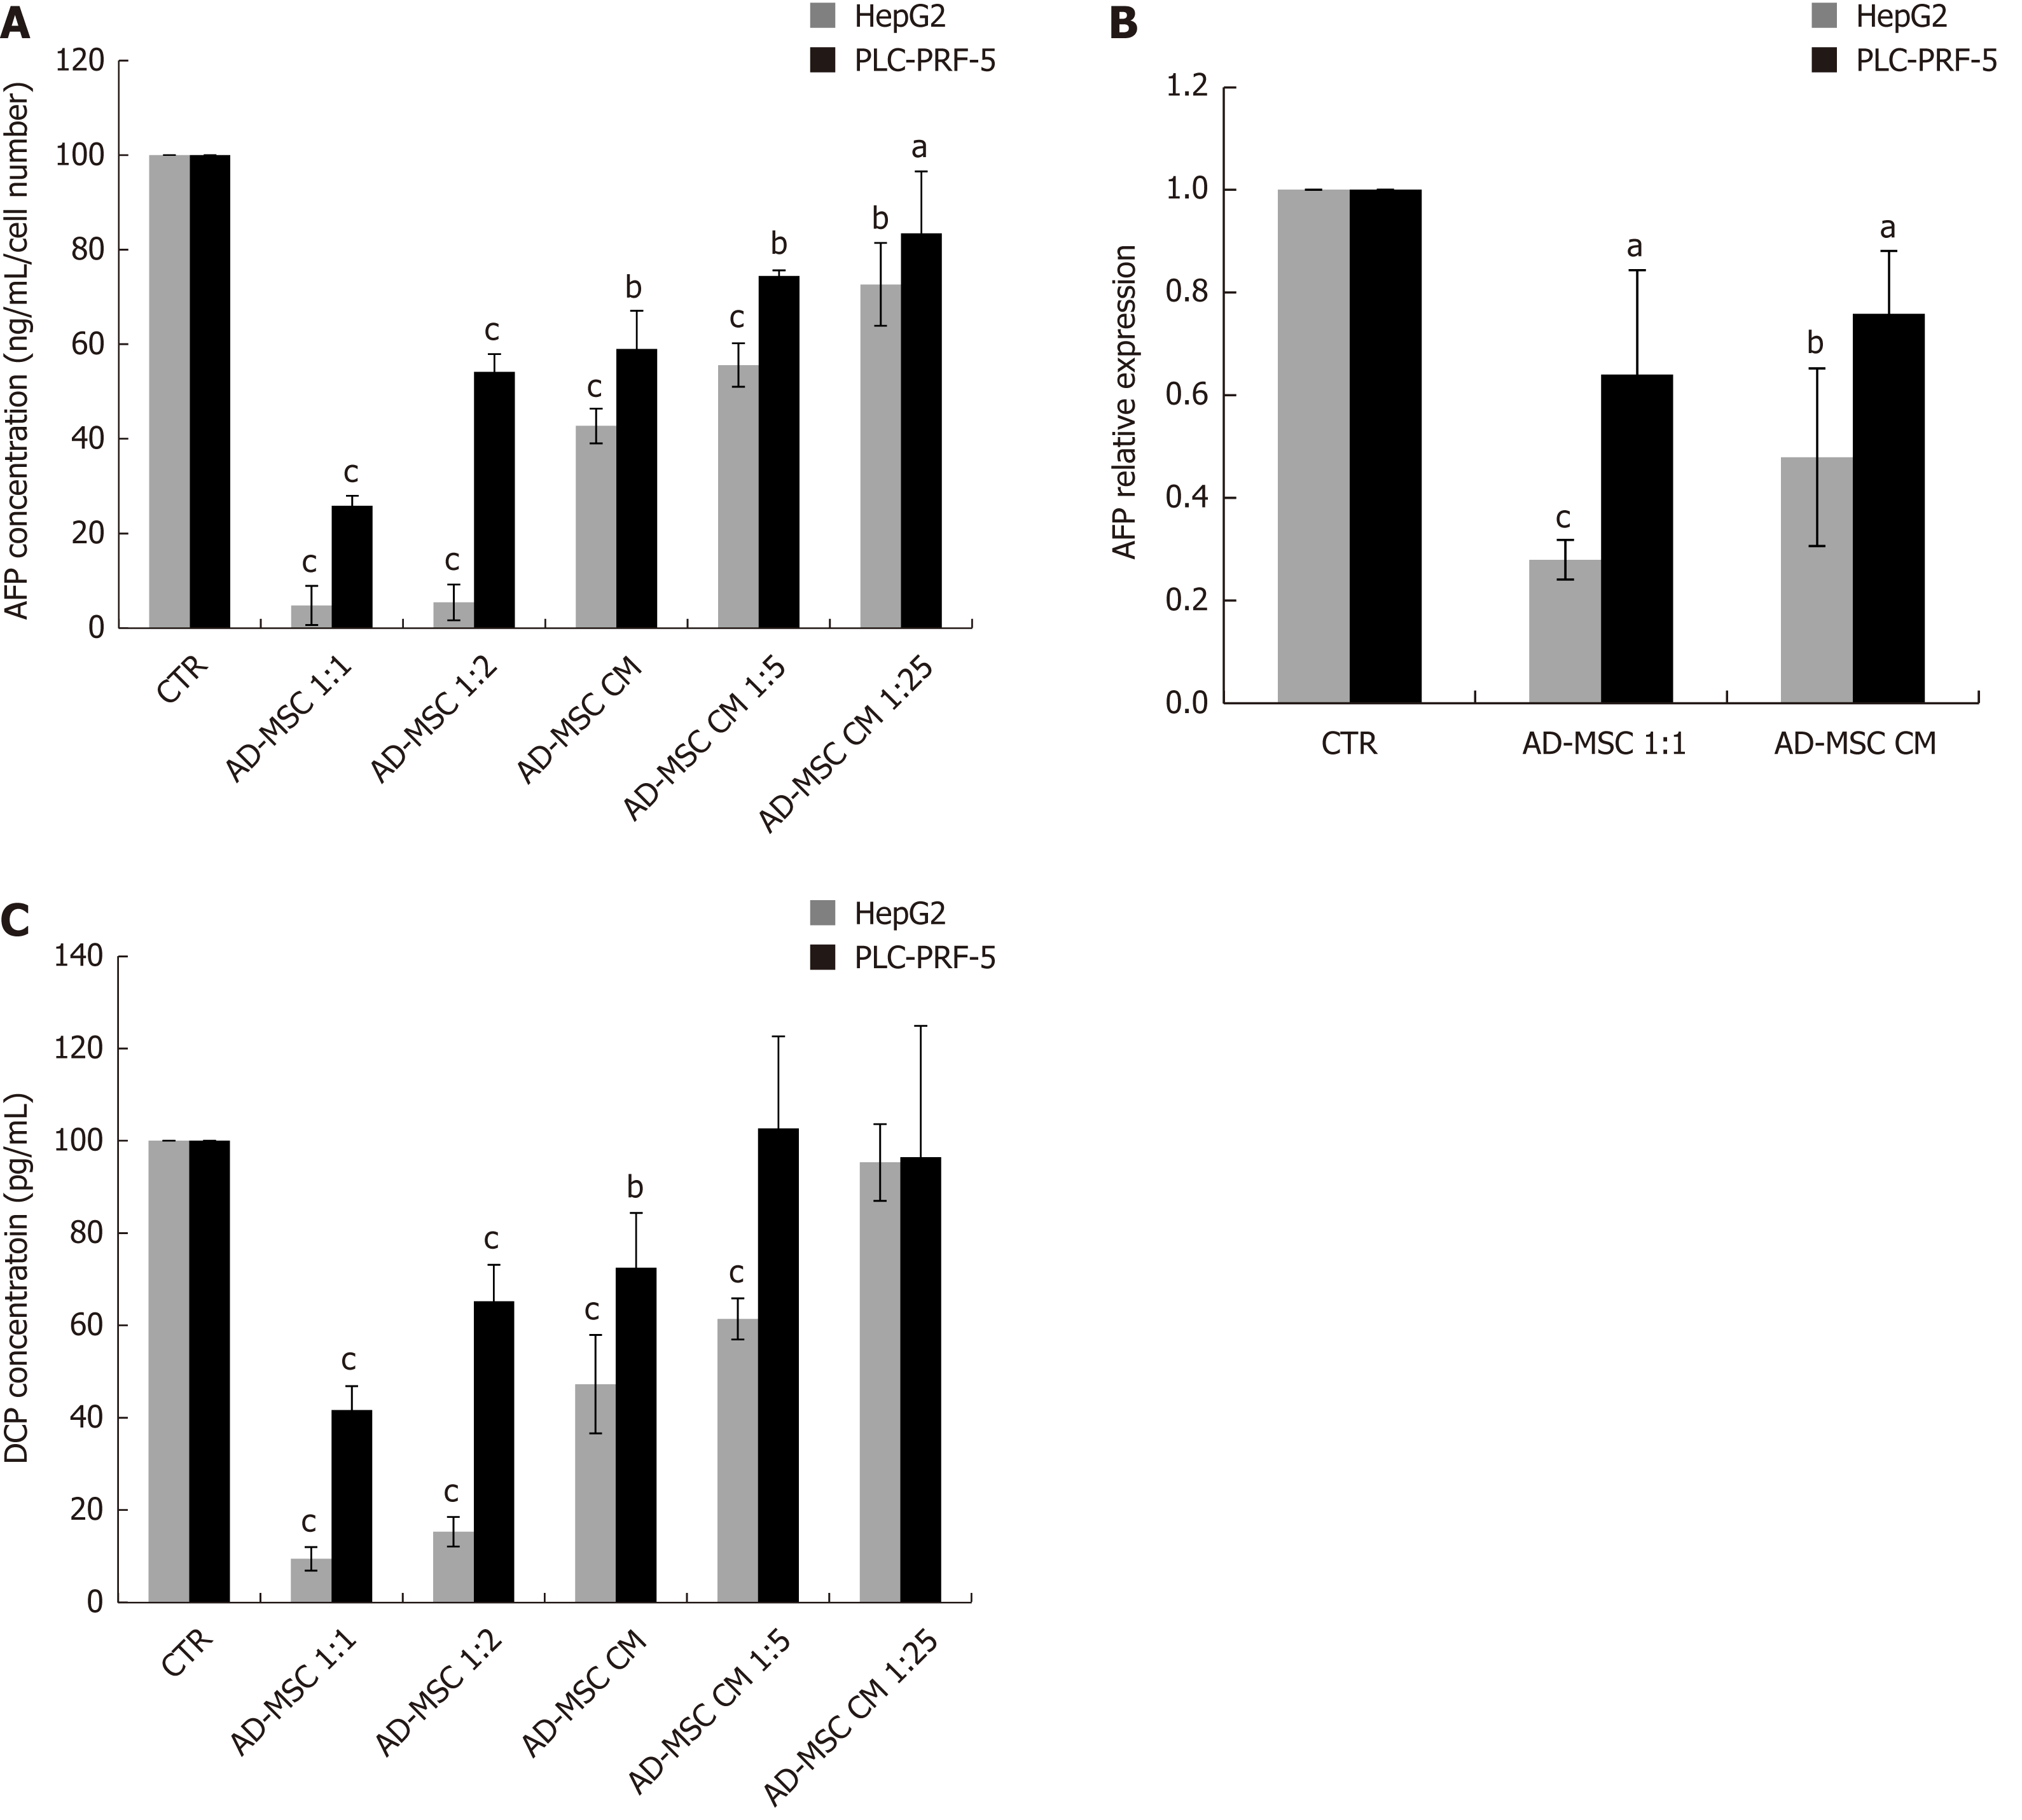
Figure 3 Expression of hepatocellular markers in hepatocellular carcinoma cells.
HCC cells (2 × 10⁵) were seeded in six-well coculture plates in the presence or absence of ADMSCs and ADMSC CM, undiluted or diluted 1:5 or 1:25 for 48 h. The protein levels of AFP (A) and DCP (C) was measured in the cell supernatant by ELISA; B: AFP mRNA was assessed by quantitative PCR. Results re displayed as percentage of controls. Data are represented as mean ± SD of five independent experiments, each repeated in triplicate (aP < 0.05, bP < 0.01, cP < 0.001). CTR: Control; ADMSC: Adipose-derived mesenchymal stem cell; CM: Conditioned media; HCC: Hepatocellular carcinoma; AFP: alpha-fetoprotein; DCP: Des-gamma-carboxyprothrombin.
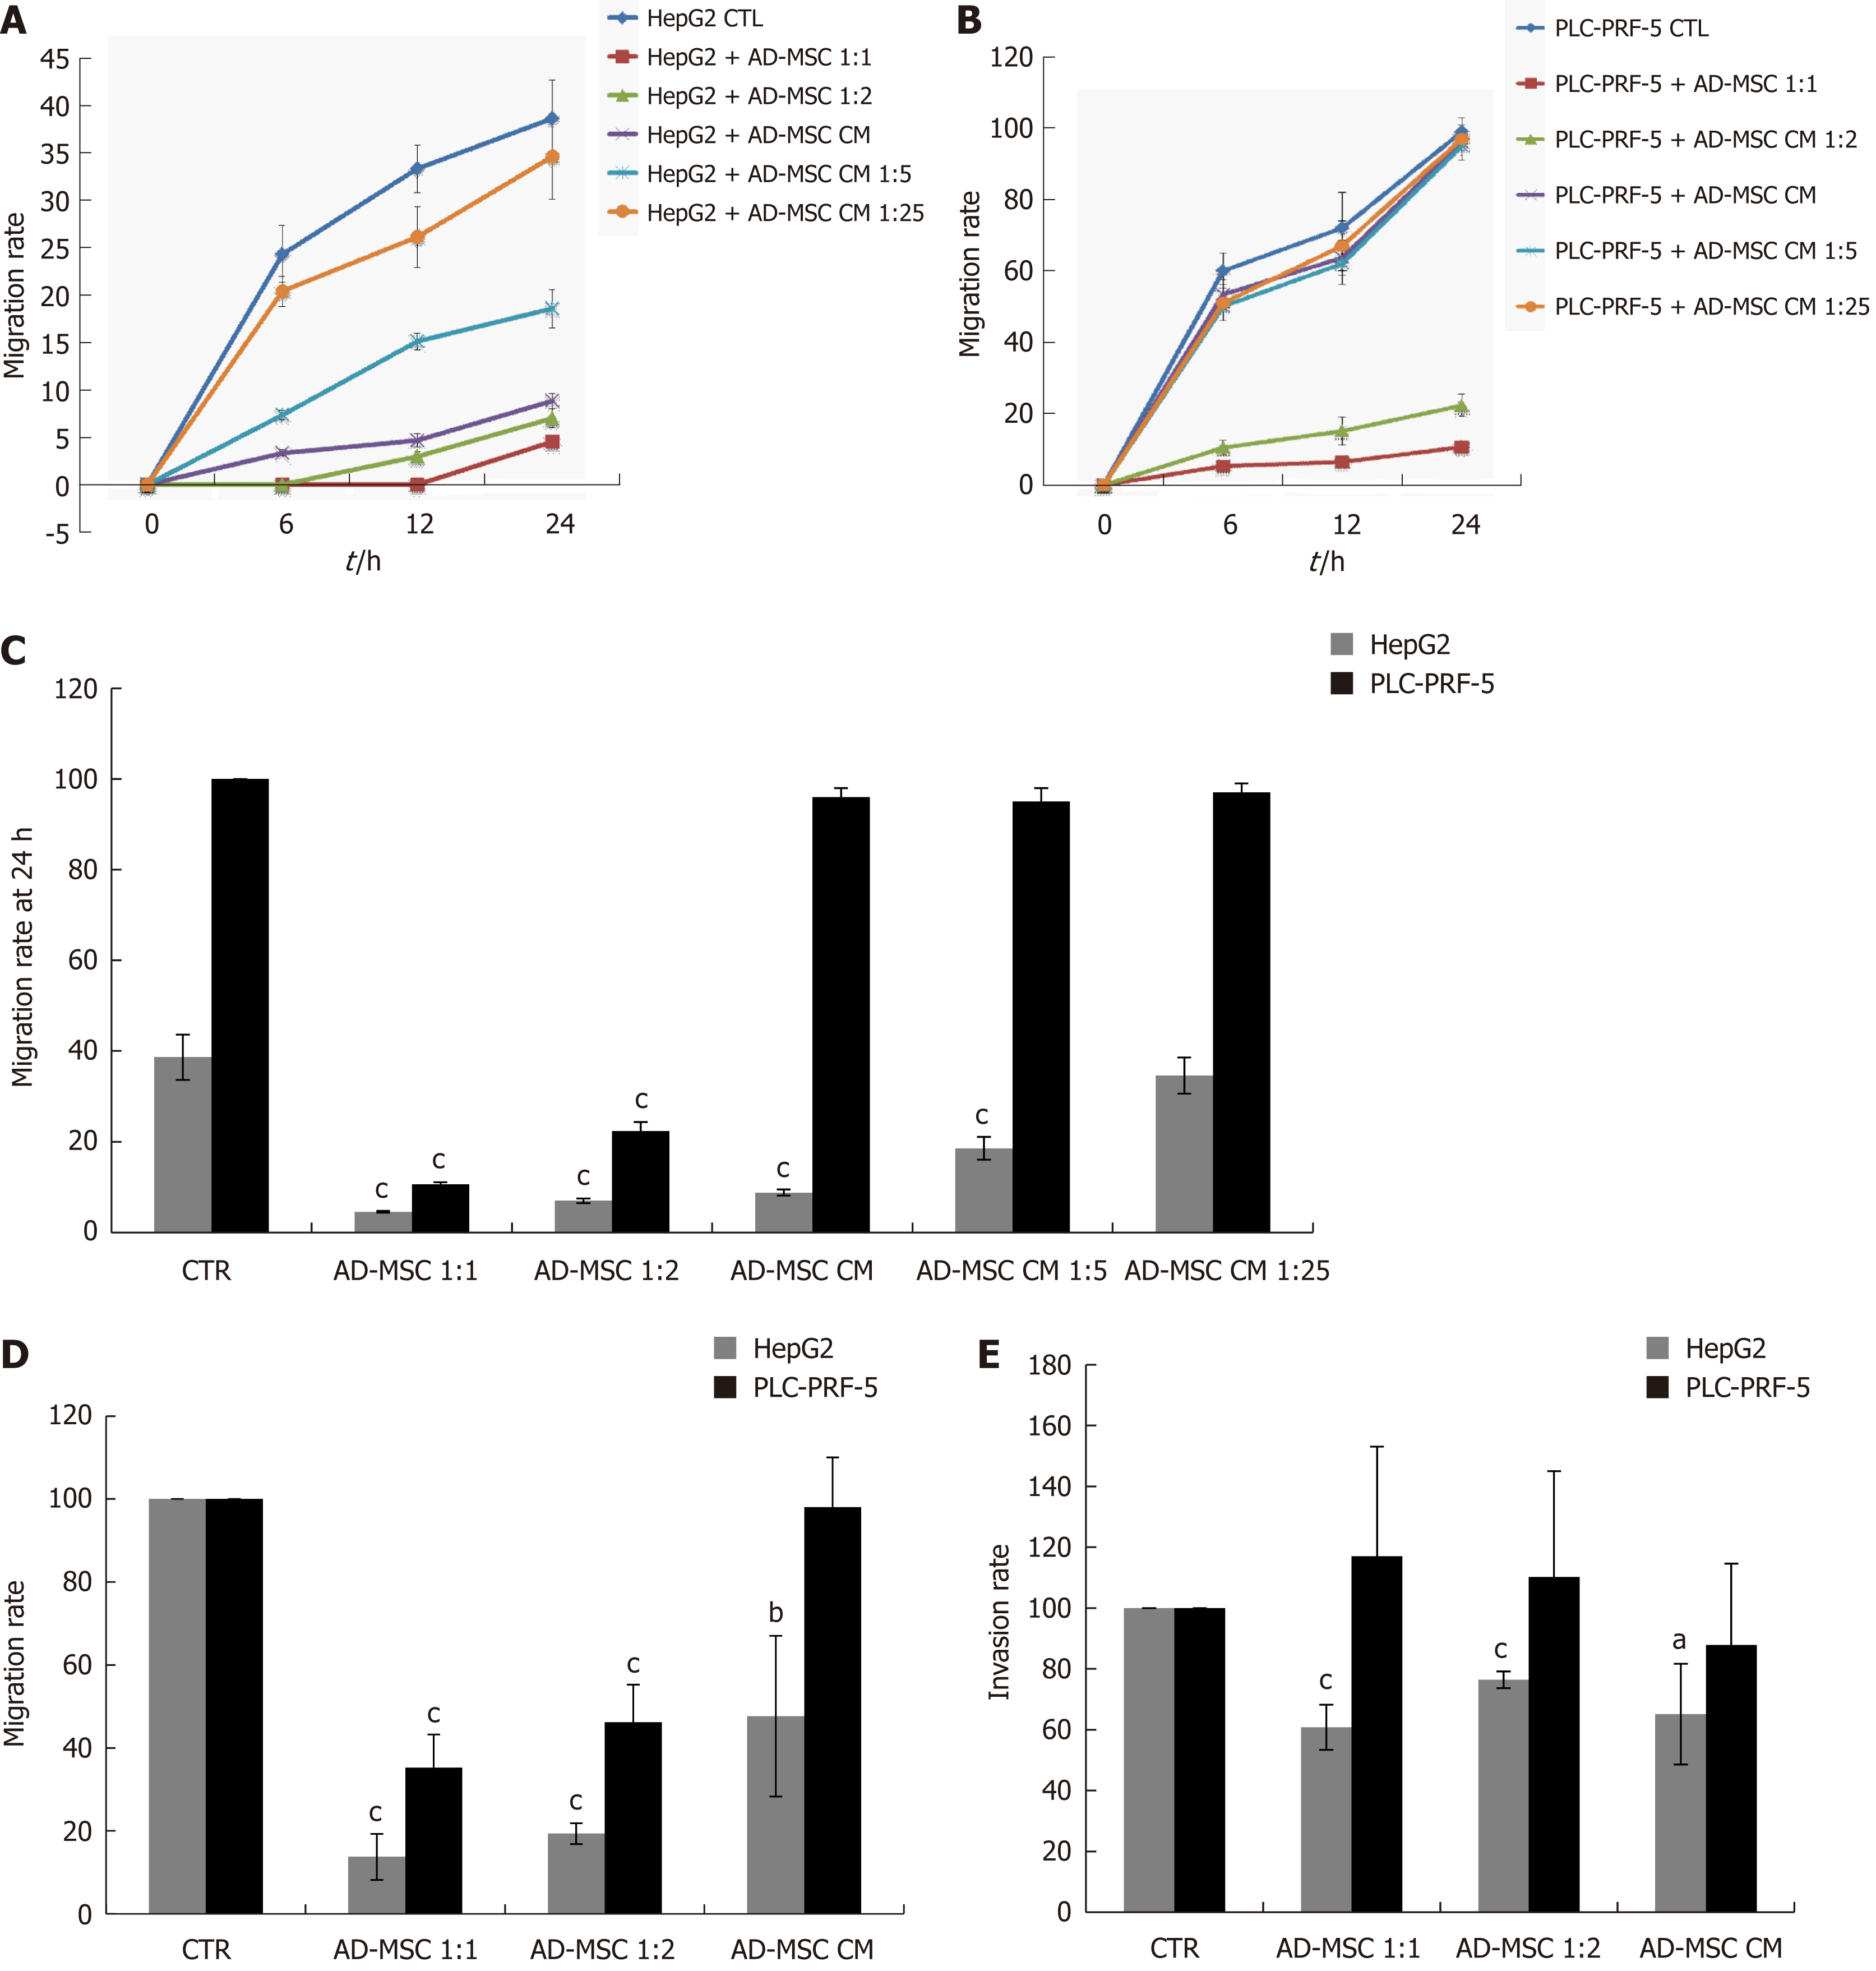
Figure 4 Effect of adipose derived mesenchymal stem cells and their conditioned media on of hepatocellular carcinoma cell migration and invasion.
HCC cells (2 × 10⁵) were seeded in six- well co-culture plates in the presence or absence of ADMSCs (at ADSMCs: HCC ratio of 1:1 or 1:2) or ADMSC CM, undiluted or diluted 1:5 or 1:25. The migration of (A) HepG2 and (B) PLC-PRF-5 cells was assessed by wound healing assay. The migration rate at 24 h is represented in (C); D: A Transwell migration assay was performed to confirm the results of the wound healing assay; E: HCC cell invasiveness was measured by Transwell invasion assay. In the Transwell migration and invasion assay, 3 × 10⁵ HCC cells alone, co-cultured with ADMSCs, or treated with ADMSC CM were seeded into the apical chamber of Transwell plates and allowed to migrate or invade through the uncoated polycarbonate membrane or collagen-coated polycarbonate membrane, respectively (8 μm pore size) to the lower chamber for 24 h or 48 h, respectively. The migratory or invasive cells were stained with crystal violet cell stain solution and extracted using an extraction solution provided in the kit. The level of migration and invasion was measured using a plate reader at the absorbance of 560 nm. Values shown are representative of five independent experiments, each performed in triplicate. Data are represented as mean ± SD of five independent experiments, each performed in triplicate (aP < 0.05, bP < 0.01, cP < 0.001). CTR: Control; ADMSC: Adipose derived mesenchymal stem cell; CM: Conditioned media; HCC: Hepatocellular carcinoma.
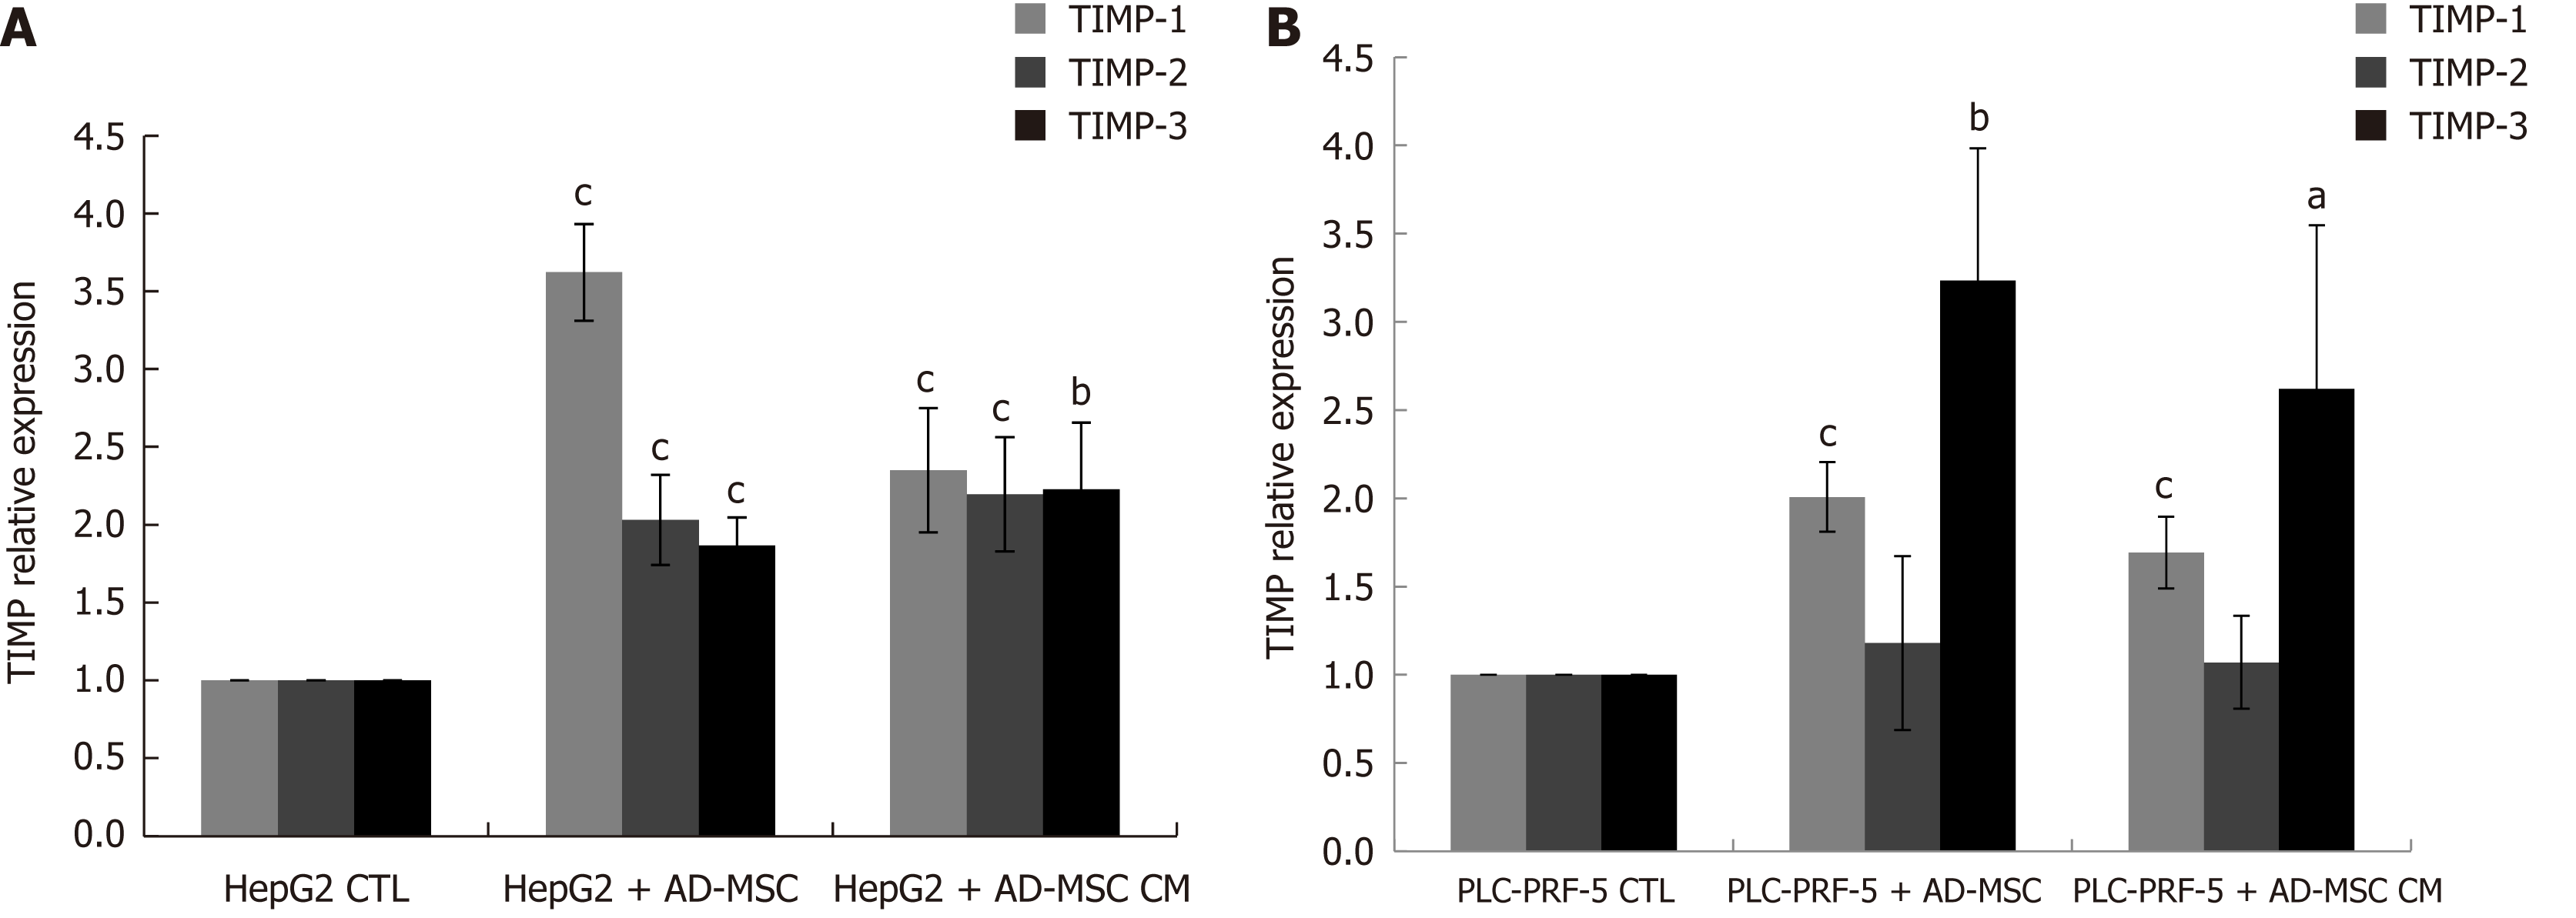
Figure 5 Effect of adipose-derived mesenchymal stem cells and adipose-derived mesenchymal stem cell conditioned media on tissue inhibitor metalloproteinase mRNA levels in hepatocellular carcinoma cells.
HCC cells (2 × 10⁵) were seeded in six-well co-culture plates in the presence or absence of ADMSCs or of undiluted ADMSC conditioned media (CM). The mRNA levels of TIMP-1, TIMP-2, and TIMP-3 in HepG2 (A) and PLC-PRF-5 (B) cells after the removal of ADMSCs in the case of coculture was measured by quantitative PCR. Data are represented as mean ± SD of five independent experiments, each performed in triplicate (aP < 0.05, bP < 0.01, cP < 0.001). ADMSC: Adipose-derived mesenchymal stem cell; CM: Conditioned media; HCC: Hepatocellular carcinoma.
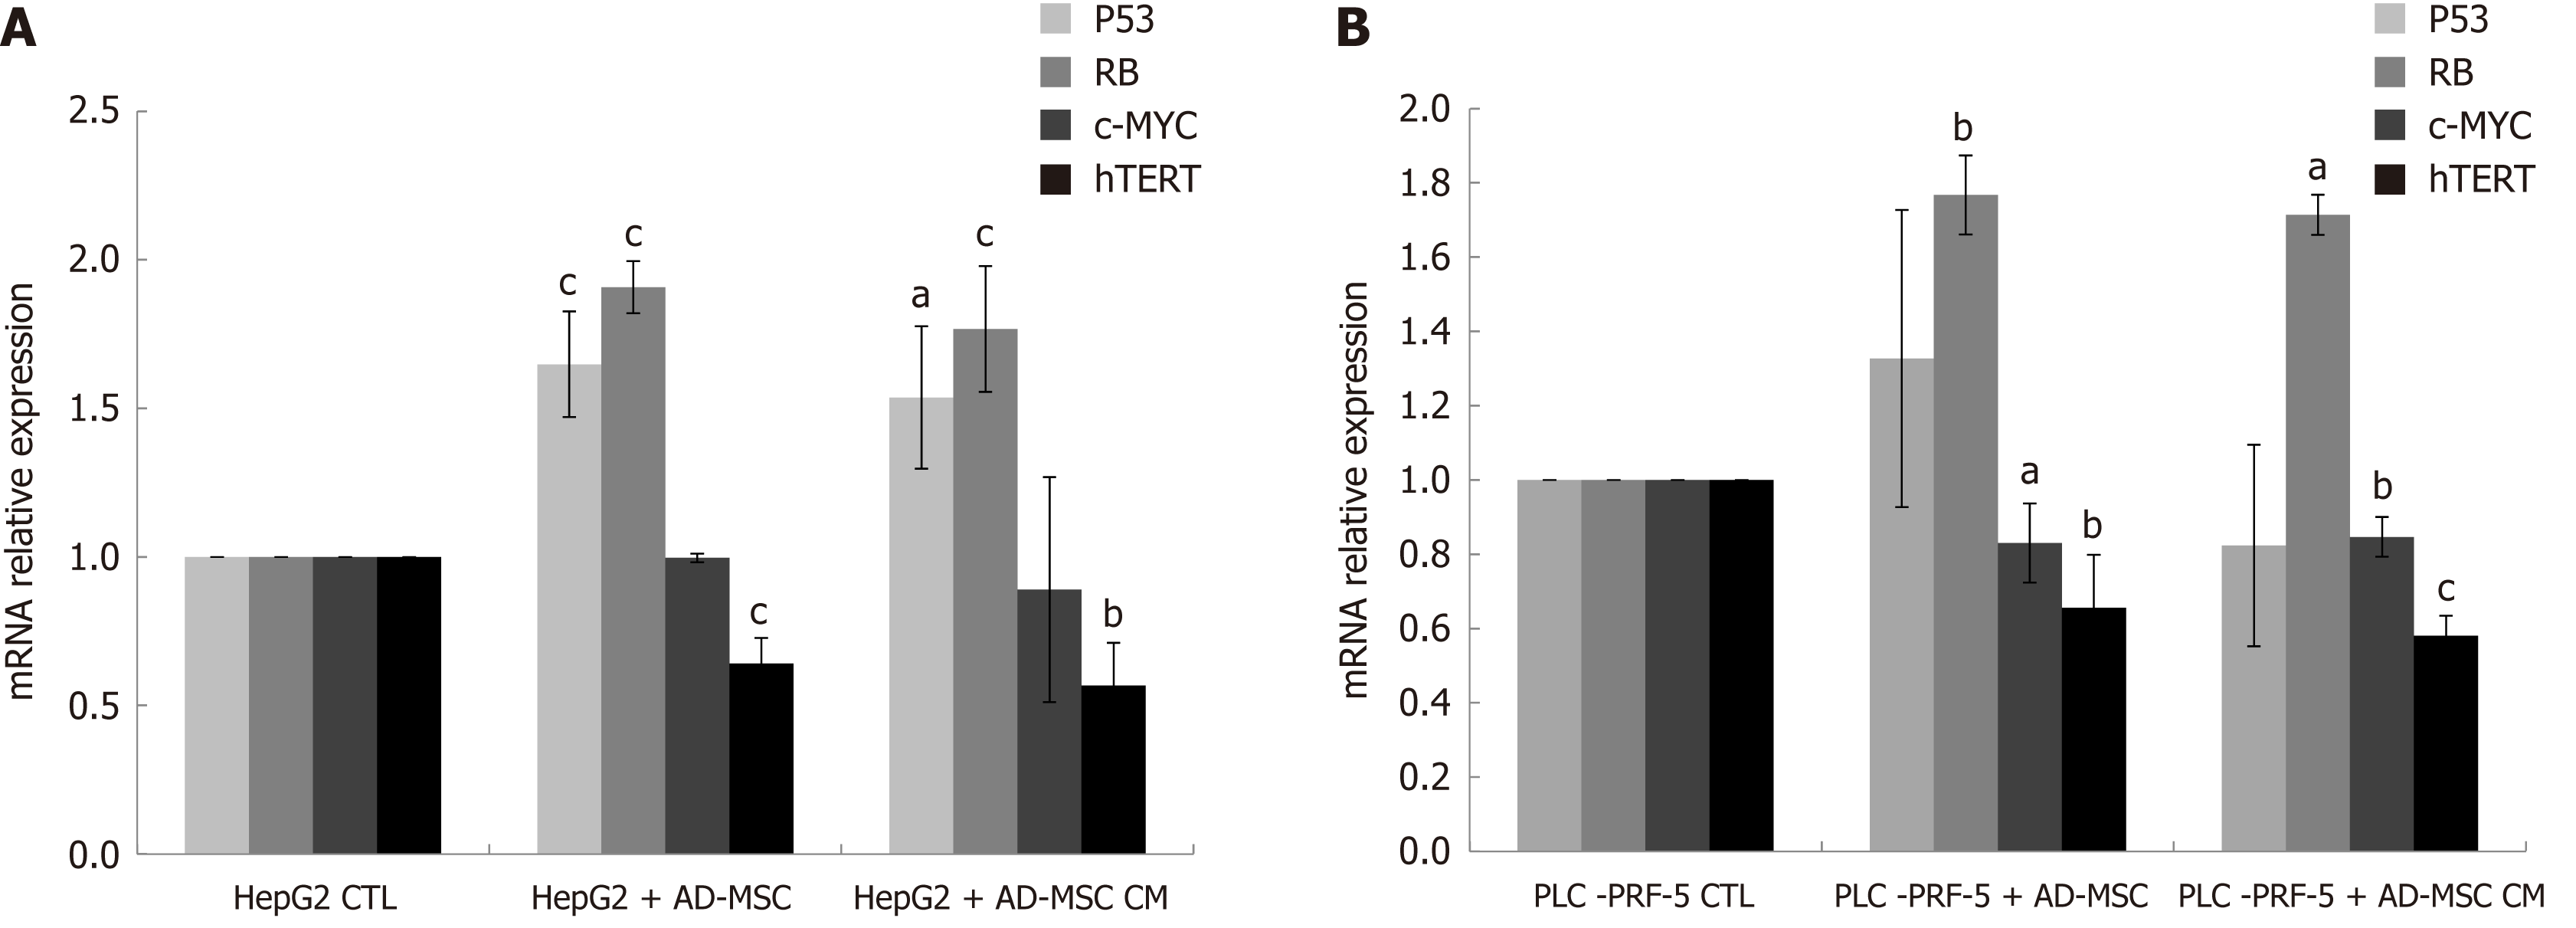
Figure 6 Expression of tumor suppressor genes and oncogenes in hepatocellular carcinoma cells.
HCC cells (2 × 10⁵) were seeded in six-well co-culture plates in the presence or absence of ADMSCs or undiluted ADMSC CM for 48 h. The mRNA expression of the tumor suppressor genes P53/RB, oncogene c-Myc and the enzymatic component of telomerase hTERT were assessed by RT-PCR in (A) HepG2 and (B) PLC-PRF-5 cells after the removal of ADMSCs in the case of co-culture. Data are represented as mean ± SD of five independent experiments, each performed in triplicate (aP < 0.05, bP < 0.01, cP < 0.001). ADMSC: Adipose-derived mesenchymal stem cell; CM: Conditioned media; HCC: Hepatocellular carcinoma.
- Citation: Serhal R, Saliba N, Hilal G, Moussa M, Hassan GS, El Atat O, Alaaeddine N. Effect of adipose-derived mesenchymal stem cells on hepatocellular carcinoma: In vitro inhibition of carcinogenesis. World J Gastroenterol 2019; 25(5): 567-583
- URL: https://www.wjgnet.com/1007-9327/full/v25/i5/567.htm
- DOI: https://dx.doi.org/10.3748/wjg.v25.i5.567


