Copyright
©The Author(s) 2019.
World J Gastroenterol. Nov 7, 2019; 25(41): 6258-6272
Published online Nov 7, 2019. doi: 10.3748/wjg.v25.i41.6258
Published online Nov 7, 2019. doi: 10.3748/wjg.v25.i41.6258
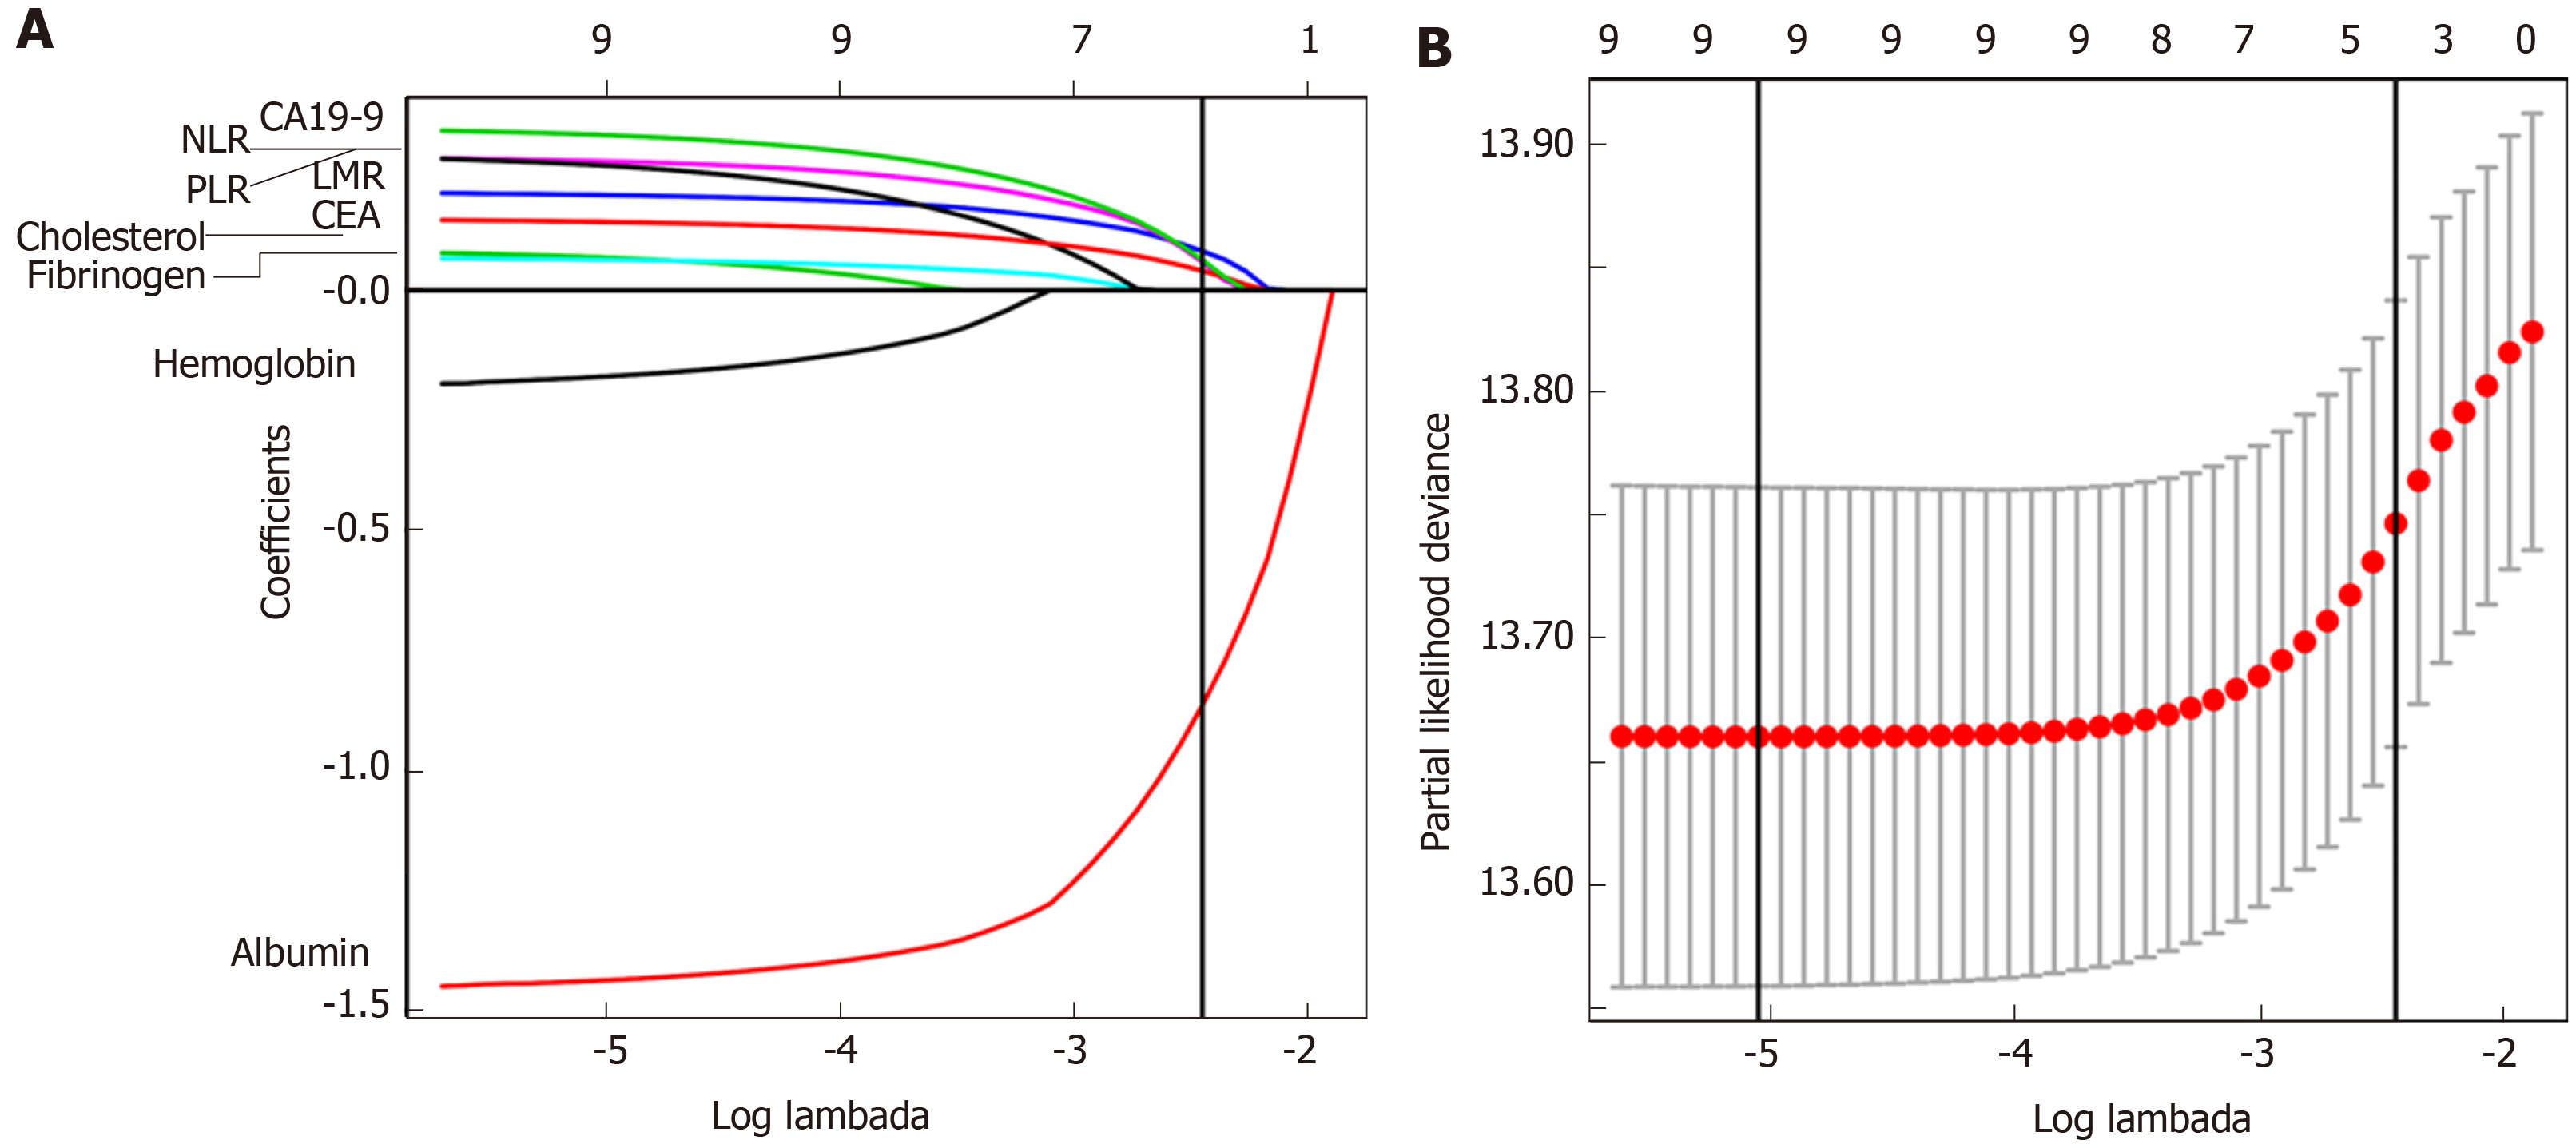
Figure 1 Construction of the blood parameters score, a classifier comprising five blood parameters.
A: Least absolute shrinkage and selection operator (LASSO) coefficient profiles of the nine blood parameters. The vertical line indicates the value chosen by 10-fold cross-validation; B: Ten-fold cross-validation for tuning parameter selection in the LASSO Cox model. Solid vertical lines represent partial likelihood deviance ± standard error. We plotted the partial likelihood deviance vs log (λ), where λ is the tuning parameter. The vertical lines are drawn at the optimal values by minimum criteria and 1 - S.E. criteria.
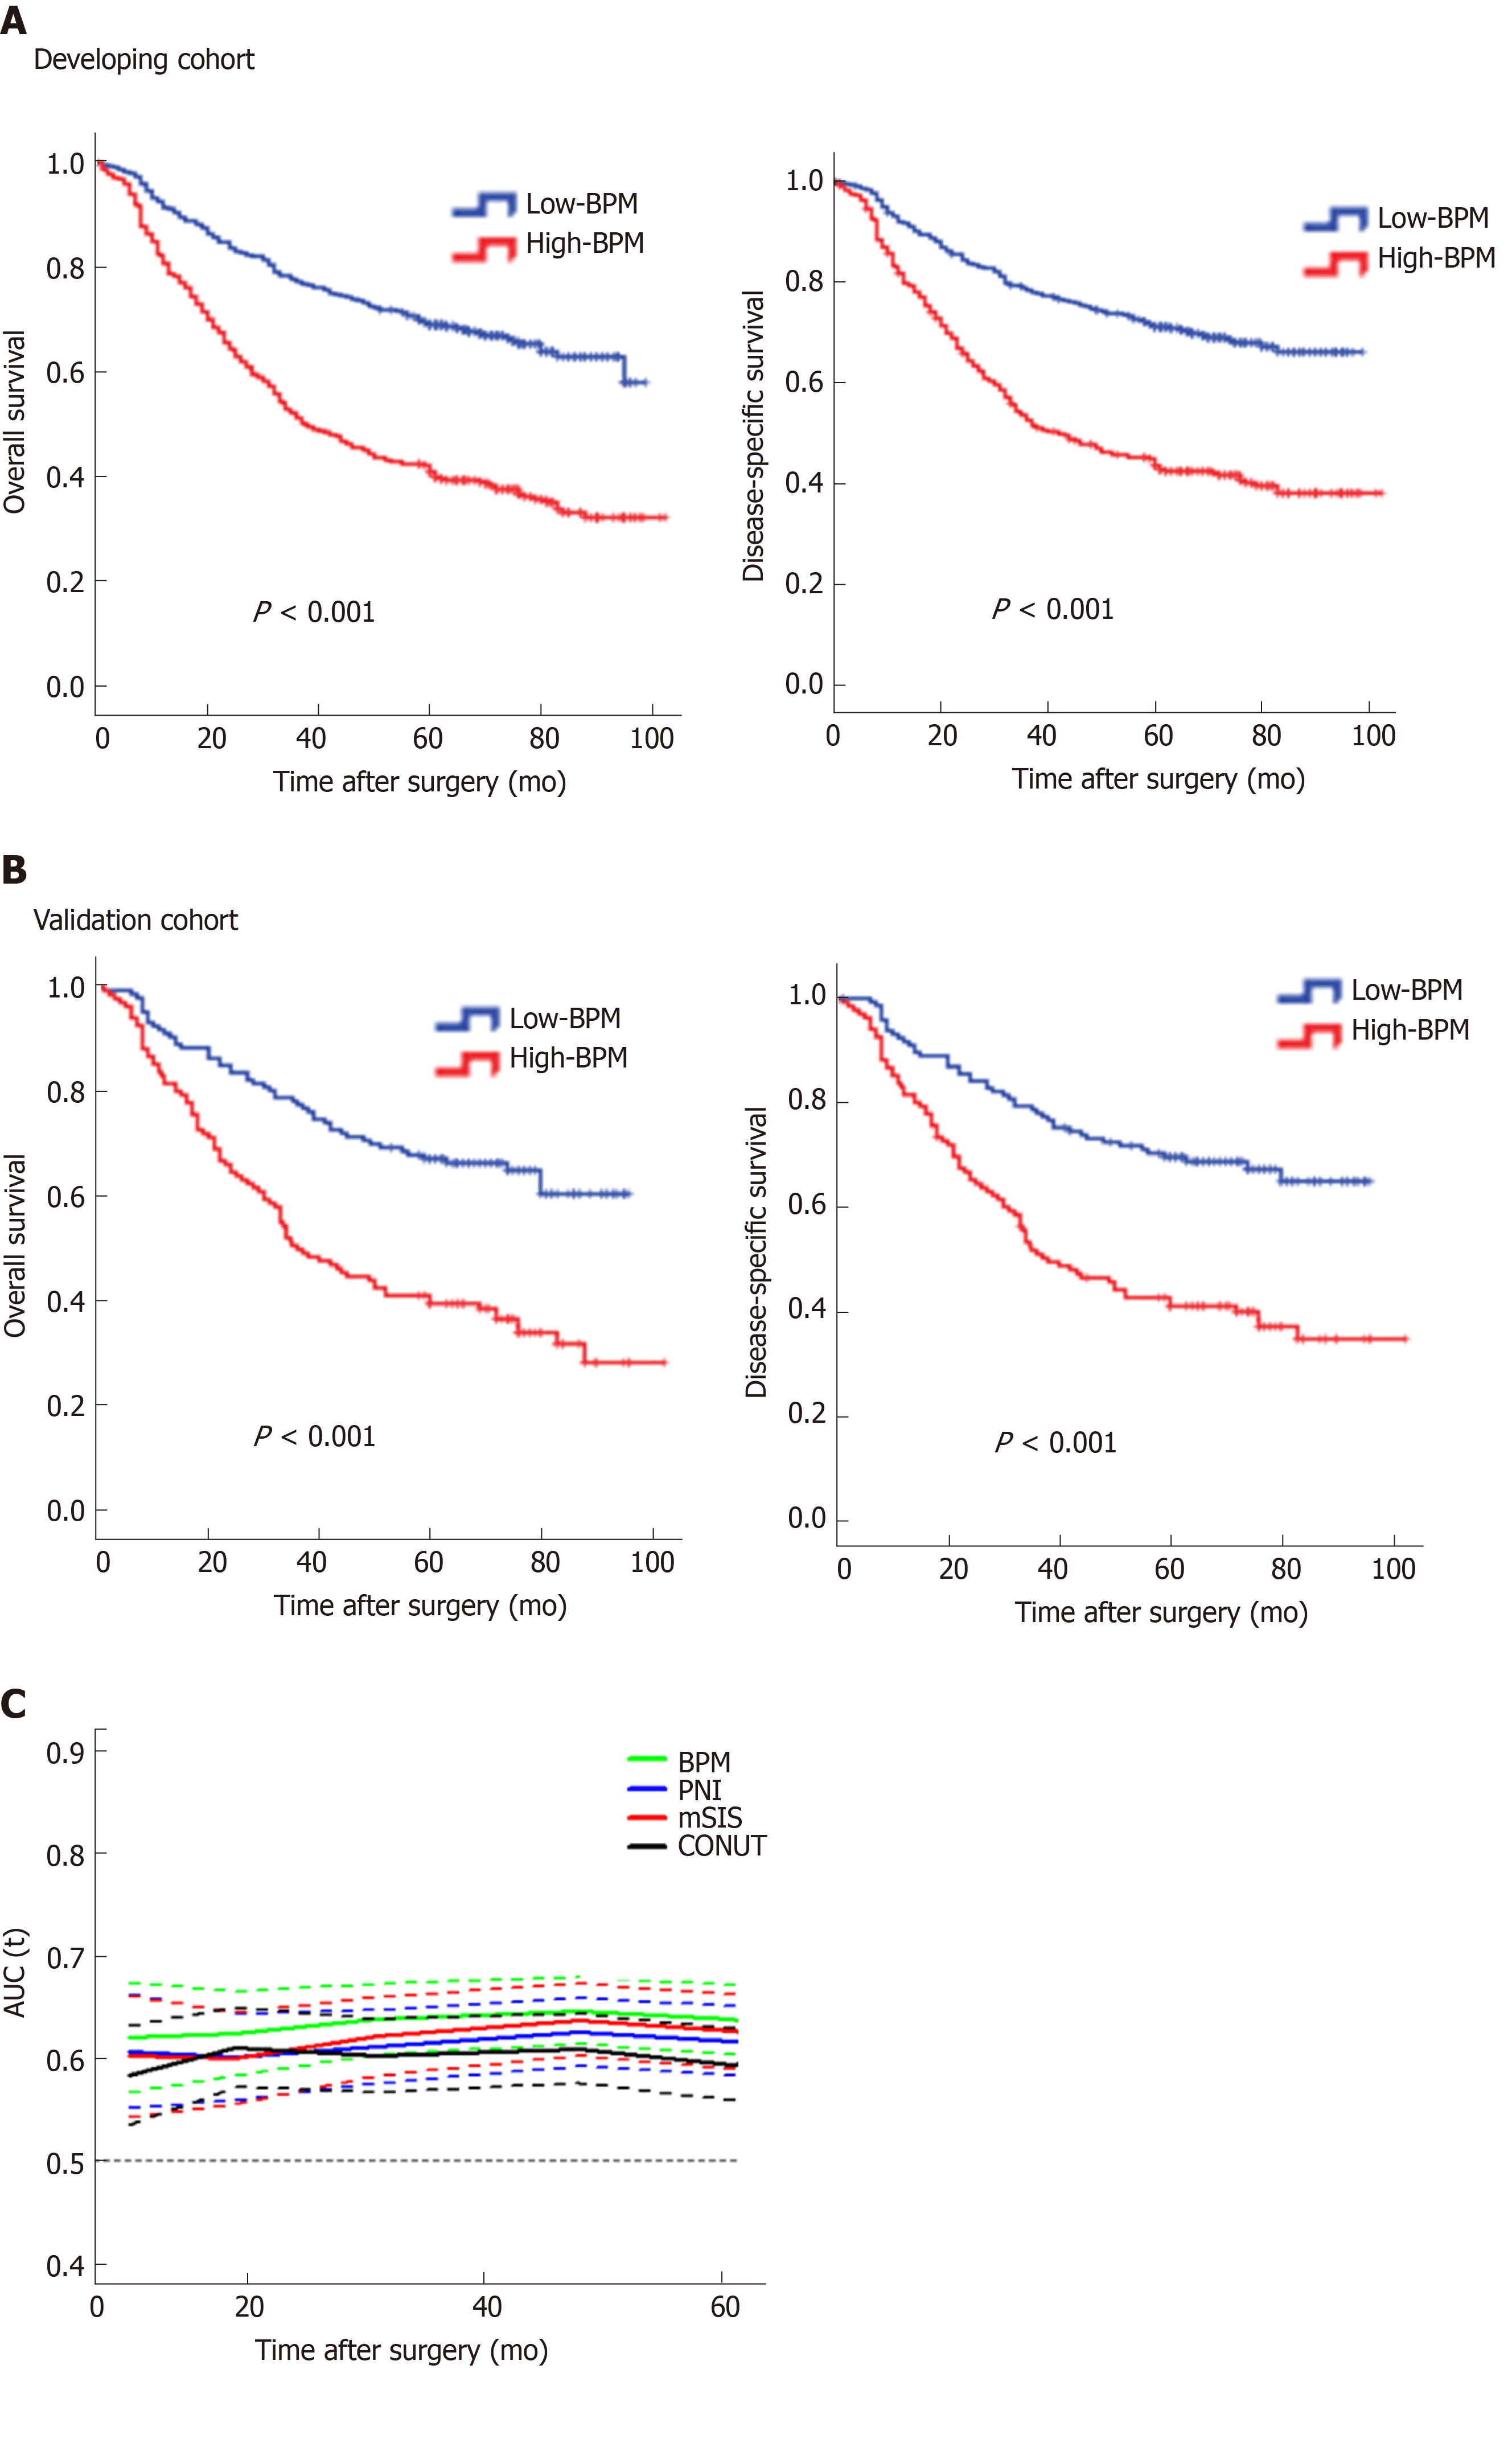
Figure 2 Survival impact of the blood parameters score measured by Kaplan-Meier survival.
A: Survival impact of the blood parameters (BPM) score measured by Kaplan-Meier survival in the developing cohort; B: Survival impact of the BPM score measured by Kaplan-Meier survival in the validation cohort. We calculated P values using the log-rank test; C: Time-dependent receiver operating characteristic curves of BPM score, prognostic nutritional index (PNI), controlling nutritional status (CONUT), and modified systemic inflammation score (mSIS) for the prediction of overall survival. PNI indicates prognostic nutritional index calculated as follows: 10 × serum albumin (g/L) + 0.005 × lymphocyte count (/mm3). CONUT indicates controlling nutritional status, a scoring system calculated by summing the value of serum albumin, total cholesterol, and total lymphocyte count. mSIS indicates modified systemic inflammation score developed based on serum albumin and lymphocyte-monocyte ratio. PNI: Prognostic nutritional index; CONUT: Controlling nutritional status; mSIS: Modified systemic inflammation score; BPM: Blood parameters.
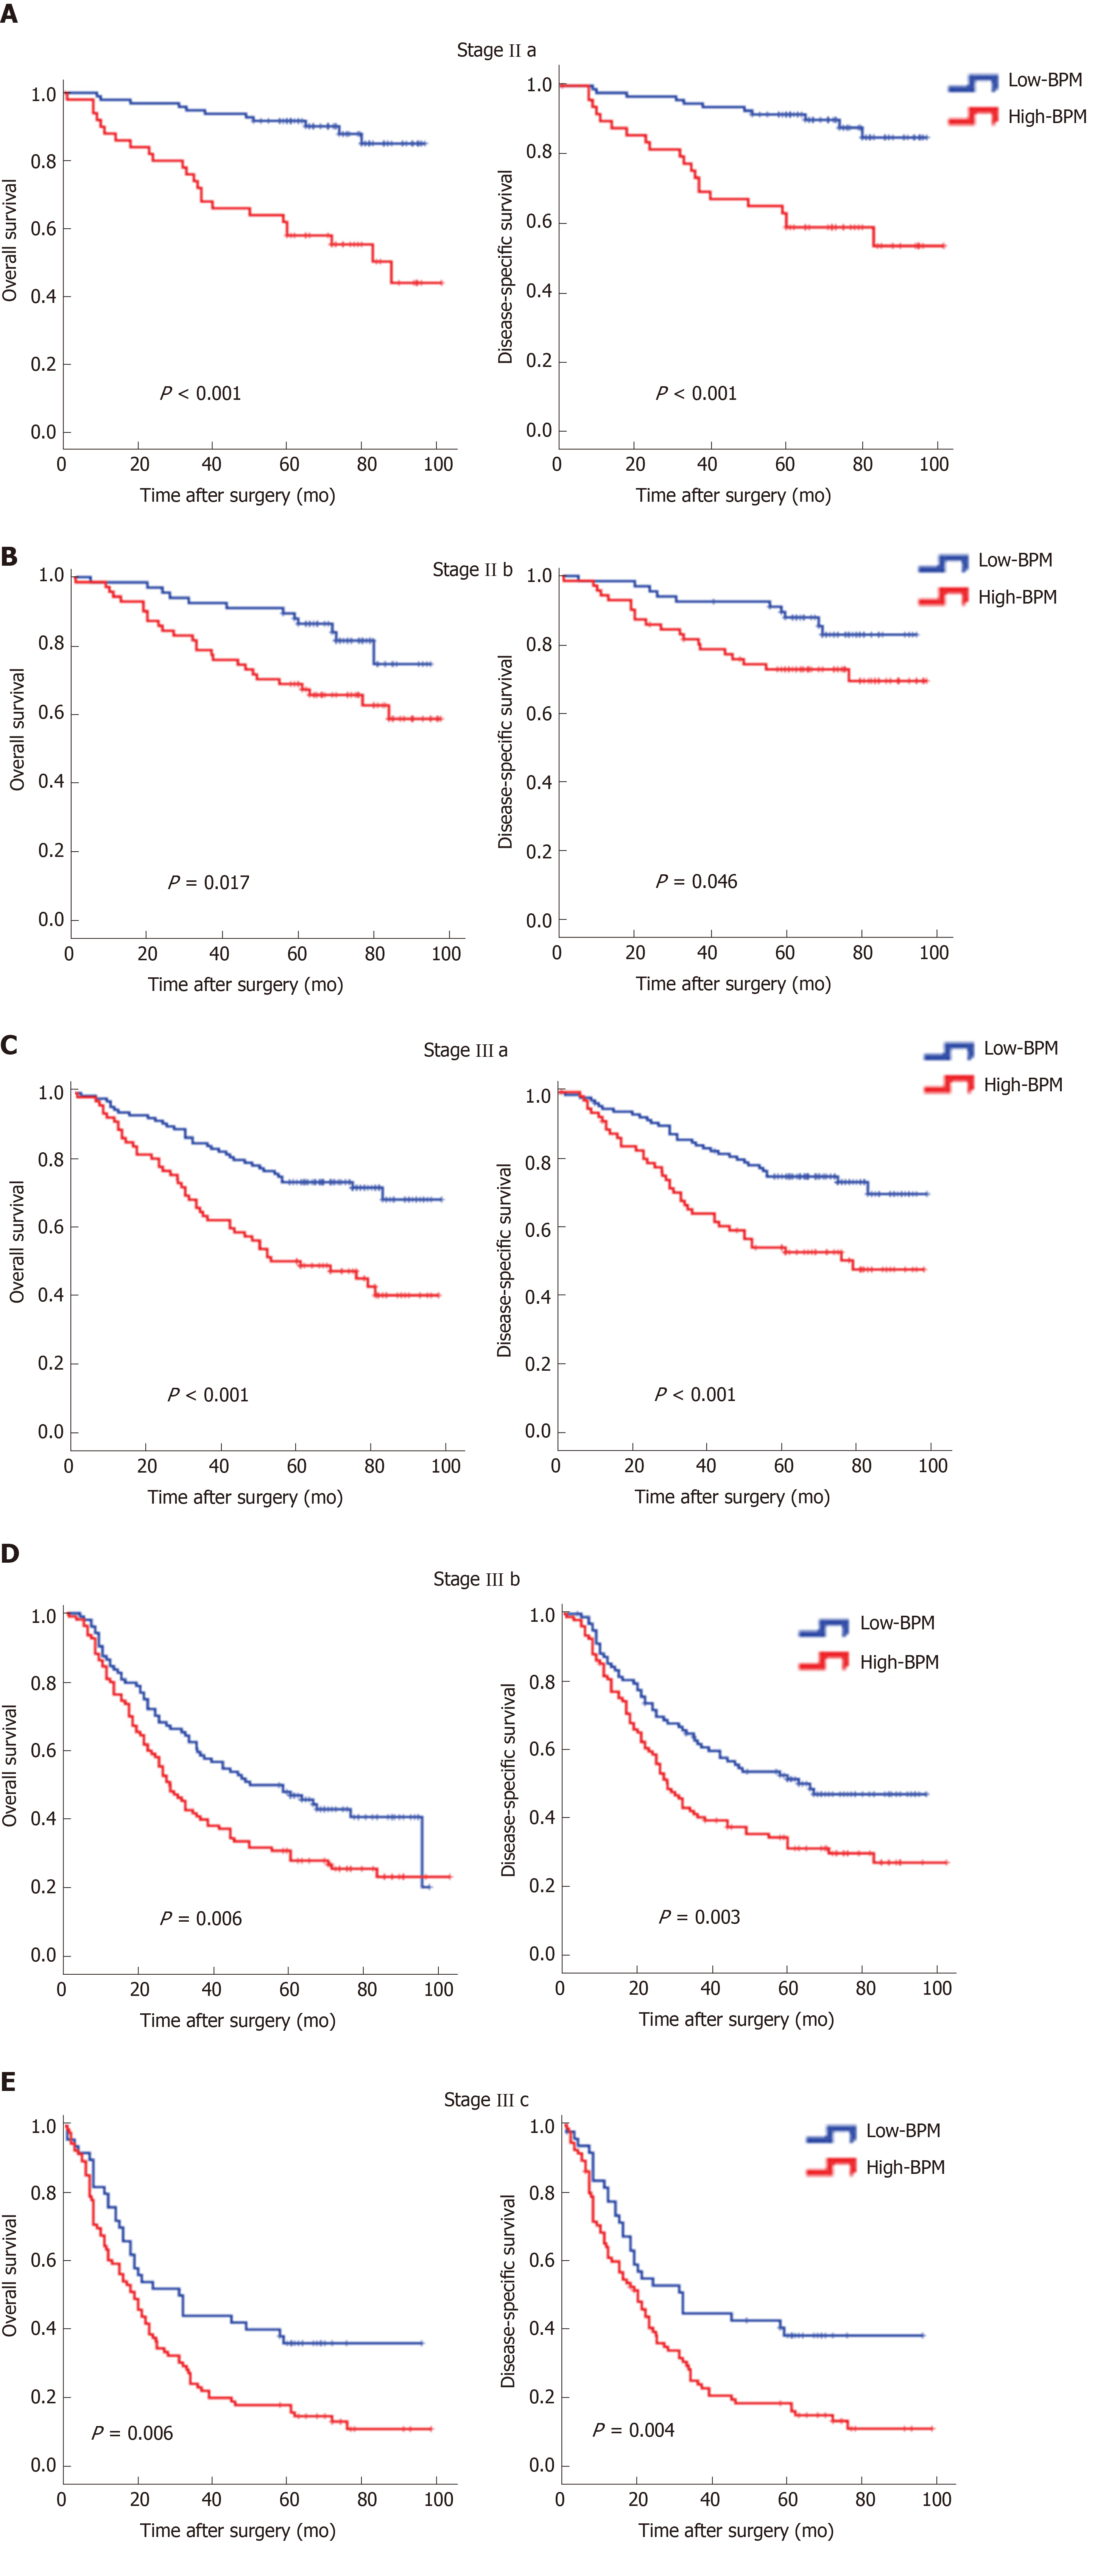
Figure 3 Kaplan-Meier curves for overall survival and disease-specific survival in the high-blood parameters or low-blood parameters groups for different stages.
A: Stage IIa; B: Stage IIb; C: Stage IIIa; D: Stage IIIb; E: Stage IIIc. BPM: Blood parameters.
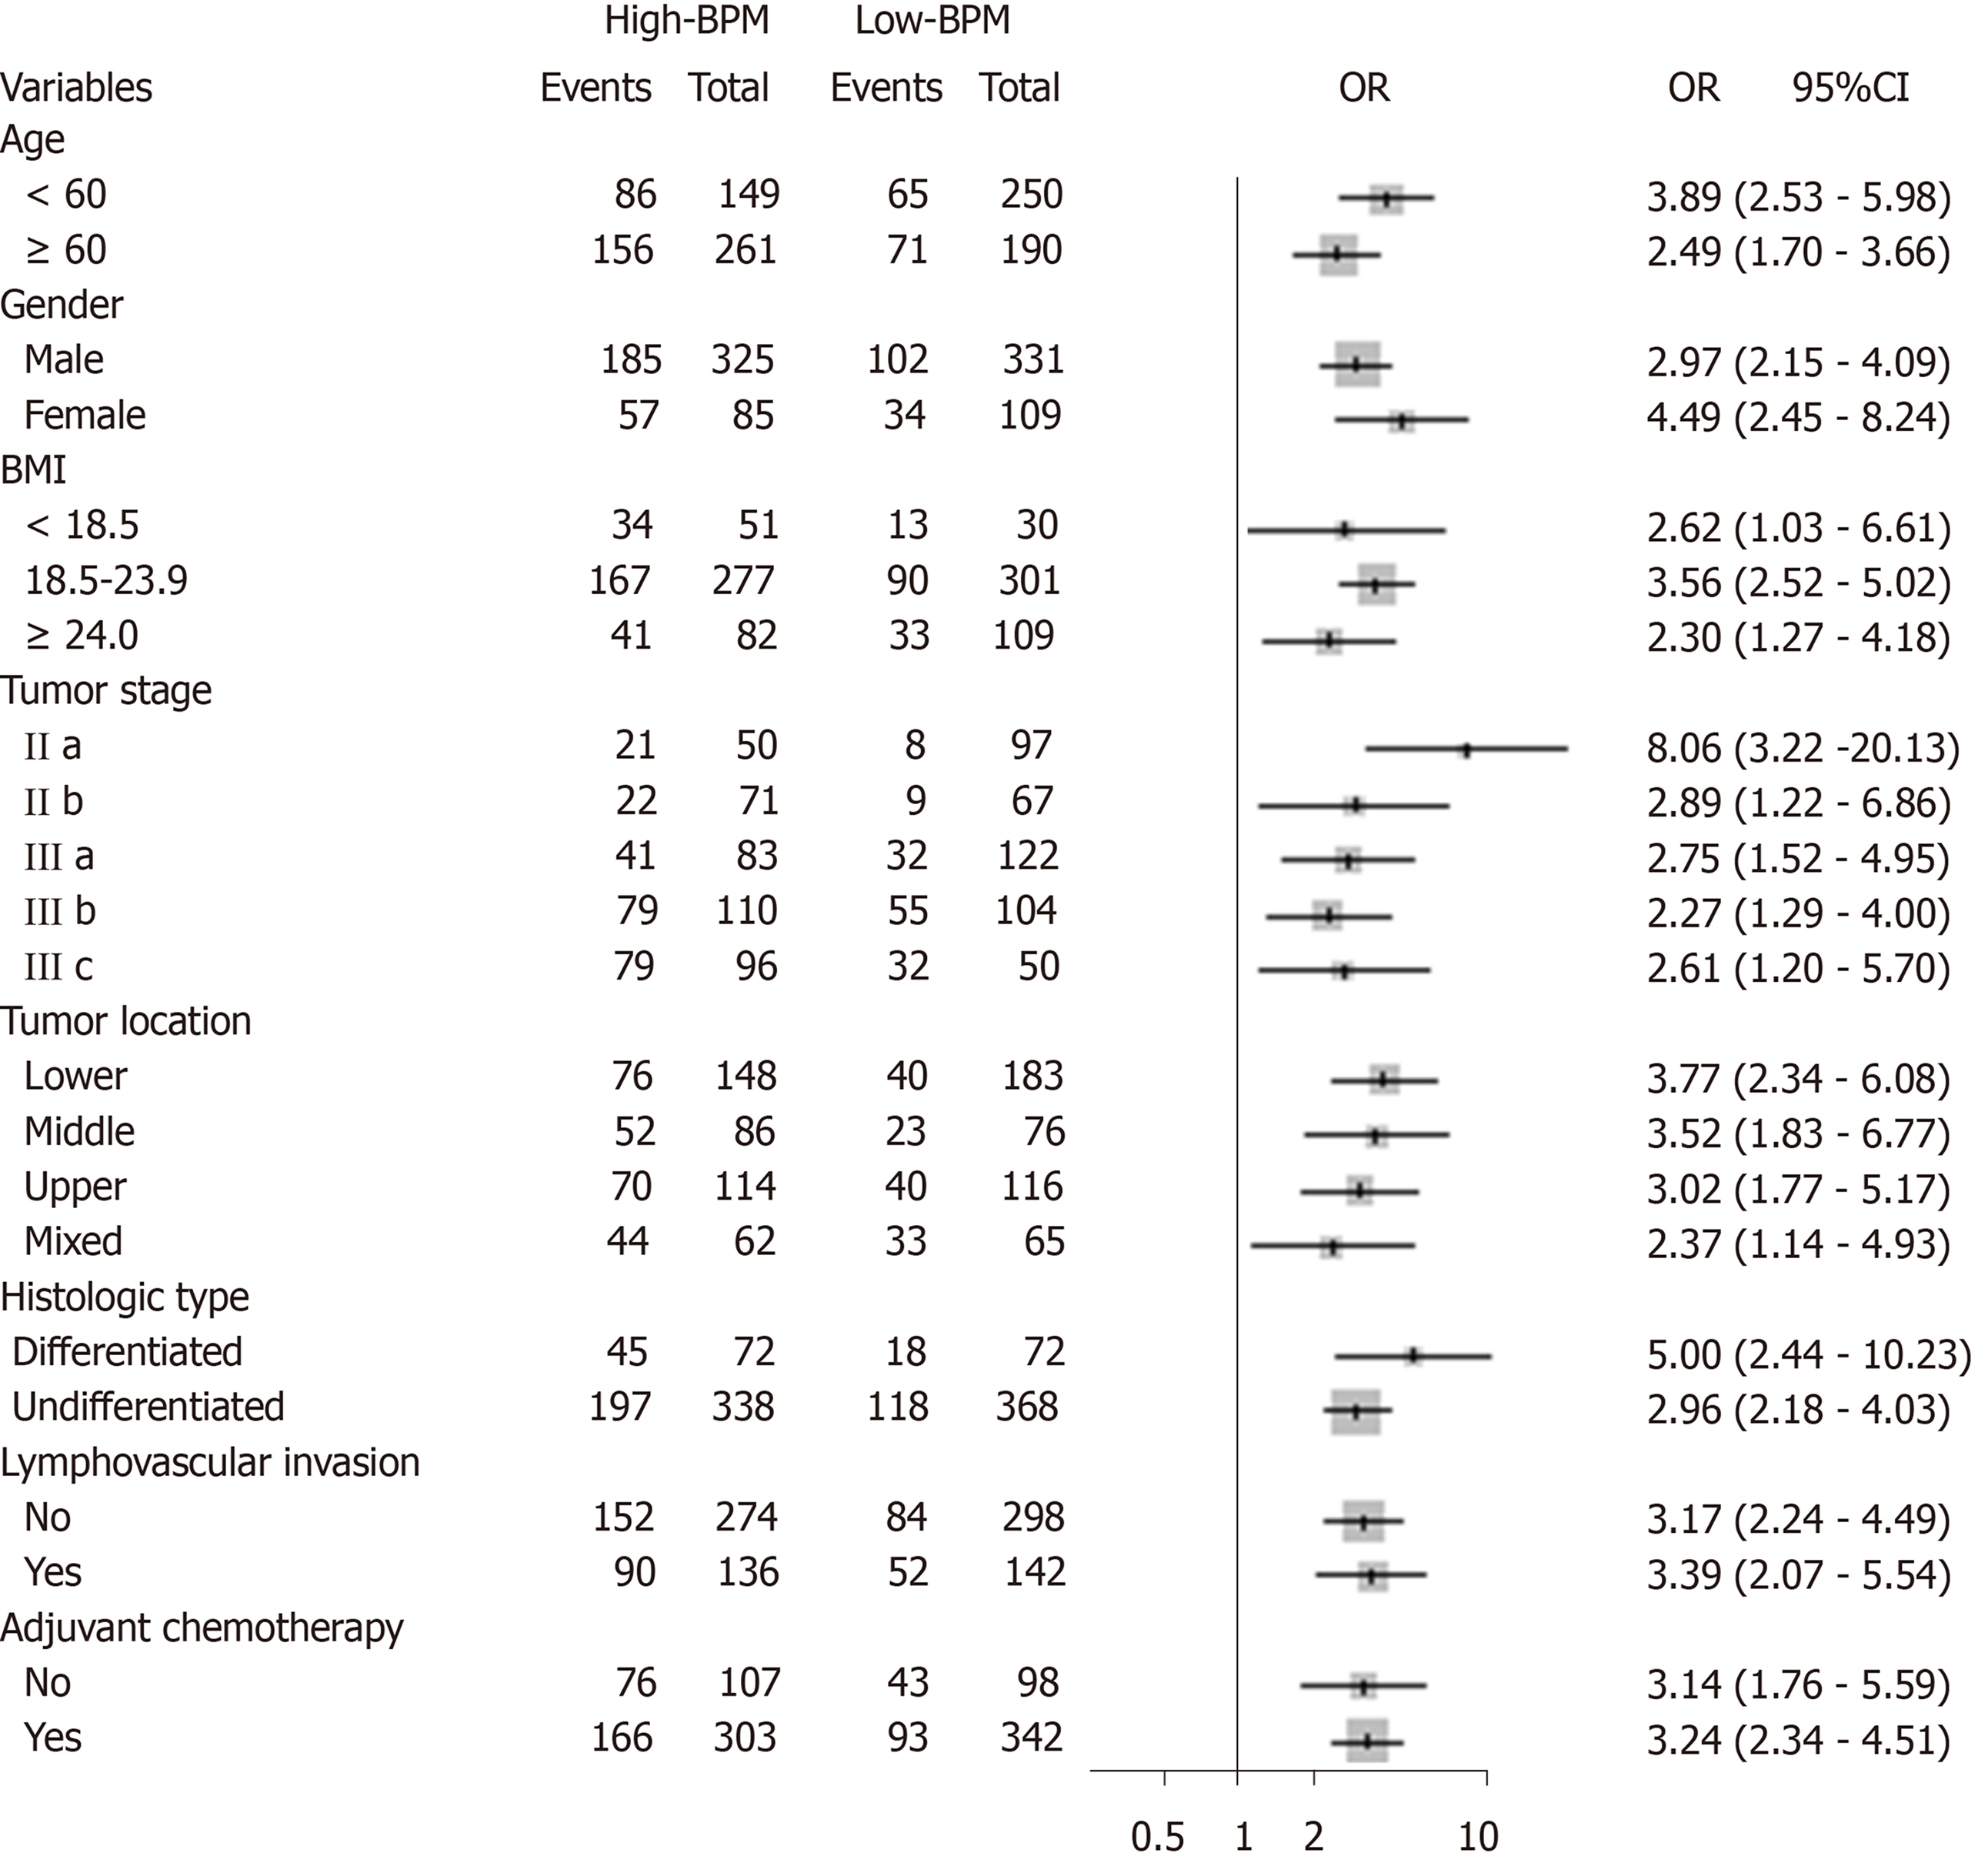
Figure 4 Forest plot showing the impact of blood parameters score on 5-year overall survival stratified by different clinicopathological factors.
Odds ratios with 95% confidence intervals are shown for the high-blood parameters (BPM) group vs low-BPM group. CI: Confidence interval; OR: Odds ratios; BMI: Body mass index; BPM: Blood parameters.
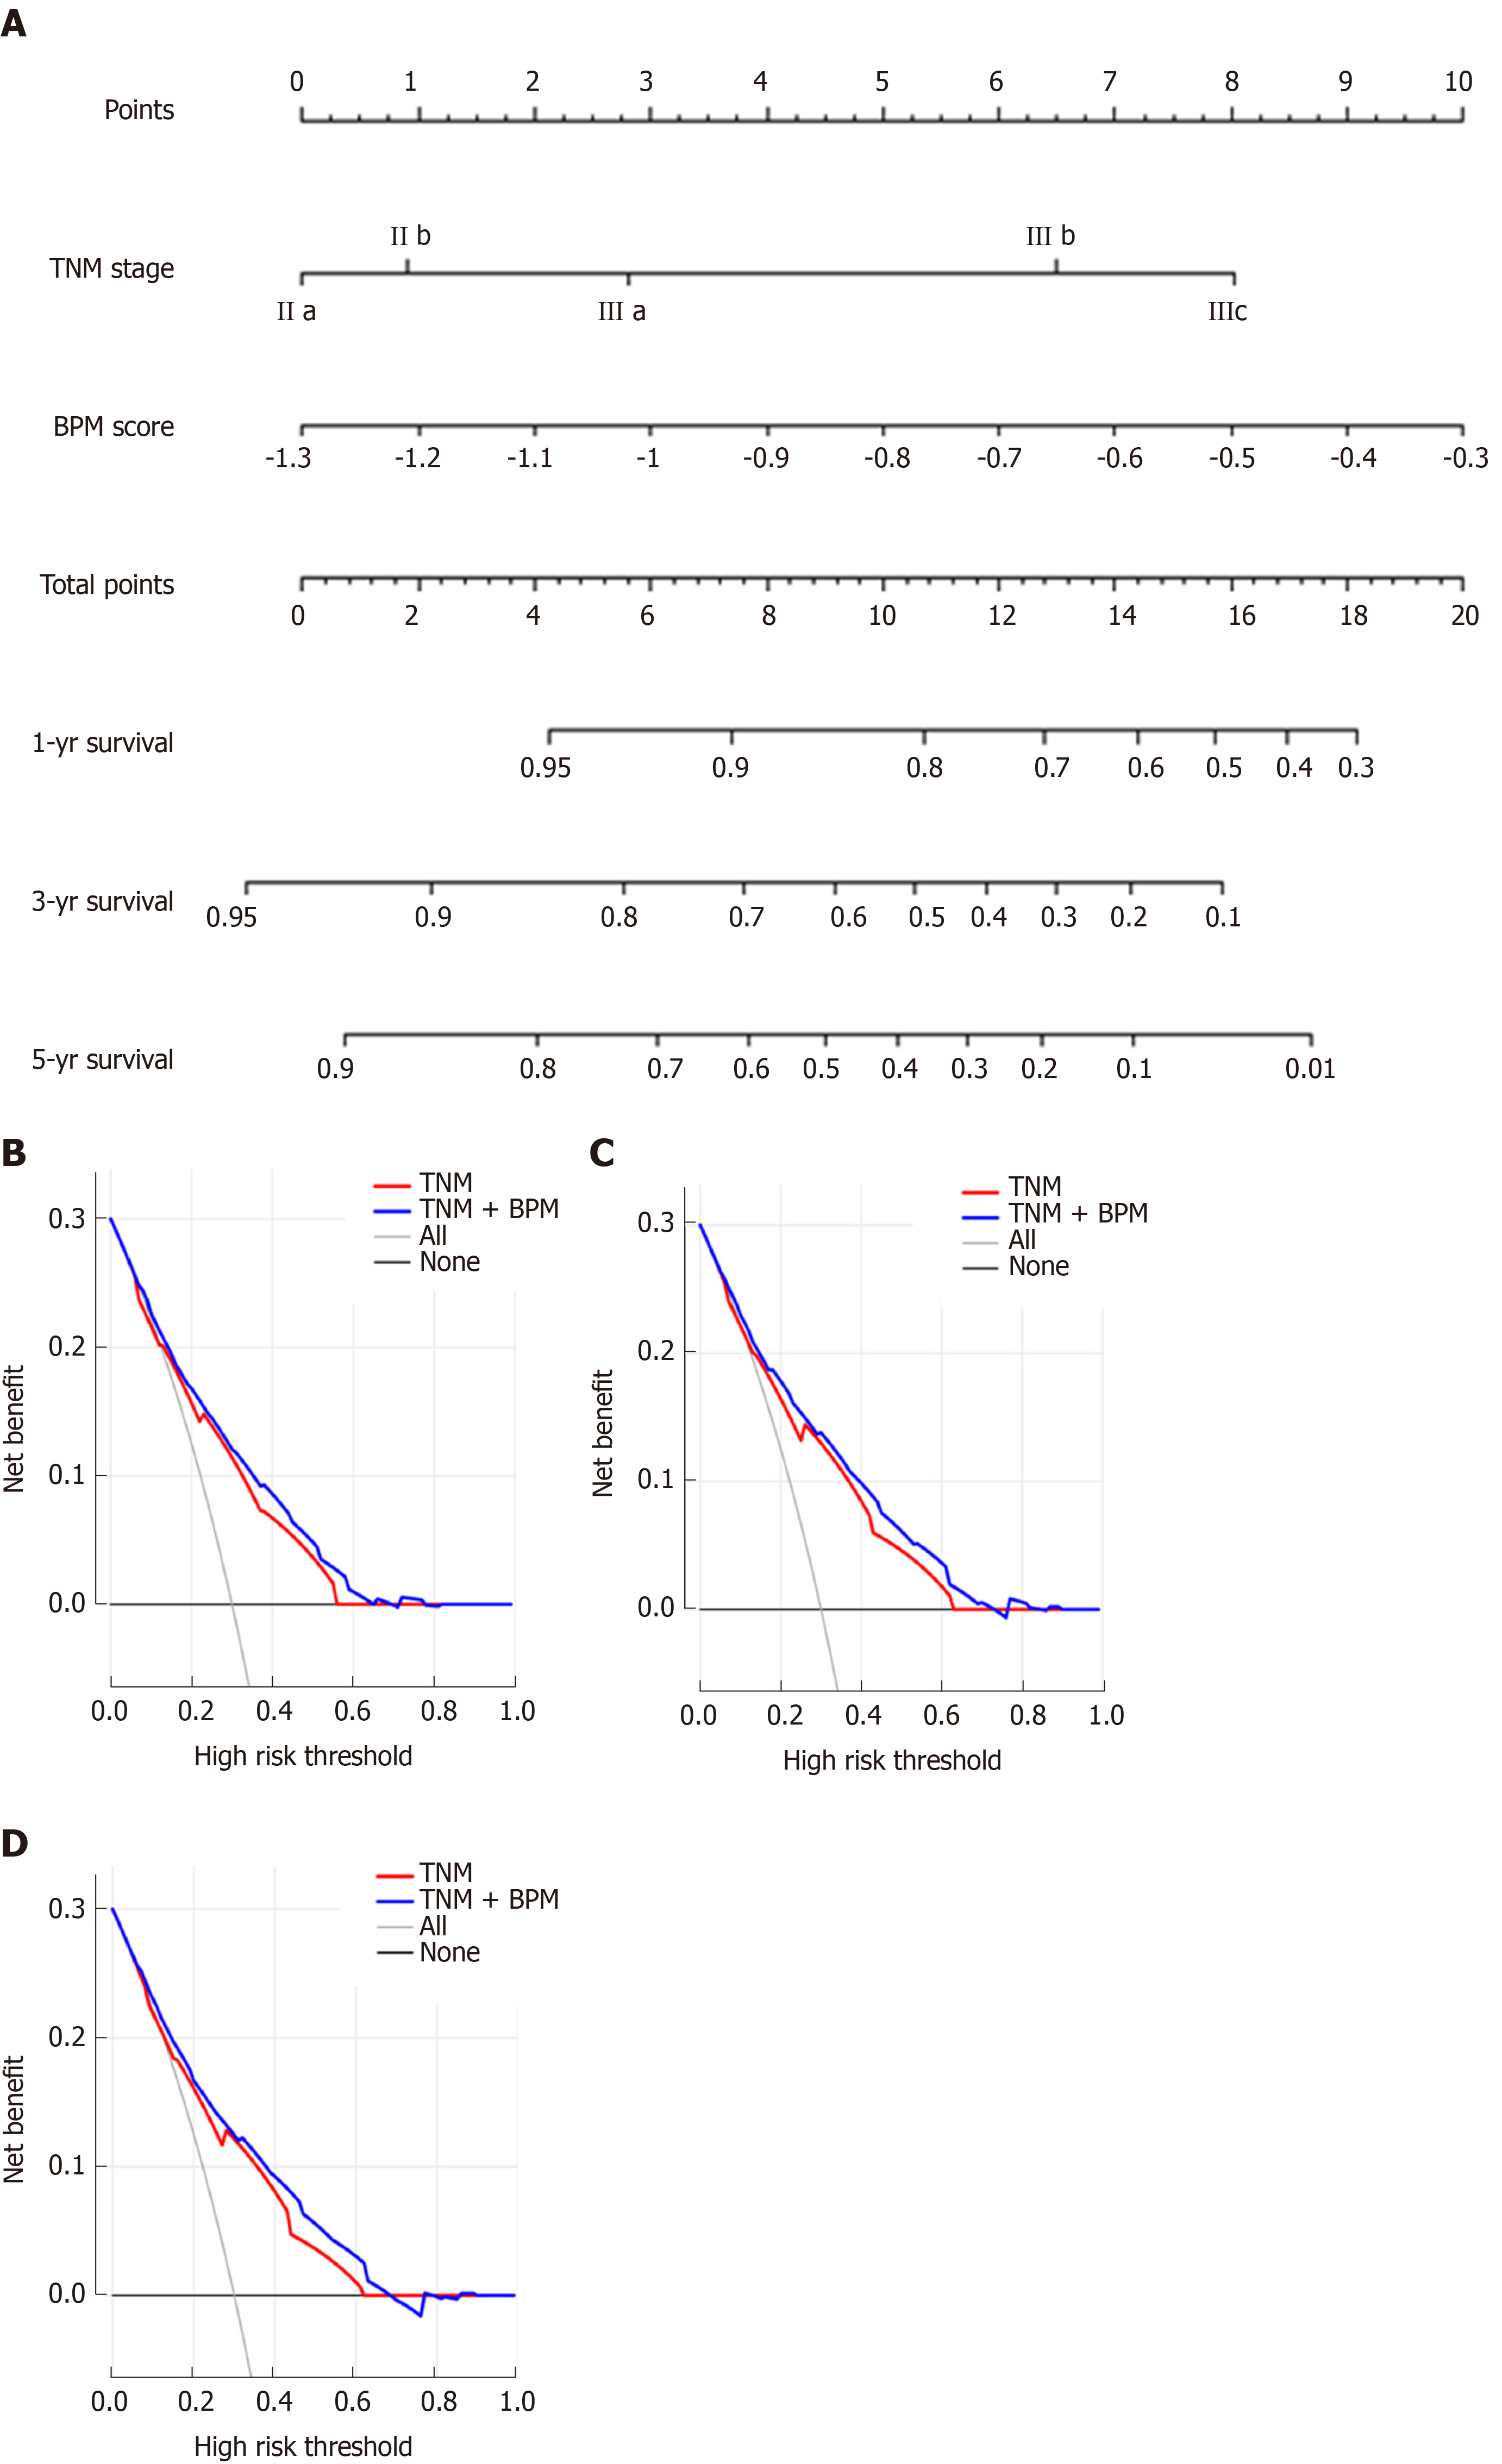
Figure 5 Prediction and analysis of 1-, 3-, and 5-year overall survival in patients.
A: A nomogram combining blood parameters score and tumor-lymph node-metastasis stage for predicting 1-, 3-, and 5-year overall survival (OS) in patients with stage II-III gastric cancer; B: Decision curve analysis of the nomogram for 1-year OS; C: Decision curve analysis of the nomogram for 3-year OS; D: Decision curve analysis of the nomogram for 5-year OS. TNM: Tumor-lymph node-metastasis; BPM: Blood parameters.
- Citation: Lin JX, Tang YH, Wang JB, Lu J, Chen QY, Cao LL, Lin M, Tu RH, Huang CM, Li P, Zheng CH, Xie JW. Blood parameters score predicts long-term outcomes in stage II-III gastric cancer patients. World J Gastroenterol 2019; 25(41): 6258-6272
- URL: https://www.wjgnet.com/1007-9327/full/v25/i41/6258.htm
- DOI: https://dx.doi.org/10.3748/wjg.v25.i41.6258


