Copyright
©The Author(s) 2019.
World J Gastroenterol. Oct 7, 2019; 25(37): 5655-5666
Published online Oct 7, 2019. doi: 10.3748/wjg.v25.i37.5655
Published online Oct 7, 2019. doi: 10.3748/wjg.v25.i37.5655
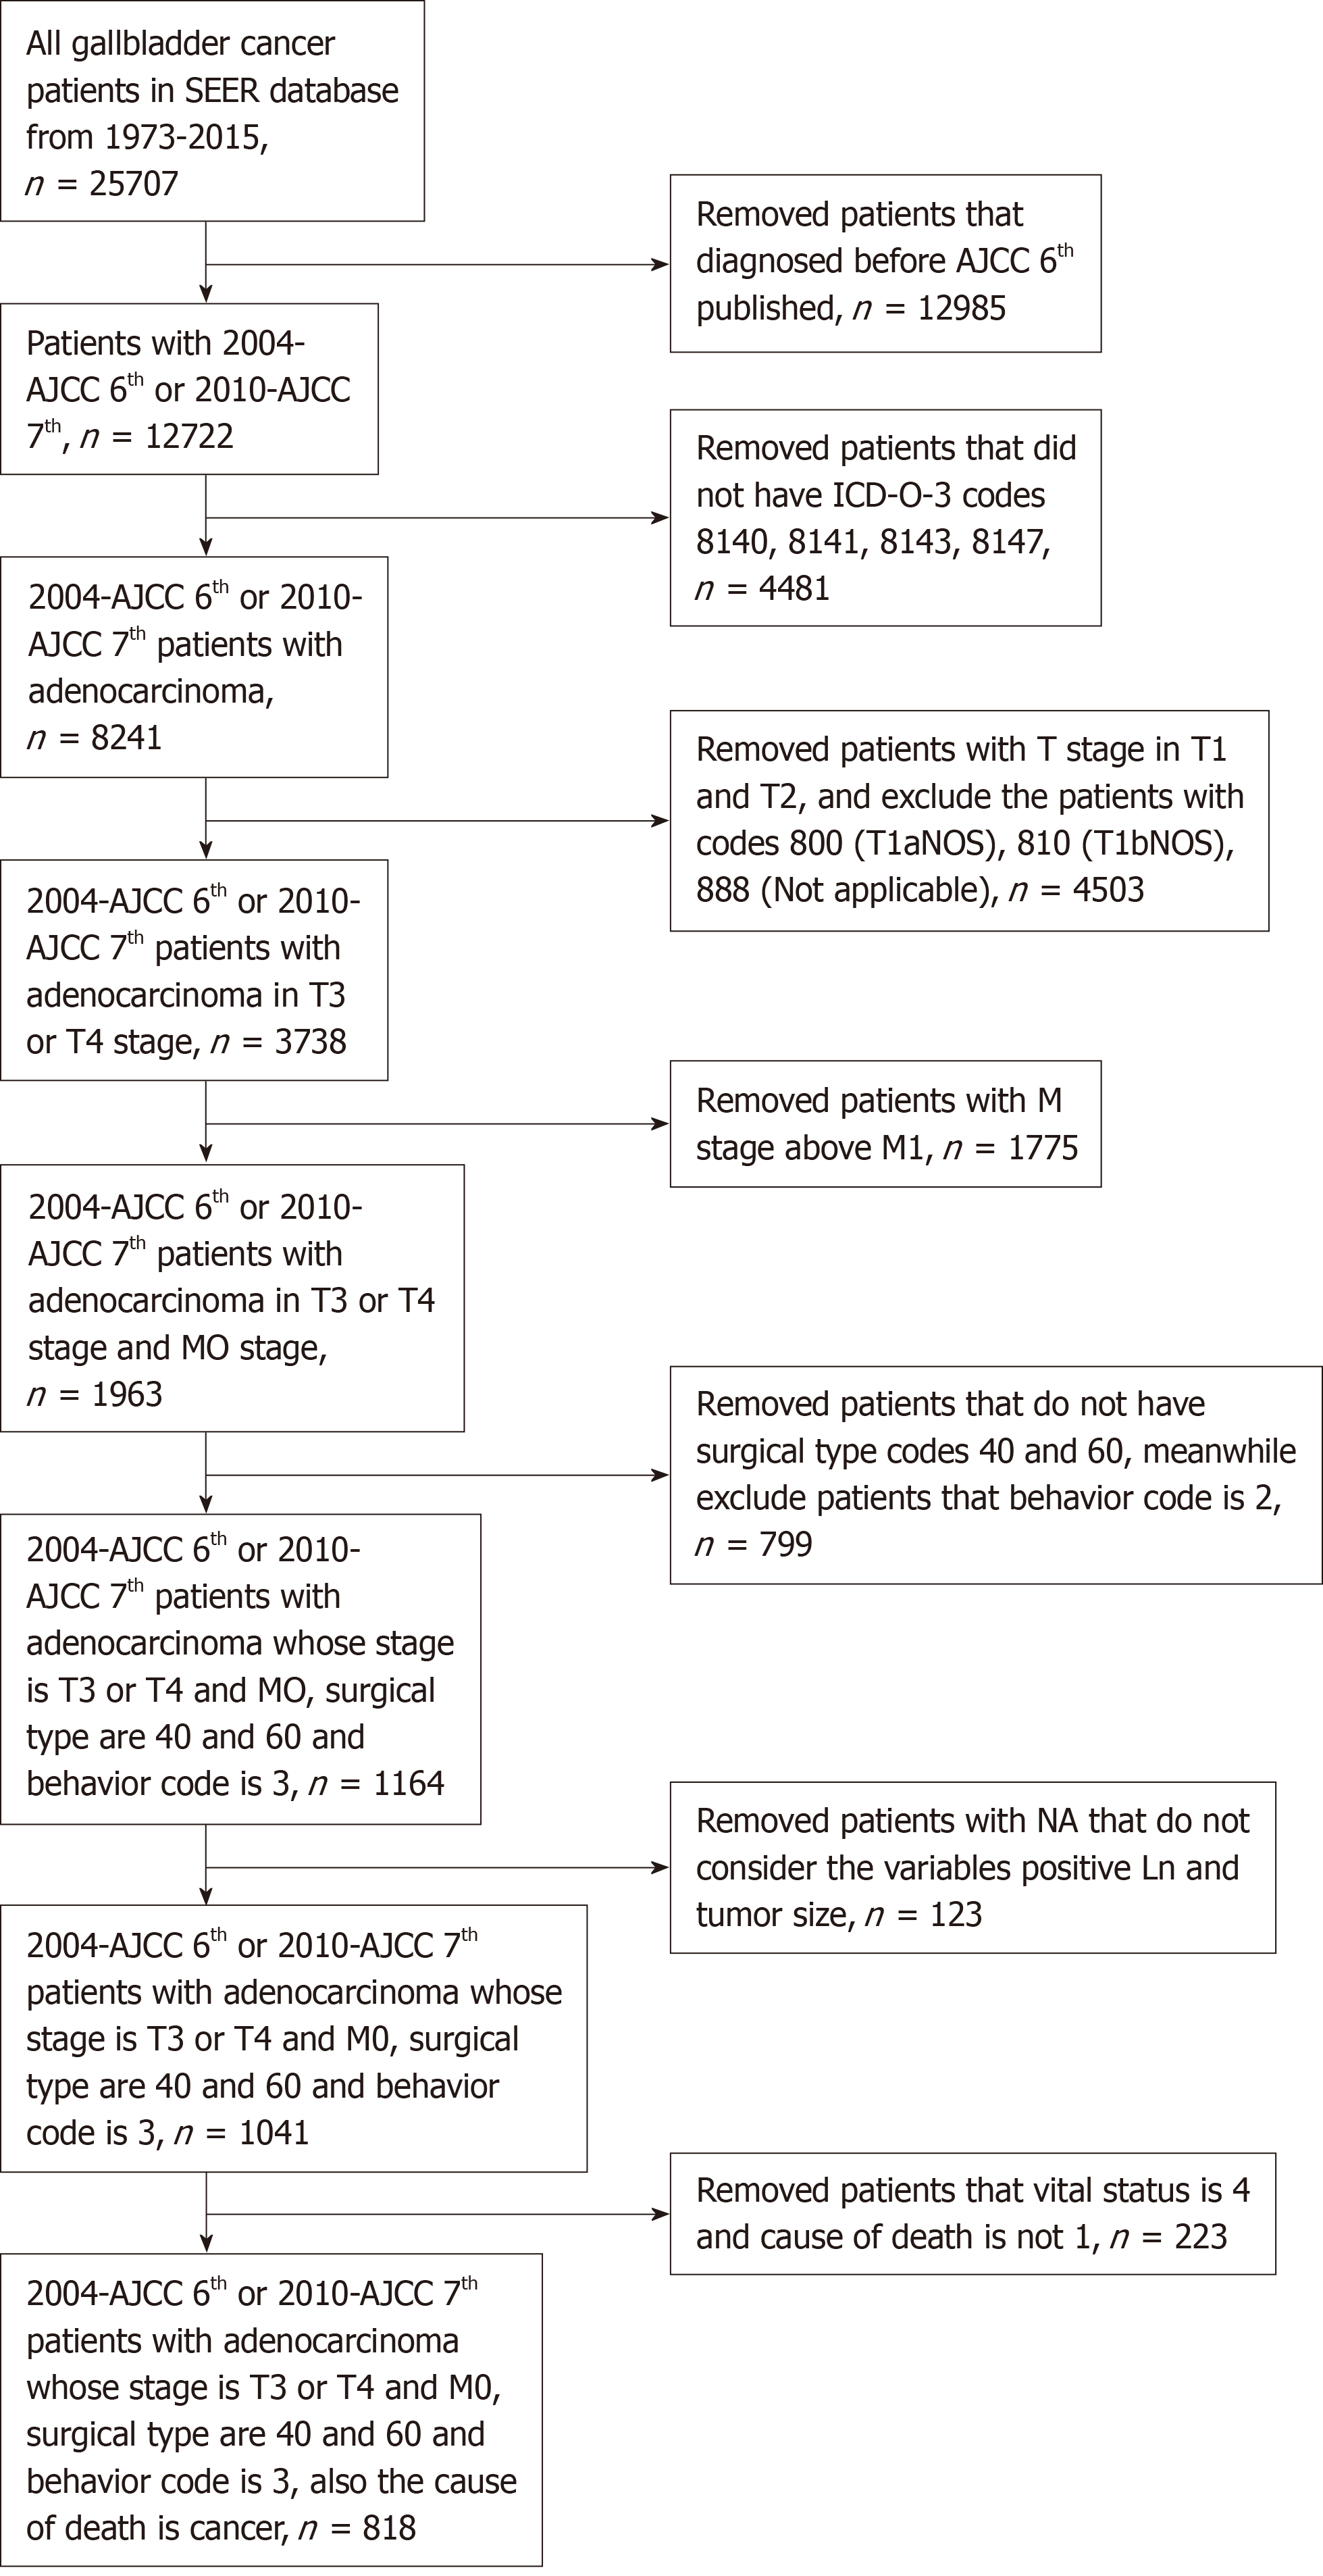
Figure 1 Patient selection flowchart.
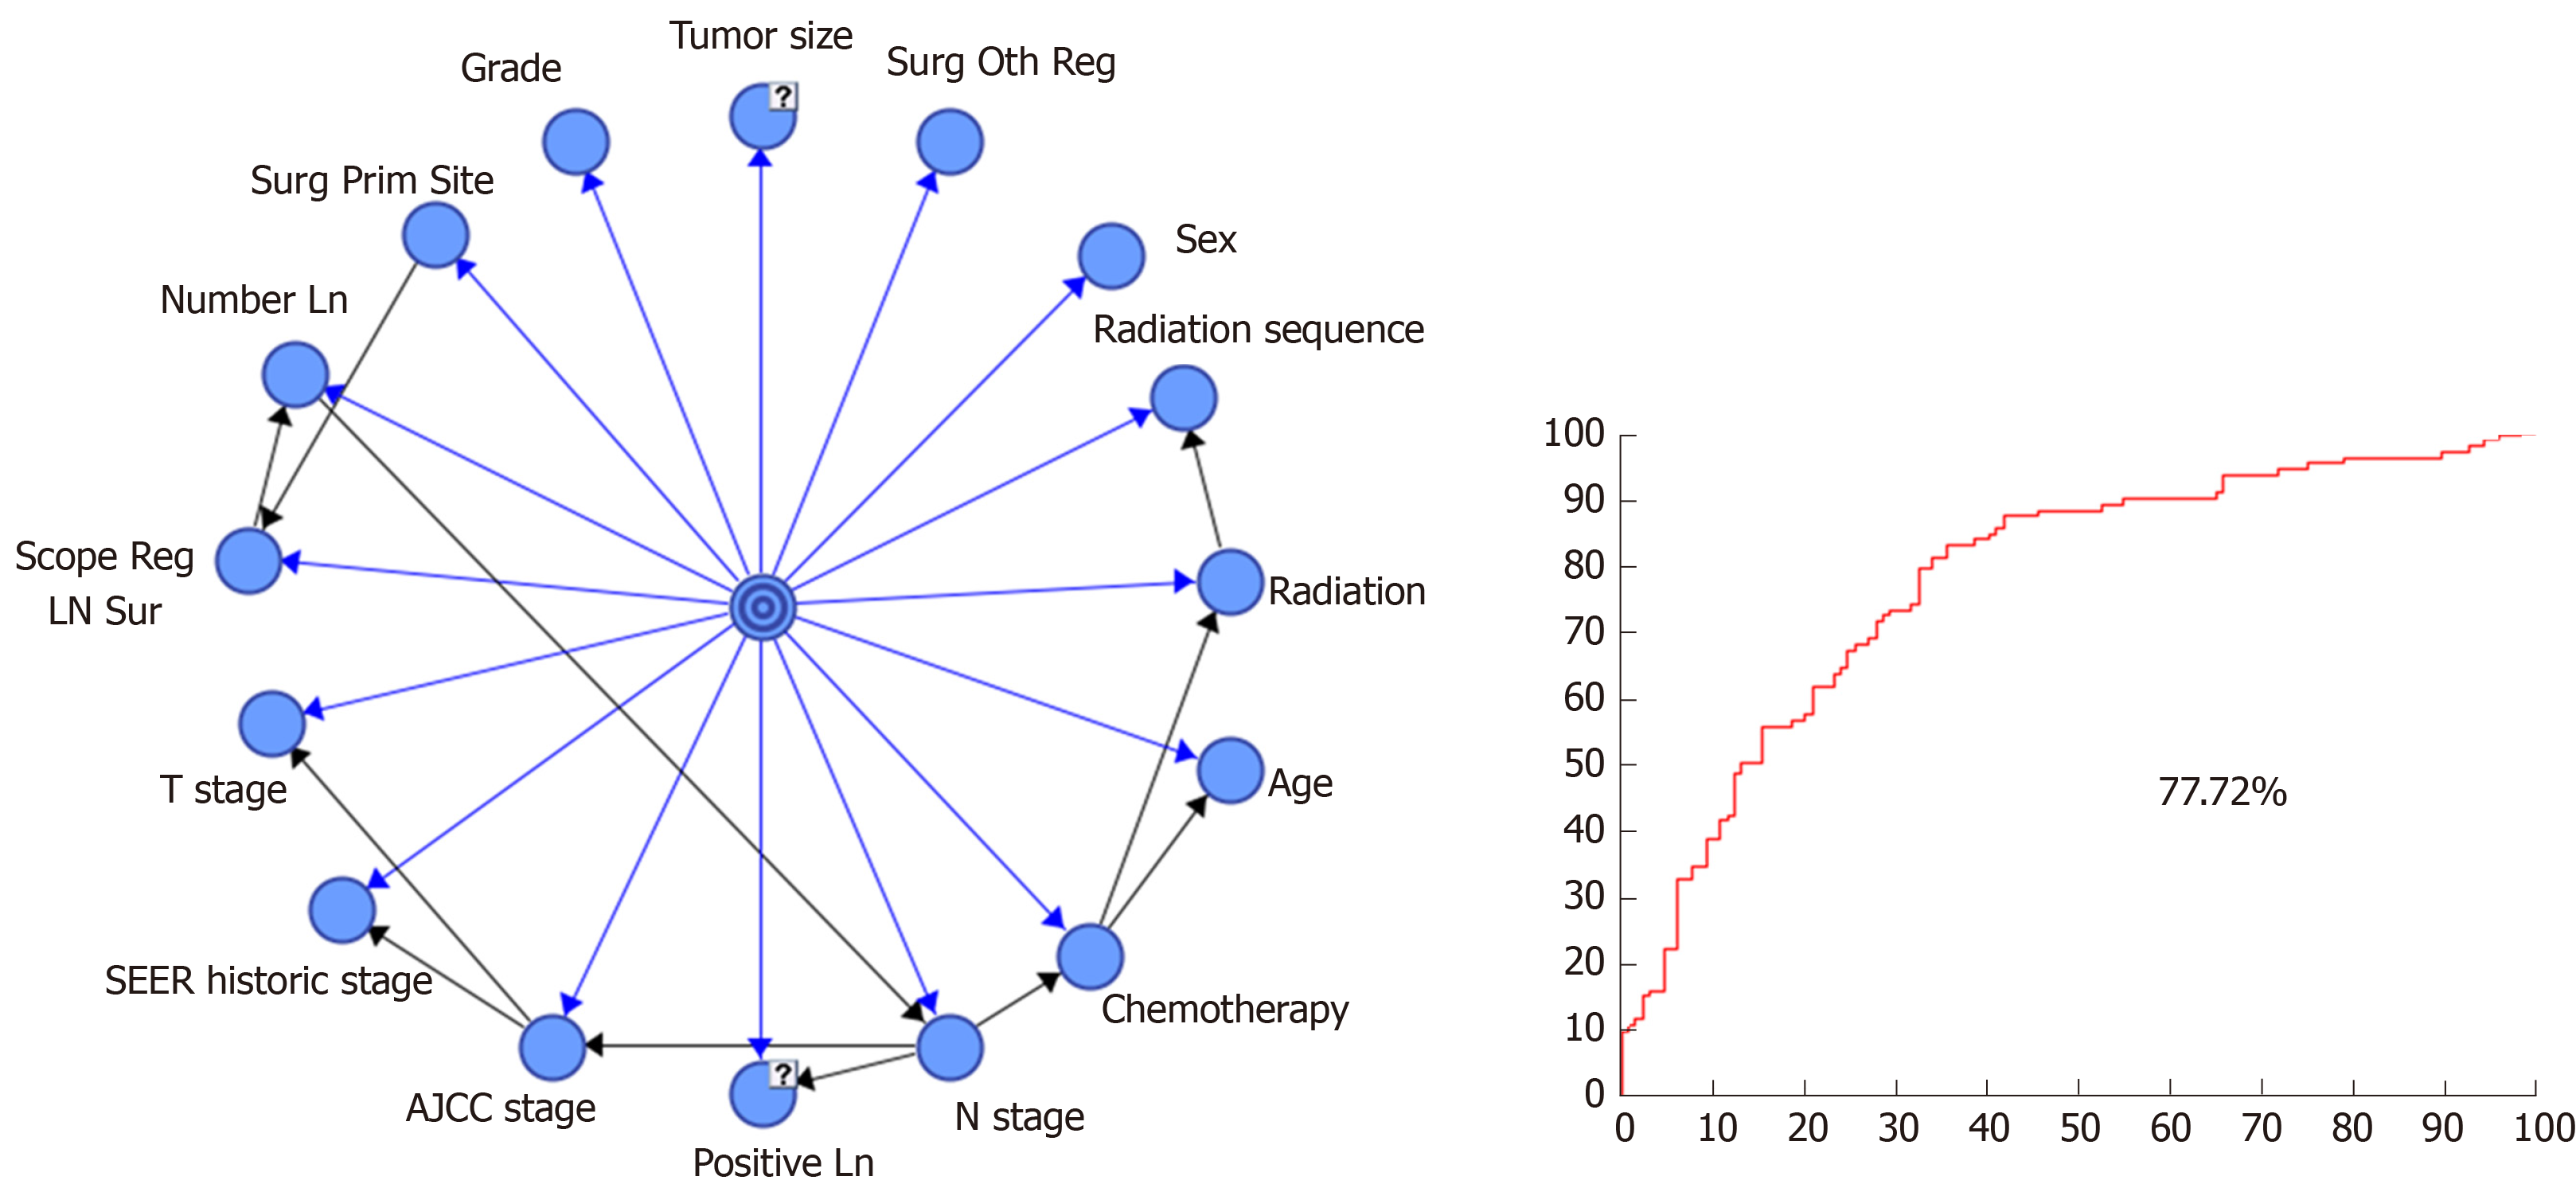
Figure 2 Bayesian network model for advanced gallbladder adenocarcinoma patients after radical resection and the receiver operating characteristic curve for survival time ≤ 9 mo of the bayesian network model.
“?” means that the variable has not available values, and we use Structural Expectation-maximization algorithm to imput the not available values in the dataset. Blue lines represent the relationship between the attribute variable and the target variable. Black lines represent the relationship between the attribute variables. BN: Bayesian network; SEER: Surveillance, Epidemiology, and End Results; AJCC: American Joint Committee on Cancer.
Figure formula
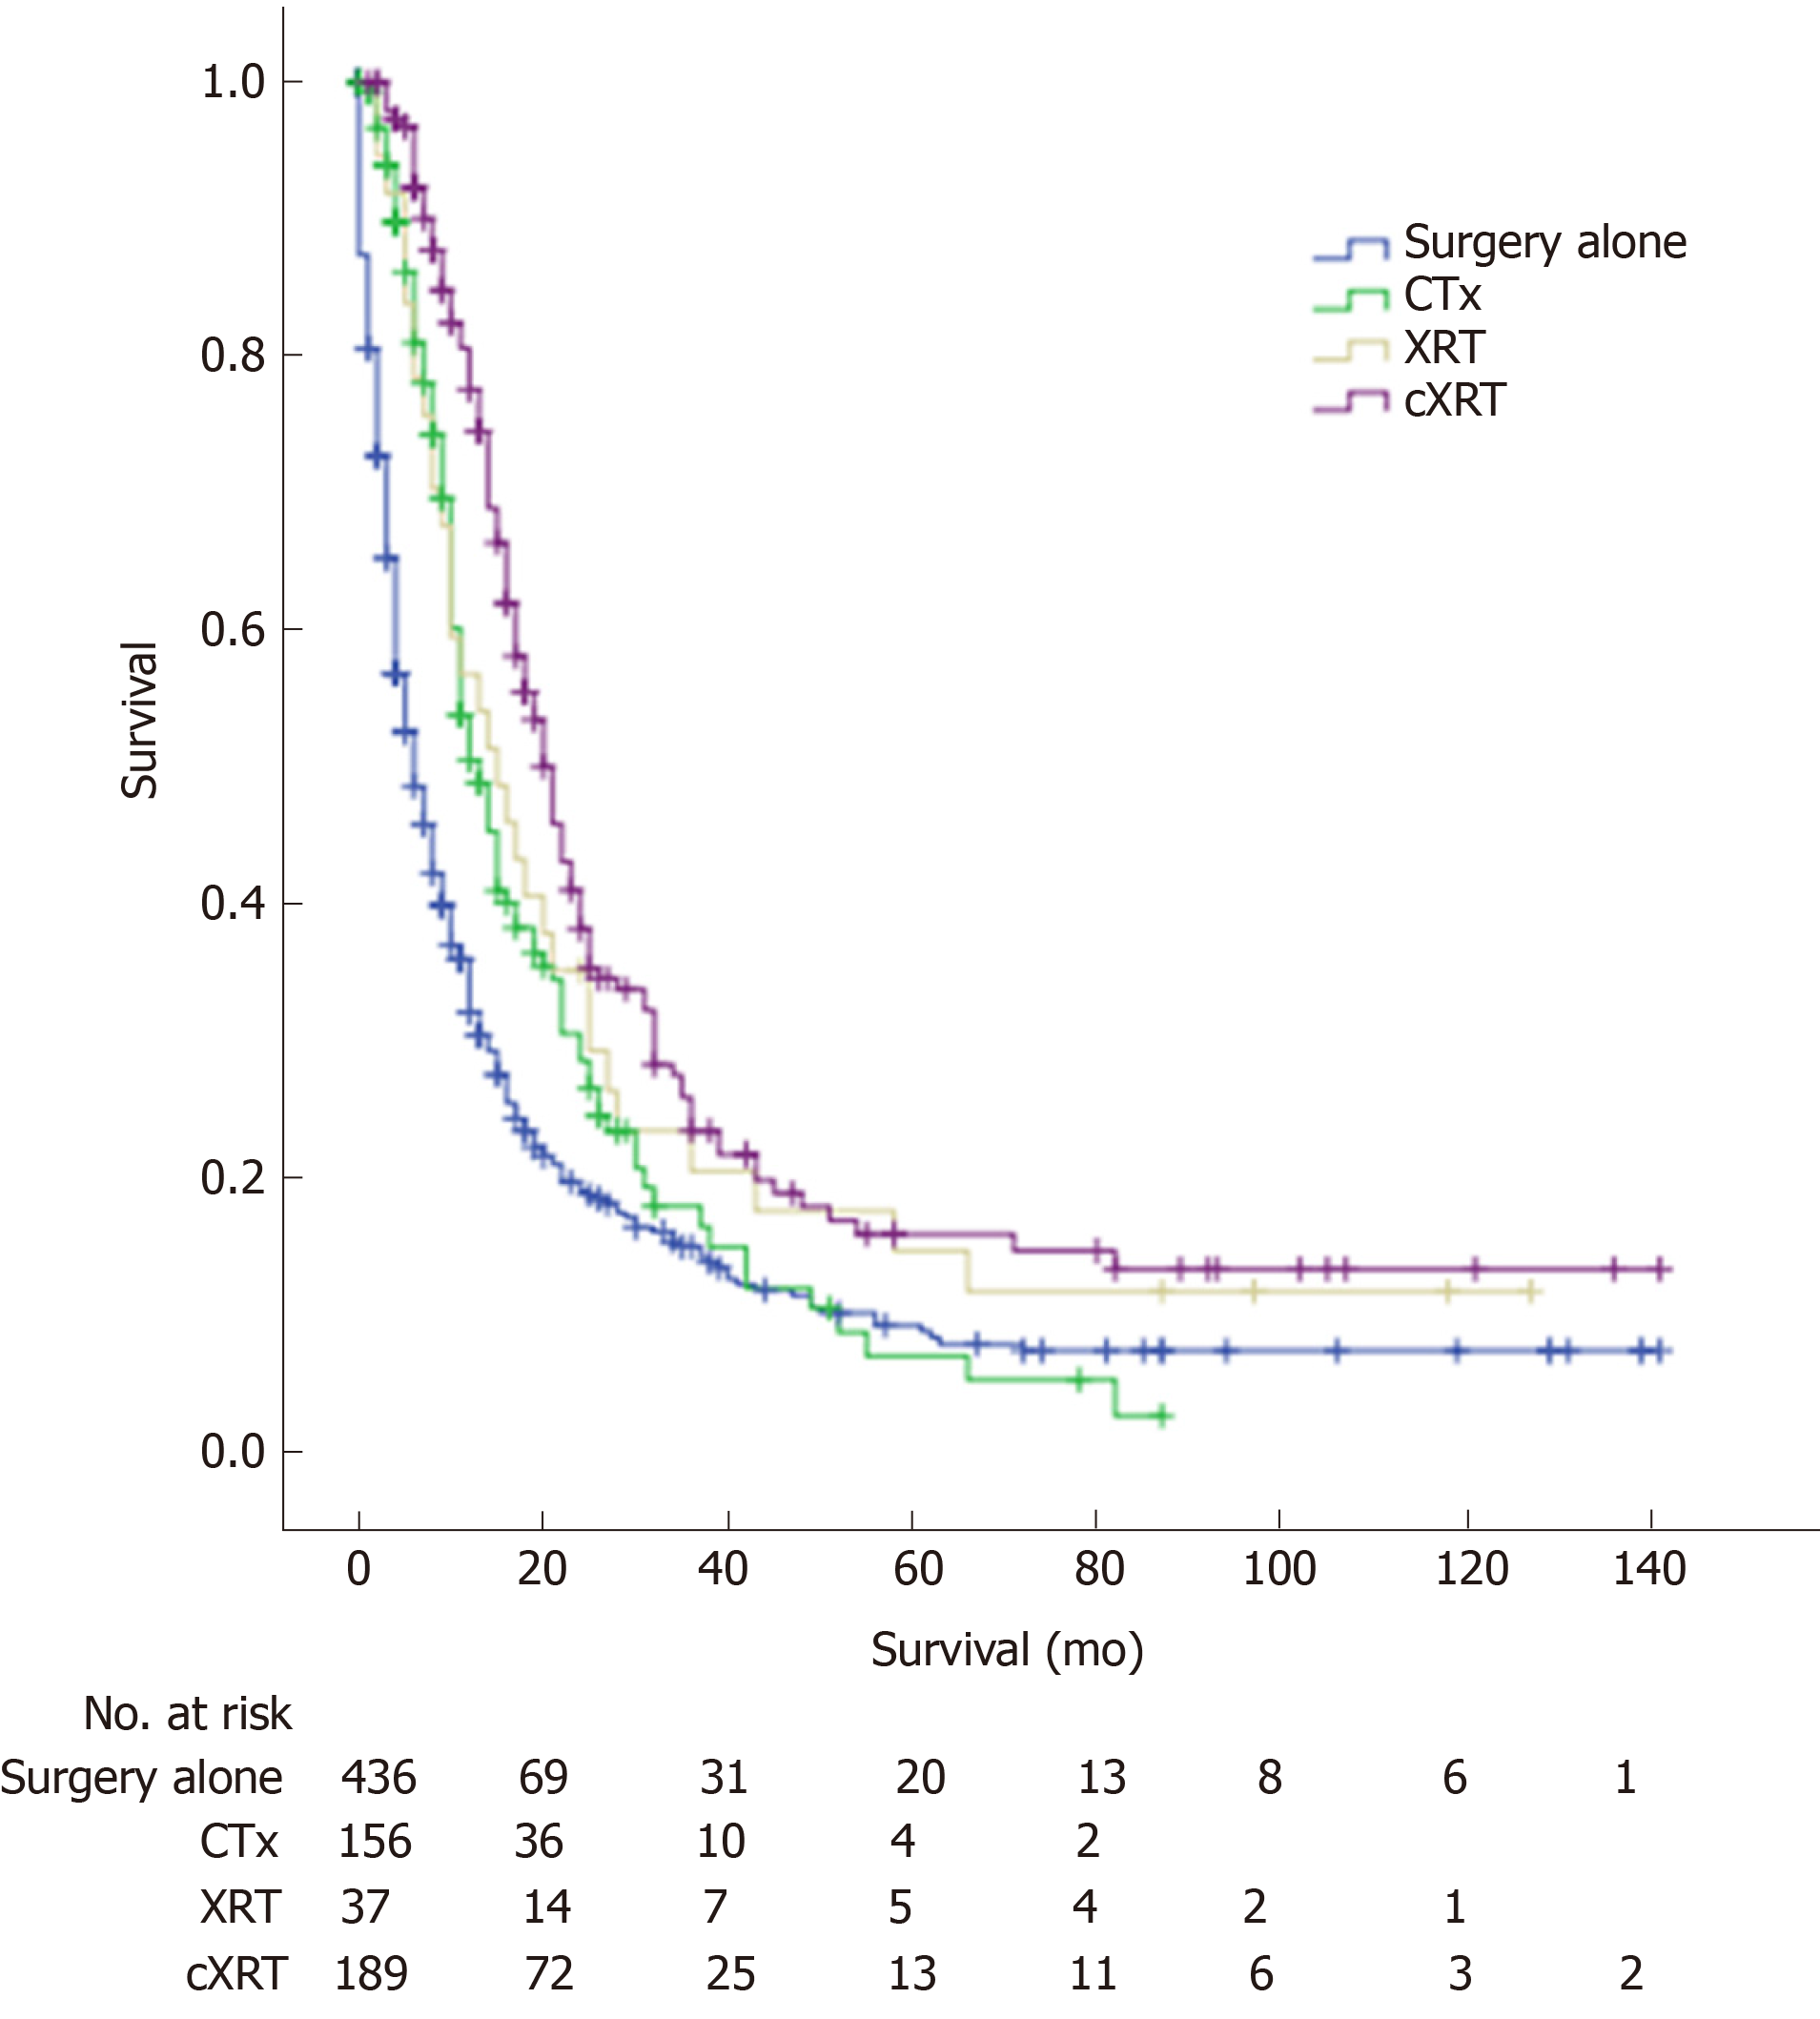
Figure 3 Overall survival curve with different adjuvant therapies for patients with advanced gallbladder adenocarcinoma.
CTx: Adjuvant chemotherapy; XRT: Adjuvant radiotherapy; cXRT: Adjuvant chemoradiotherapy.
- Citation: Geng ZM, Cai ZQ, Zhang Z, Tang ZH, Xue F, Chen C, Zhang D, Li Q, Zhang R, Li WZ, Wang L, Si SB. Estimating survival benefit of adjuvant therapy based on a Bayesian network prediction model in curatively resected advanced gallbladder adenocarcinoma. World J Gastroenterol 2019; 25(37): 5655-5666
- URL: https://www.wjgnet.com/1007-9327/full/v25/i37/5655.htm
- DOI: https://dx.doi.org/10.3748/wjg.v25.i37.5655


