Copyright
©The Author(s) 2019.
World J Gastroenterol. Sep 28, 2019; 25(36): 5569-5577
Published online Sep 28, 2019. doi: 10.3748/wjg.v25.i36.5569
Published online Sep 28, 2019. doi: 10.3748/wjg.v25.i36.5569
Figure 1 Magnetic resonance imaging and ultrasonography were performed during the initial visit.
A and B: Magnetic resonance imaging shows 2 tumors in the right lobe. Anterior tumor is 6 mm, with low intensity on the T1-weighted image (A) and high intensity on the T2-weighted image (B; white arrow), which is consistent with simple liver cysts. Posterior tumor is 18 mm with mostly T1 low- and T2 high-intensity areas but has partial T1 high- and T2 low-intensity areas (black arrow). C: B-mode ultrasonography of the posterior tumor shows low-echoic cystic lesions with high-echoic areas inside.
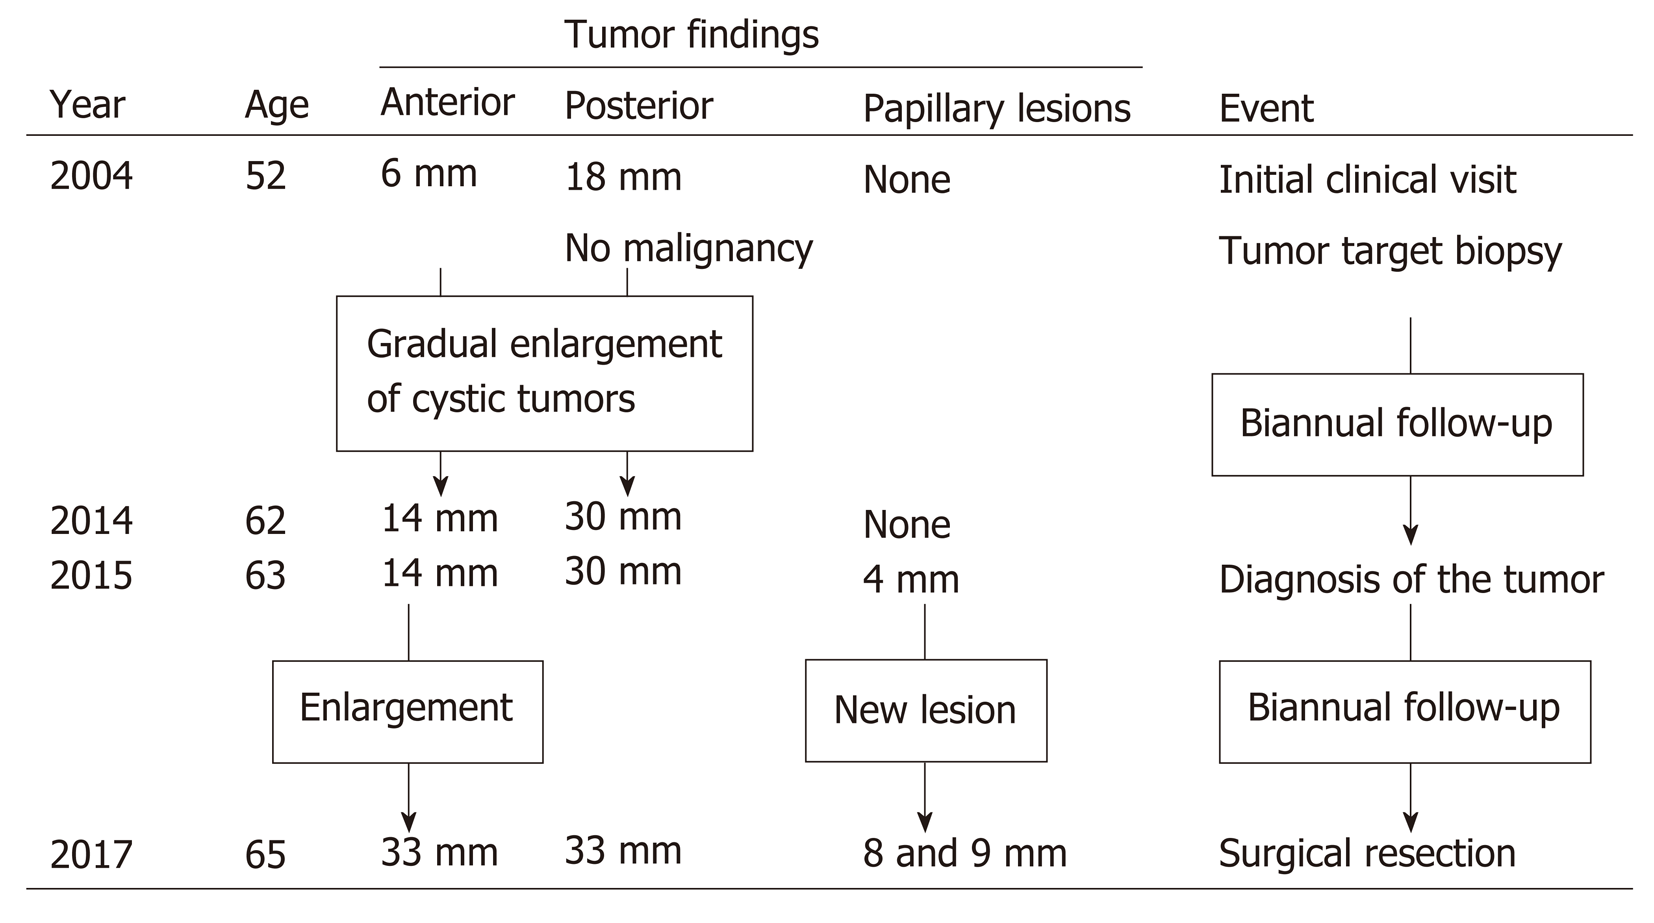
Figure 2 Timeline of tumor proliferation.
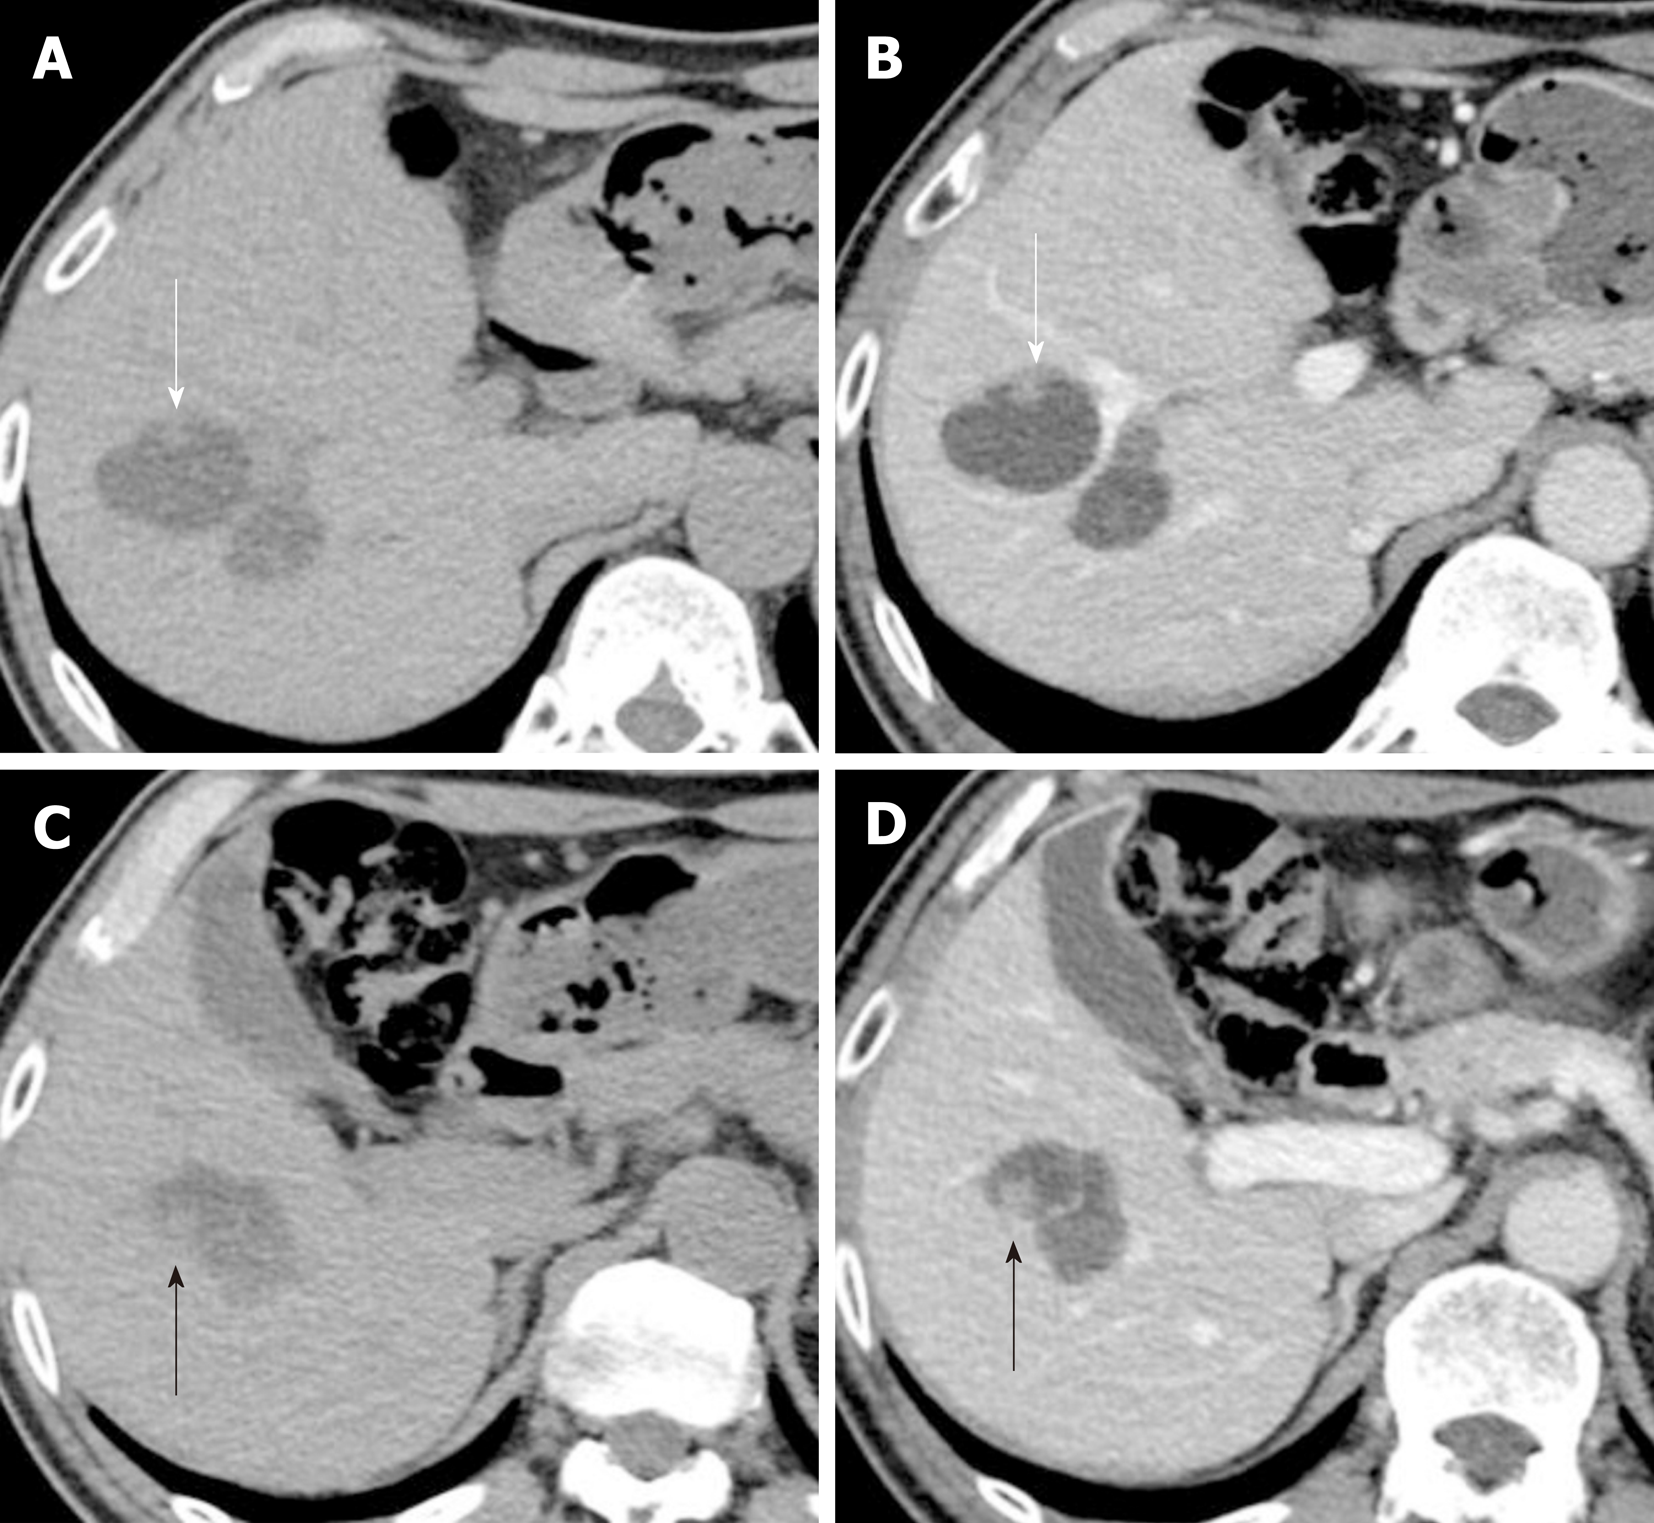
Figure 3 Computed tomography performed 13 years after the initial clinical visit.
A and C: Plain computed tomography (CT) shows the 33 mm anterior tumor and the 32 mm posterior tumor. Two papillary proliferations are observed on the surface of the anterior tumor [8 mm on the anterior surface (A; white arrow) and 9 mm on the posterior surface (C; black arrow)]. B and D: Portal-phase CT shows slight hyperenhancement of the tumor surface and the papillary proliferation. CT: Computed tomography.
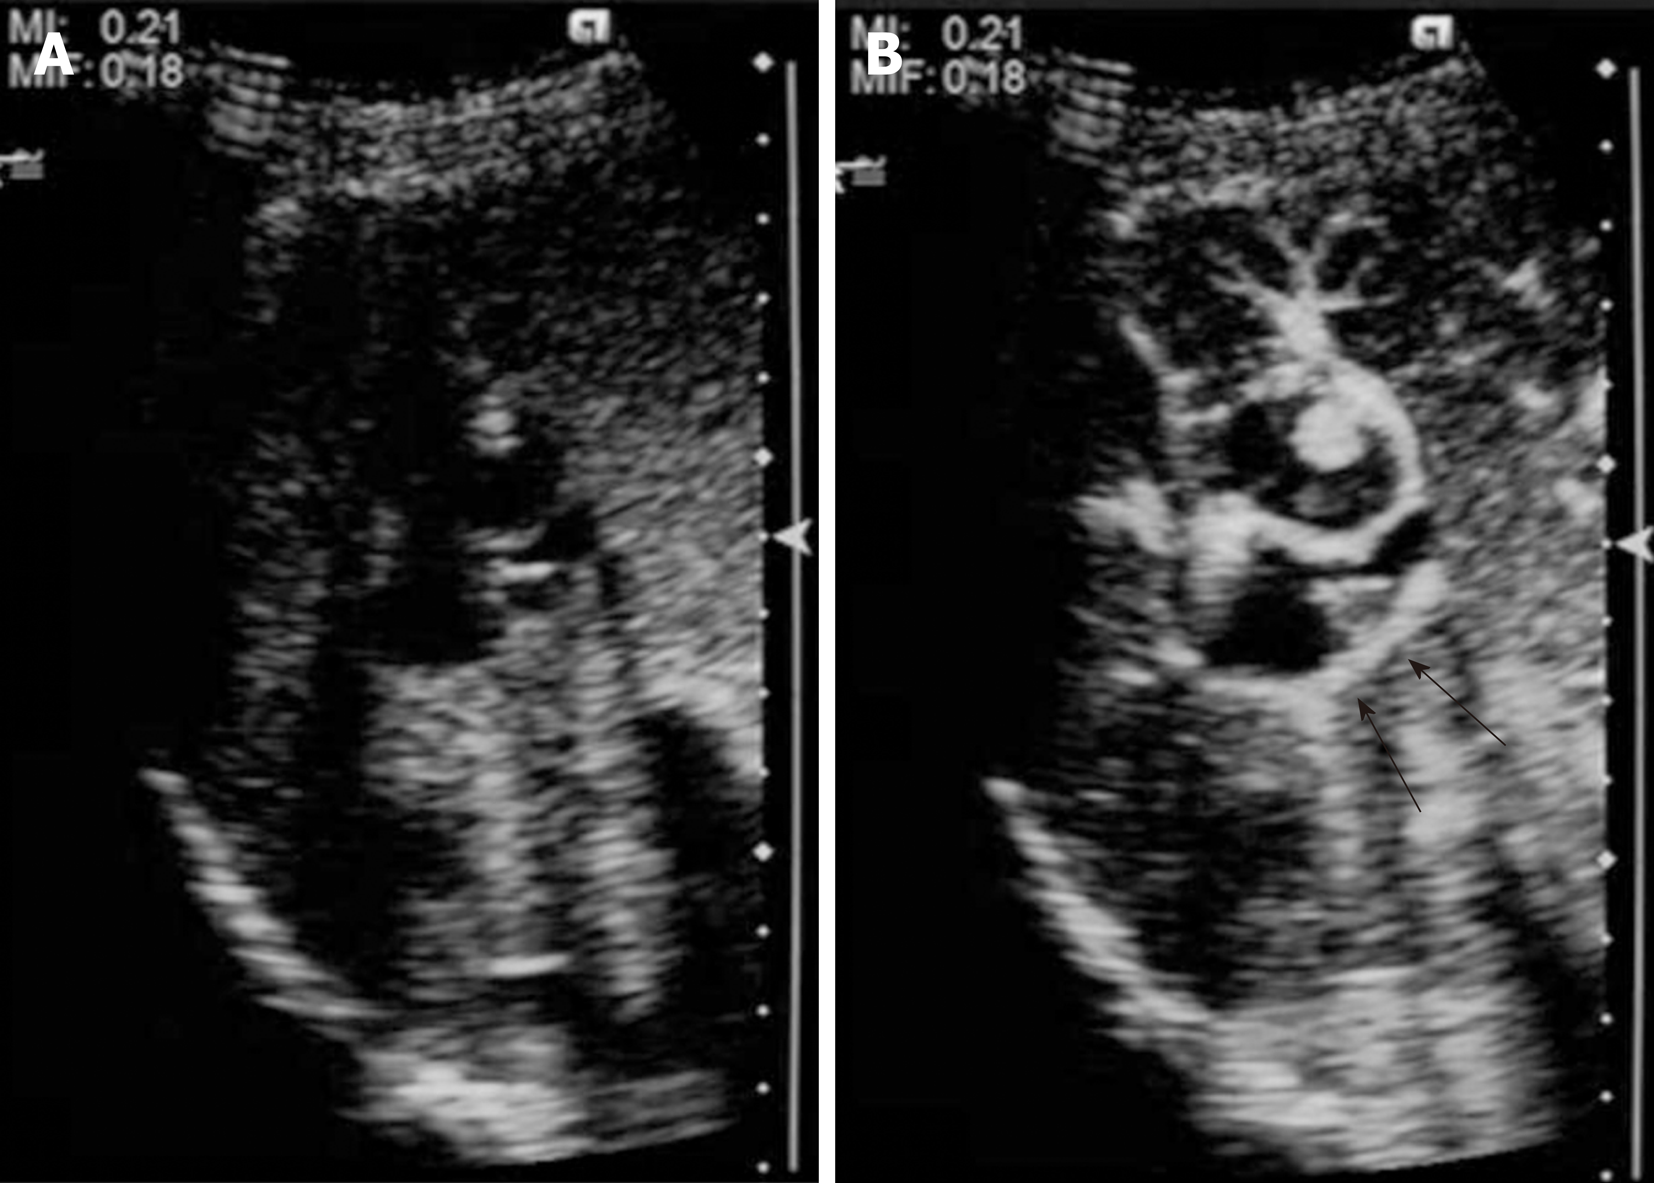
Figure 4 Ultrasonography performed 13 years after the initial clinical visit.
Contrast-enhanced ultrasonography shows a 7 mm hyperechoic papillary proliferation (A: Pre-enhancement; B: Arterial phase). Marginal hyperenhancement of the anterior tumor and early enhancement of the papillary proliferation were detected. Marginal enhancement of the posterior tumor (black arrows) was also detected, which suggests tumor spread to the posterior tumor.
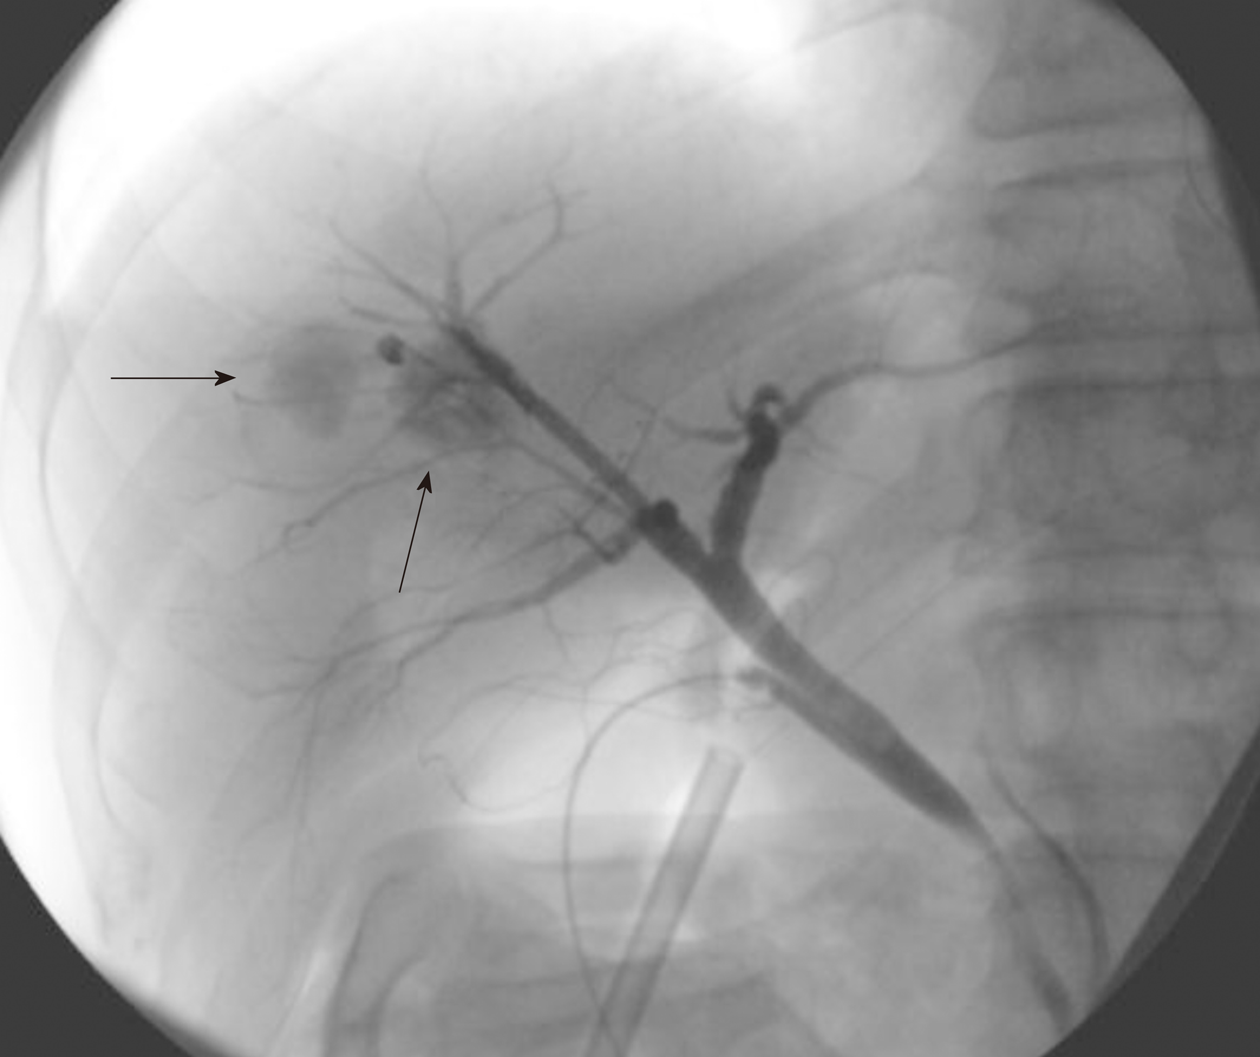
Figure 5 Cholangiography during the surgical procedure.
Cholangiography showed cystic tumor enhancement (black arrows), which represents ductal communication between the cystic lesions and bile ducts.
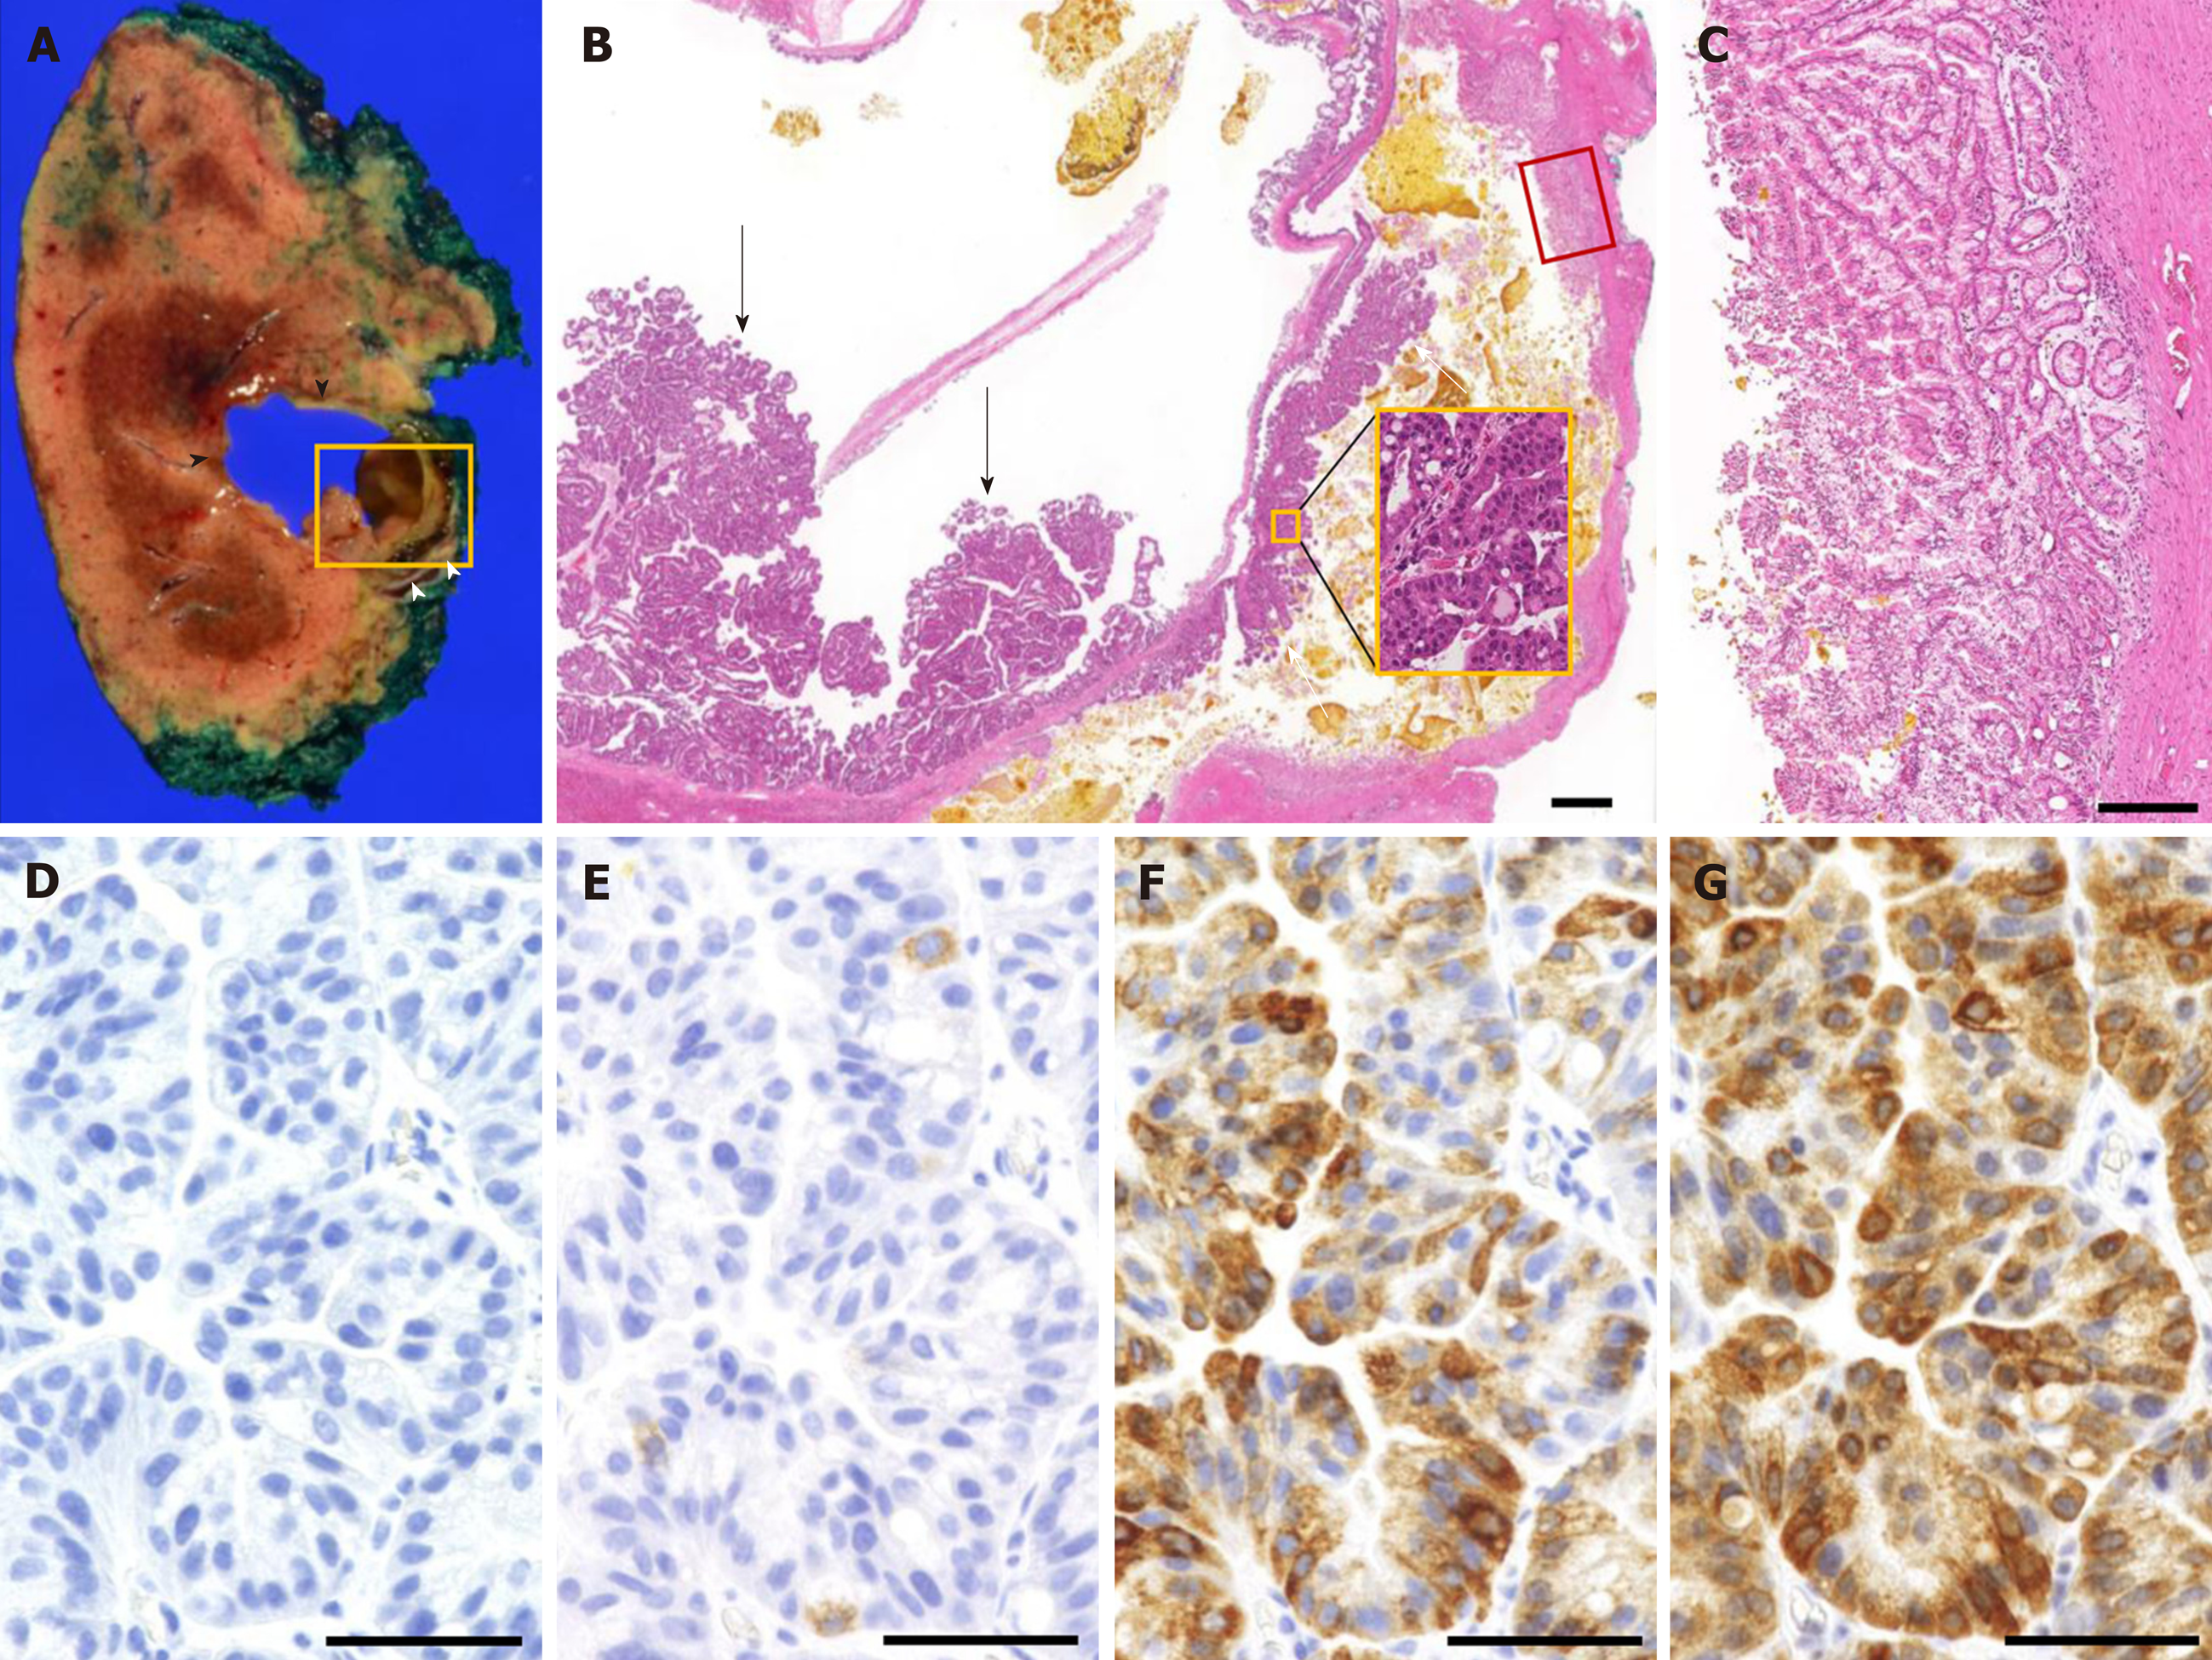
Figure 6 Pathological findings of the surgical specimens.
A: Macroscopic findings show 2 cystic lesions with a maximum diameter of 3 cm. The anterior tumor (black arrowhead) contained mucin and bile with papillary proliferation, while the posterior tumor (white arrowhead) contained solidified bile. B: Microscopic findings of the tumor (yellow square in A). Dysplastic epithelium proliferated on both anterior tumor (black arrow) and posterior tumor (white arrow). Higher magnification of the papillary proliferation of the posterior tumor (yellow square in B) shows dysplastic epithelium. C: Thick glandular epithelium was observed on the posterior tumor (red square in B), which corresponds to the hyperenhancement seen on the contrast-enhanced ultrasonography. D-G: Immunohistochemical findings of the papillary tumor show MUC1 negativity (D), MUC2 positivity in less than 5% of the cells (E), MUC5AC positivity (F), and MUC6 positivity (G). The black bar in B represents 1000 µm, C represents 200 µm, and D-G represents 50 µm. MUC: Mucin core protein.
- Citation: Hasebe T, Sawada K, Hayashi H, Nakajima S, Takahashi H, Hagiwara M, Imai K, Yuzawa S, Fujiya M, Furukawa H, Okumura T. Long-term growth of intrahepatic papillary neoplasms: A case report. World J Gastroenterol 2019; 25(36): 5569-5577
- URL: https://www.wjgnet.com/1007-9327/full/v25/i36/5569.htm
- DOI: https://dx.doi.org/10.3748/wjg.v25.i36.5569


