Copyright
©The Author(s) 2019.
World J Gastroenterol. Sep 28, 2019; 25(36): 5559-5568
Published online Sep 28, 2019. doi: 10.3748/wjg.v25.i36.5559
Published online Sep 28, 2019. doi: 10.3748/wjg.v25.i36.5559
Figure 1 Flow diagram showing the article selection process.
LT: Liver transplantation.
Figure 2 Forrest plot of the effect of SFSG on 3-year graft survival.
SFSG: Small-for-size grafts; NFSG: Normal-for-size grafts; CI: Confidence interval.
Figure 3 Forrest Plot of the effect of SFSG on 5-year graft survival.
SFSG: Small-for-size grafts; NFSG: Normal-for-size grafts; CI: Confidence interval.
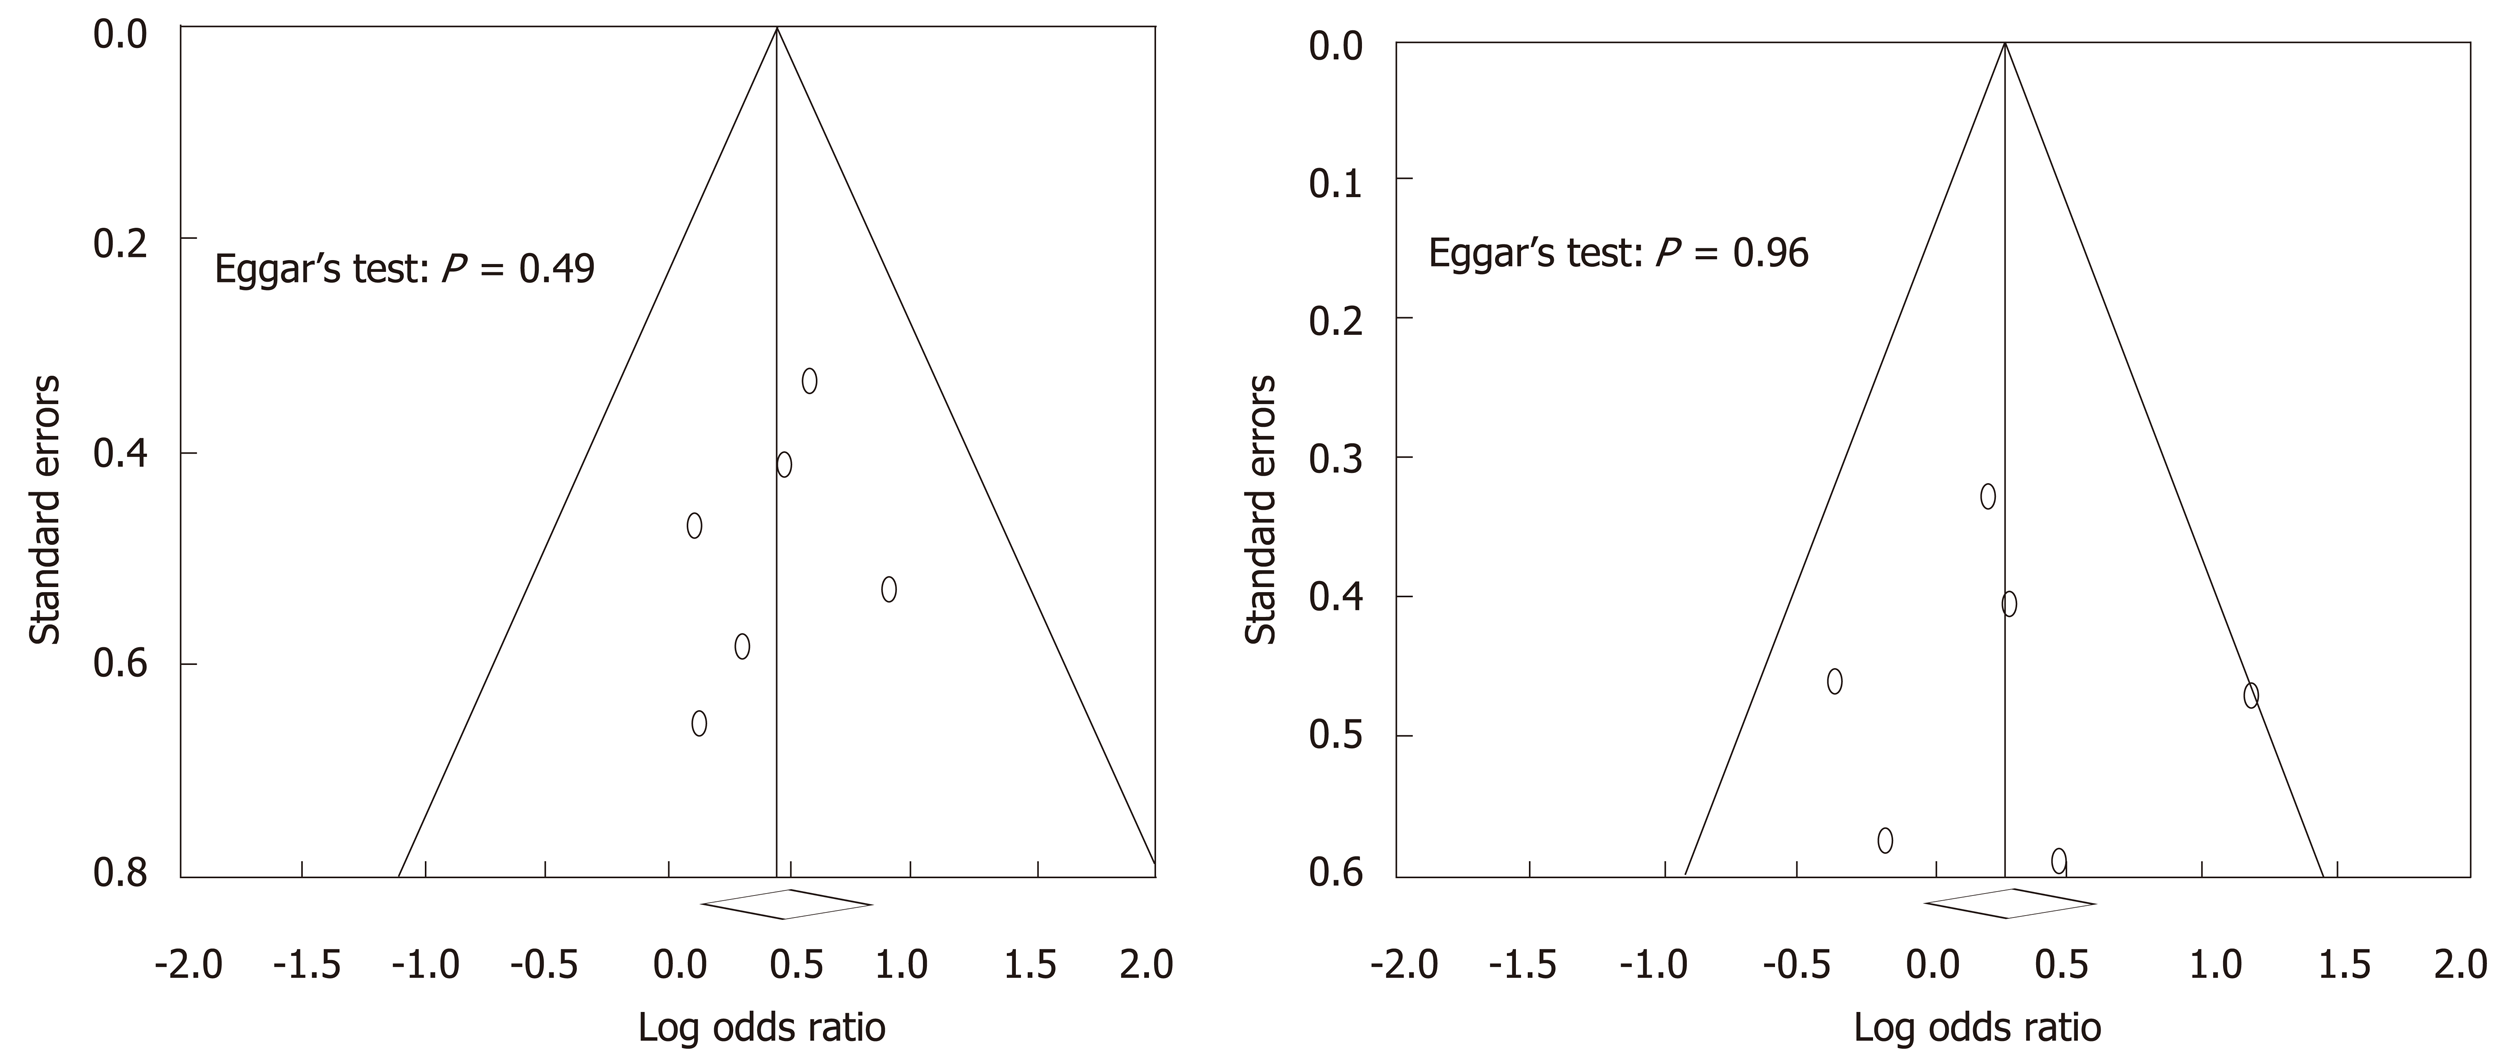
Figure 4 Funnel plot for the assessment of the presence of publication bias for 3-year and 5-year meta-analysis.
- Citation: Ma KW, Wong KHC, Chan ACY, Cheung TT, Dai WC, Fung JYY, She WH, Lo CM, Chok KSH. Impact of small-for-size liver grafts on medium-term and long-term graft survival in living donor liver transplantation: A meta-analysis. World J Gastroenterol 2019; 25(36): 5559-5568
- URL: https://www.wjgnet.com/1007-9327/full/v25/i36/5559.htm
- DOI: https://dx.doi.org/10.3748/wjg.v25.i36.5559


