Copyright
©The Author(s) 2019.
World J Gastroenterol. Sep 21, 2019; 25(35): 5257-5265
Published online Sep 21, 2019. doi: 10.3748/wjg.v25.i35.5257
Published online Sep 21, 2019. doi: 10.3748/wjg.v25.i35.5257
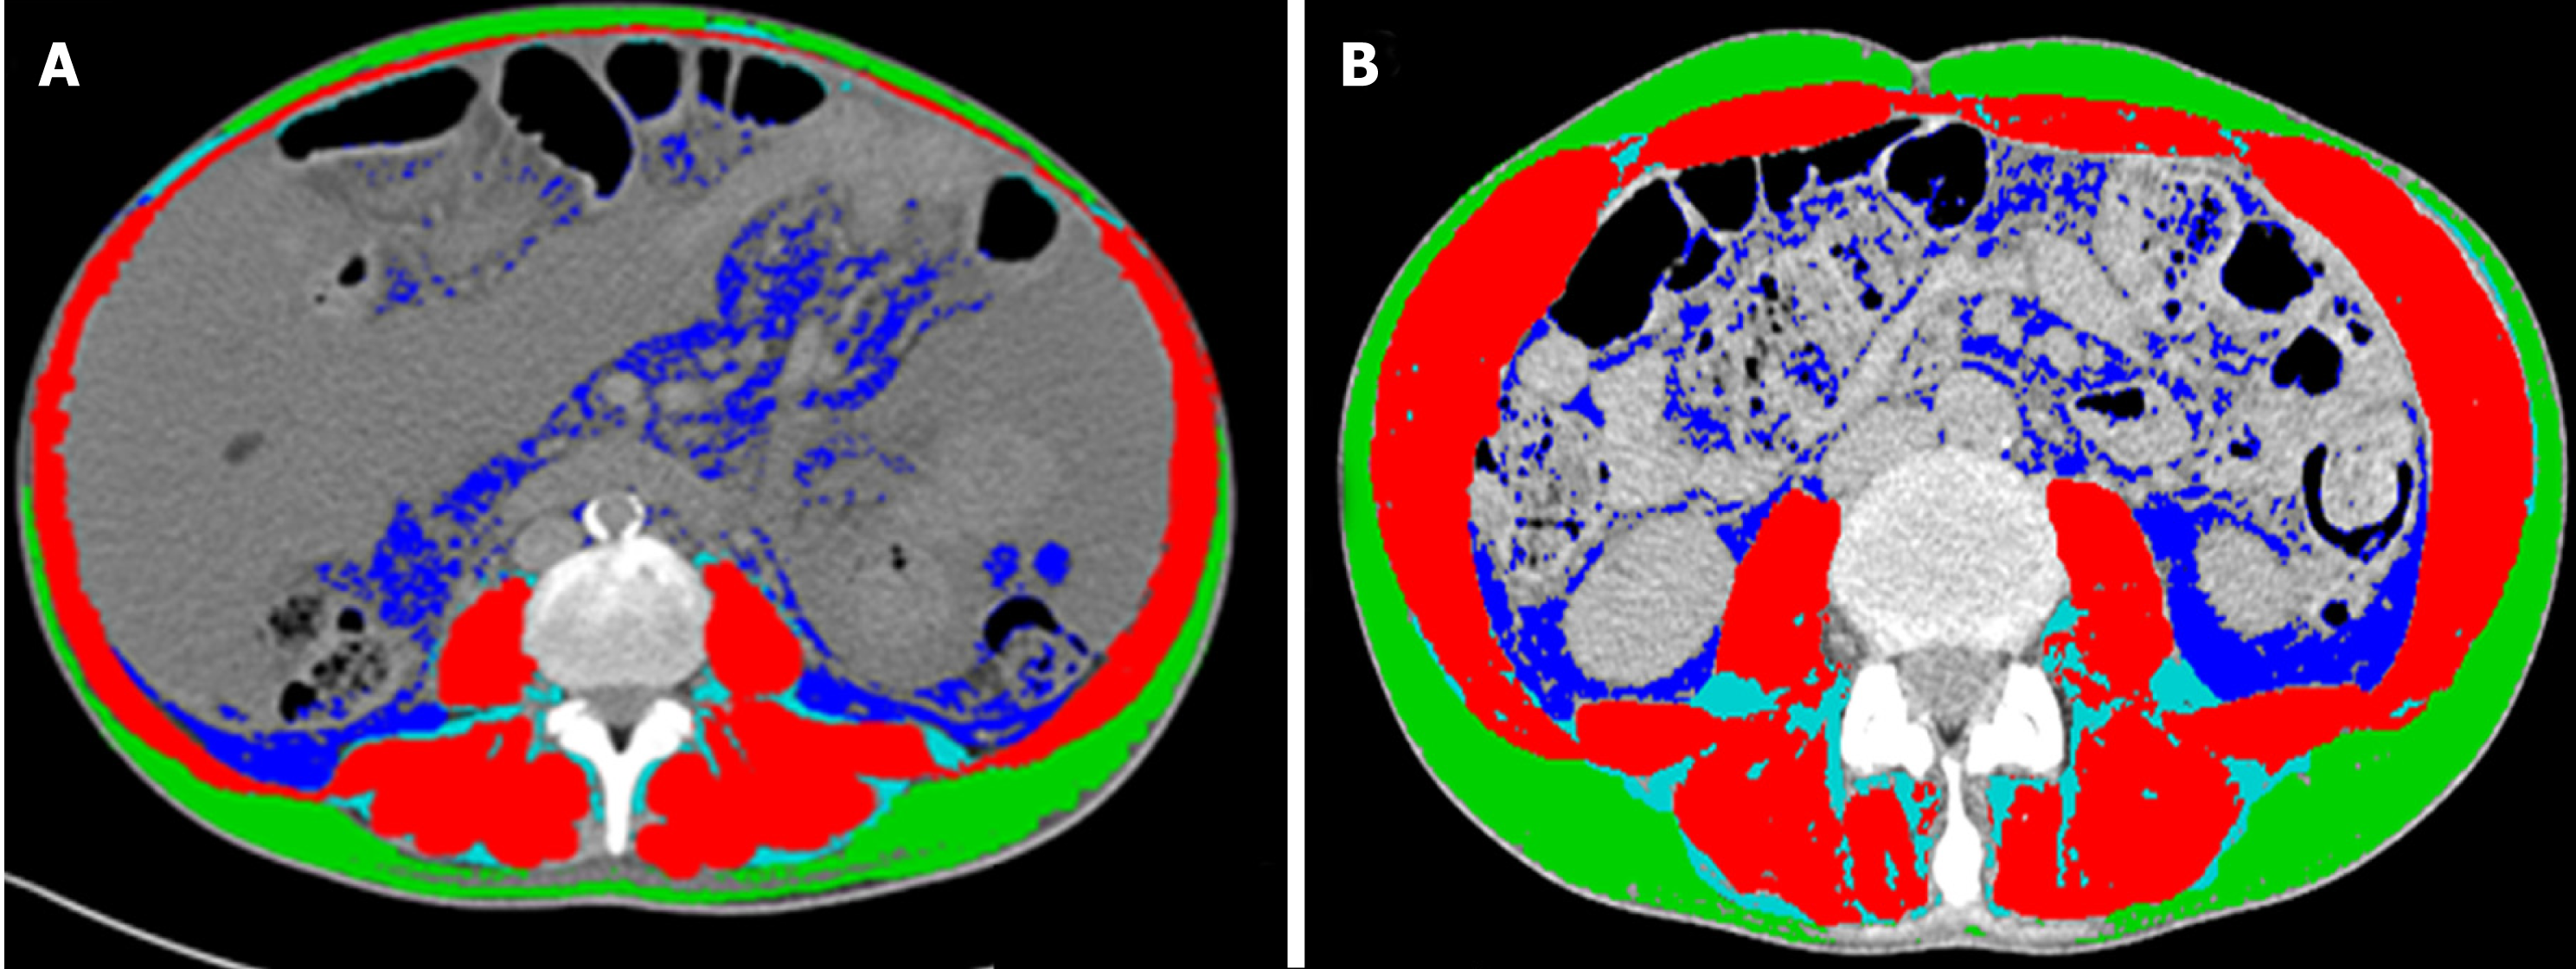
Figure 1 Computed tomography images used for the muscularity assessment of patients with cirrhosis.
Comparison of two cirrhotic patients with (A) and without (B) sarcopenia. Muscle mass is highlighted in red, intra and intermuscular fat in light blue, subcutaneous fat in green and visceral fat in blue.
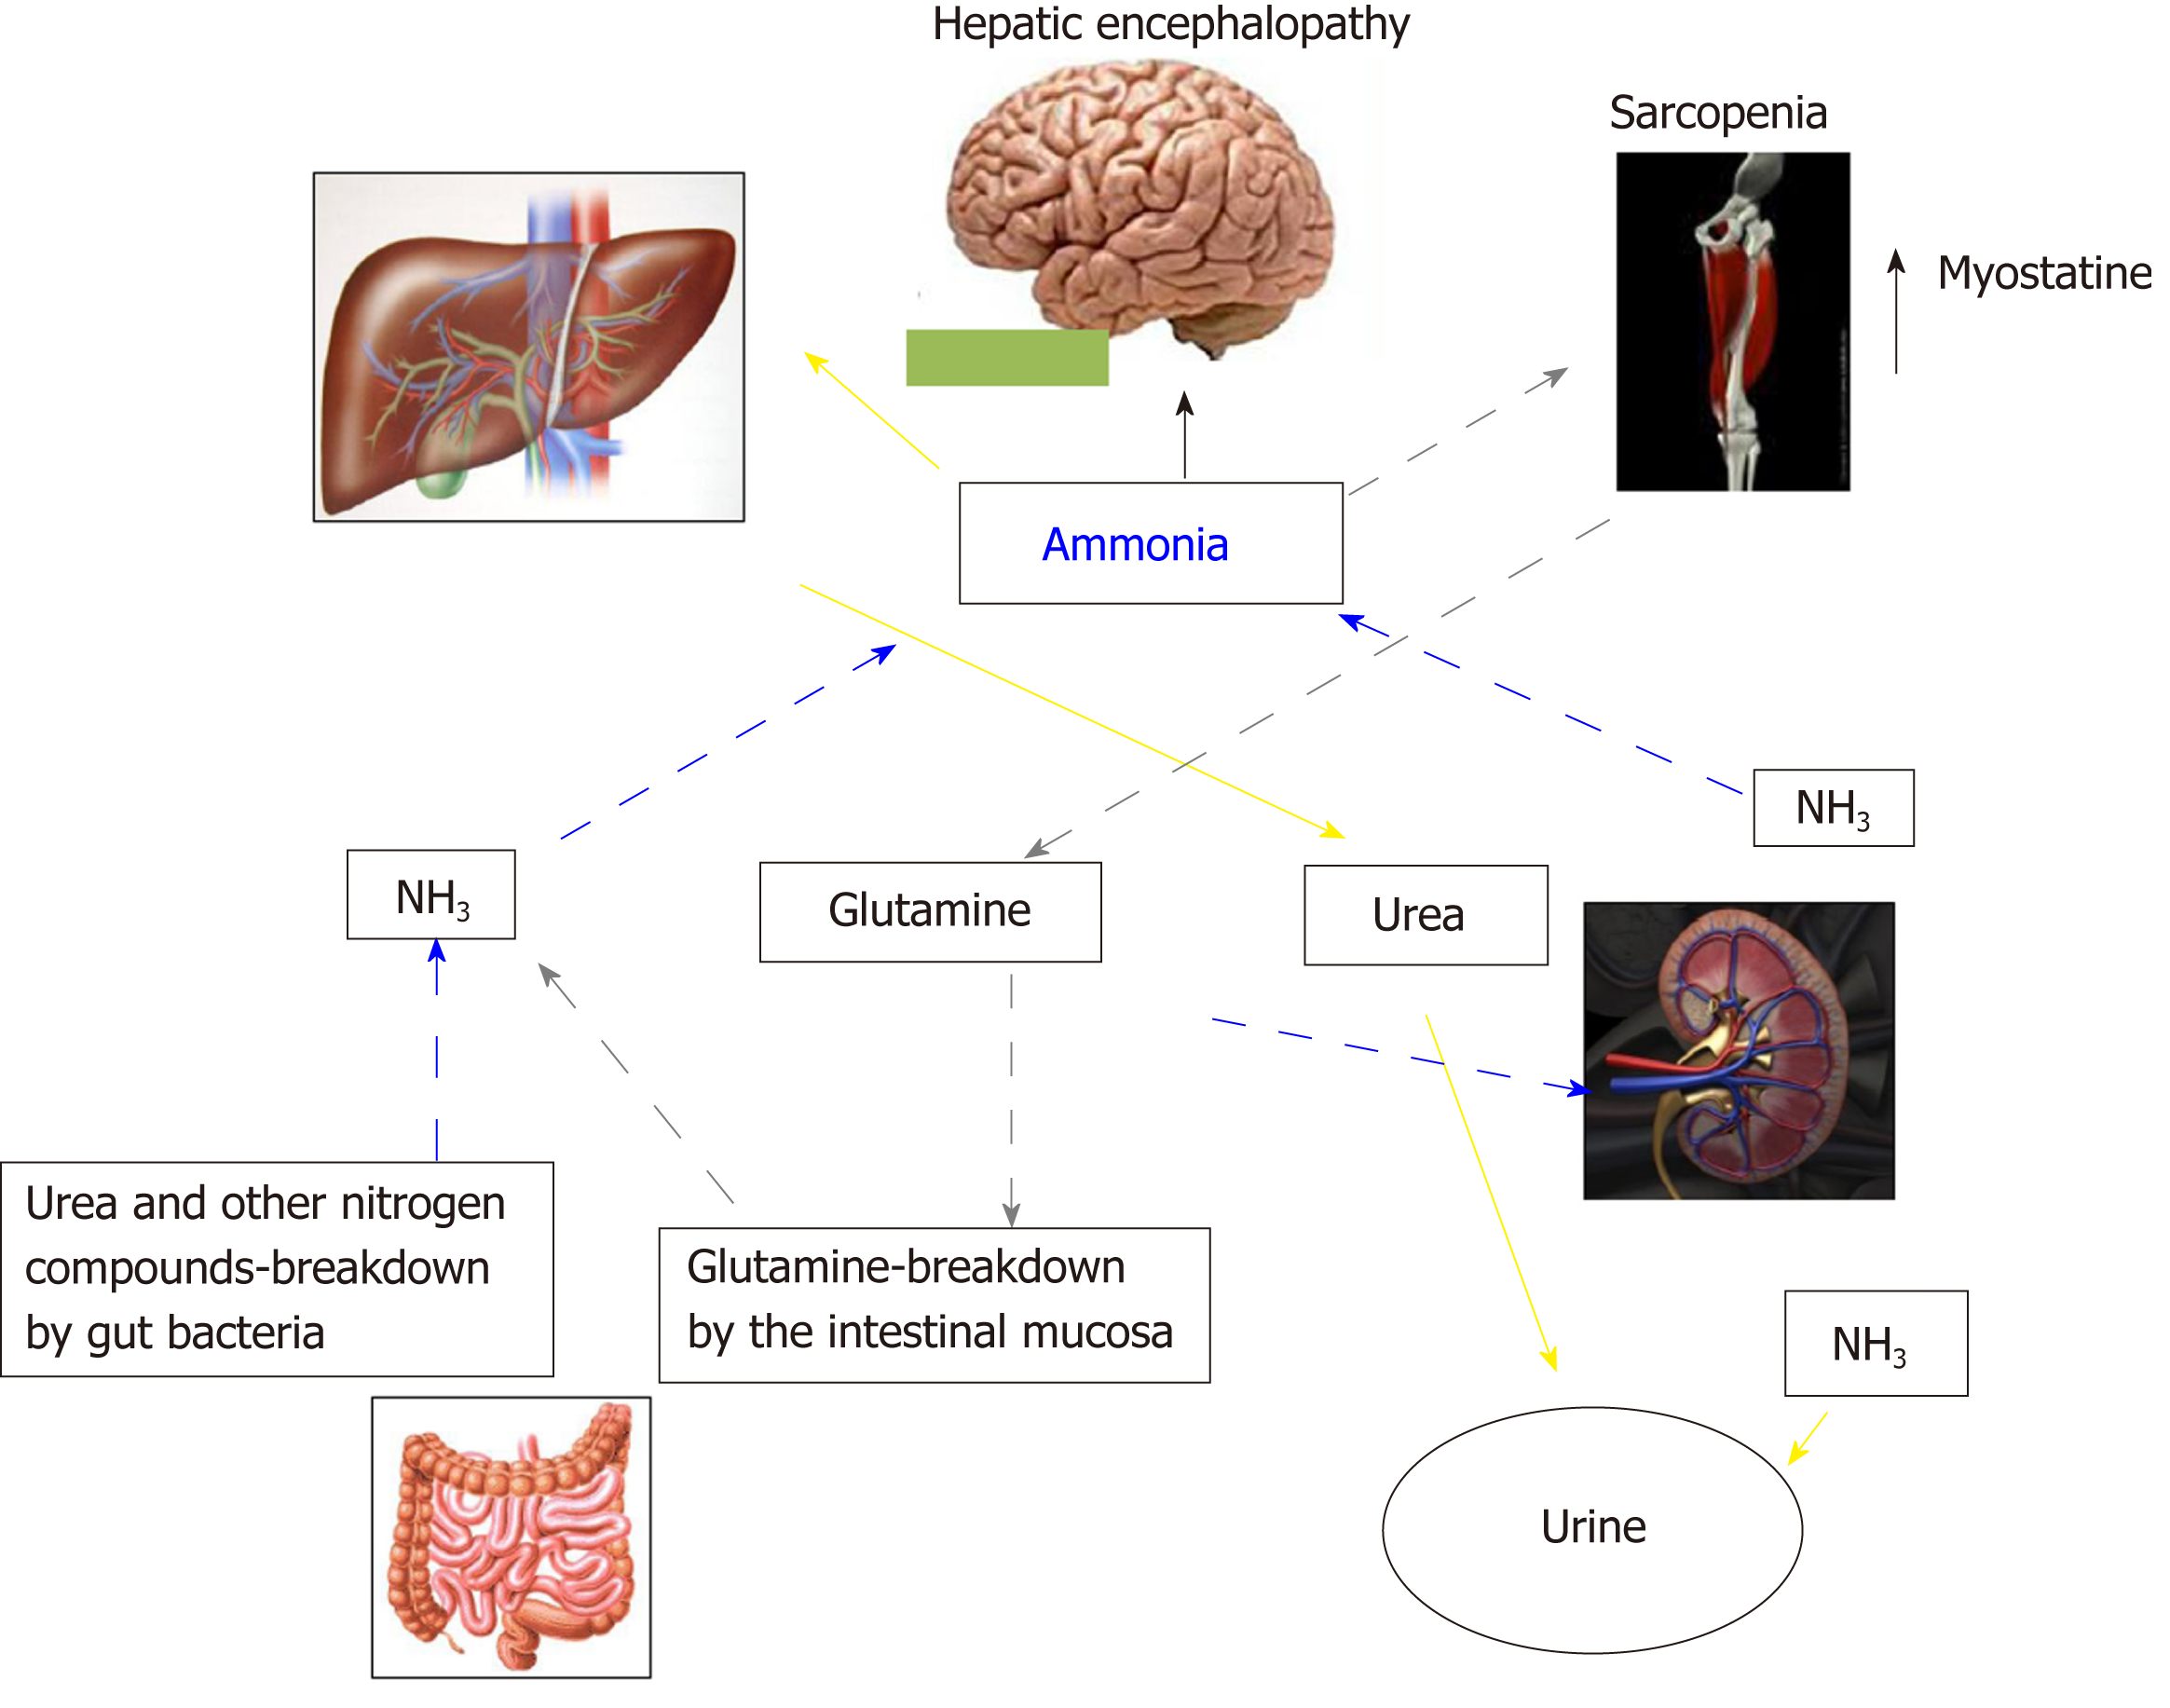
Figure 2 Inter-organ ammonia metabolism showing sites of ammonia generation and disposal.
Yellow arrows indicate the ammonia removed by the urea-cycle and disposed in urine. Grey pointed arrows indicate ammonia disposed as glutamine in muscle, which is then broken down in the small intestine to ammonia. This pattern of ammonia disposal does not lead to a net ammonia removal. Ammonia may be also produced by glutamine breakdown in the kidney and by urea and other nitrogen compounds breakdown in the large intestine (blue dashed arrows).
- Citation: Nardelli S, Gioia S, Faccioli J, Riggio O, Ridola L. Sarcopenia and cognitive impairment in liver cirrhosis: A viewpoint on the clinical impact of minimal hepatic encephalopathy. World J Gastroenterol 2019; 25(35): 5257-5265
- URL: https://www.wjgnet.com/1007-9327/full/v25/i35/5257.htm
- DOI: https://dx.doi.org/10.3748/wjg.v25.i35.5257


