Copyright
©The Author(s) 2019.
World J Gastroenterol. Sep 21, 2019; 25(35): 5233-5256
Published online Sep 21, 2019. doi: 10.3748/wjg.v25.i35.5233
Published online Sep 21, 2019. doi: 10.3748/wjg.v25.i35.5233
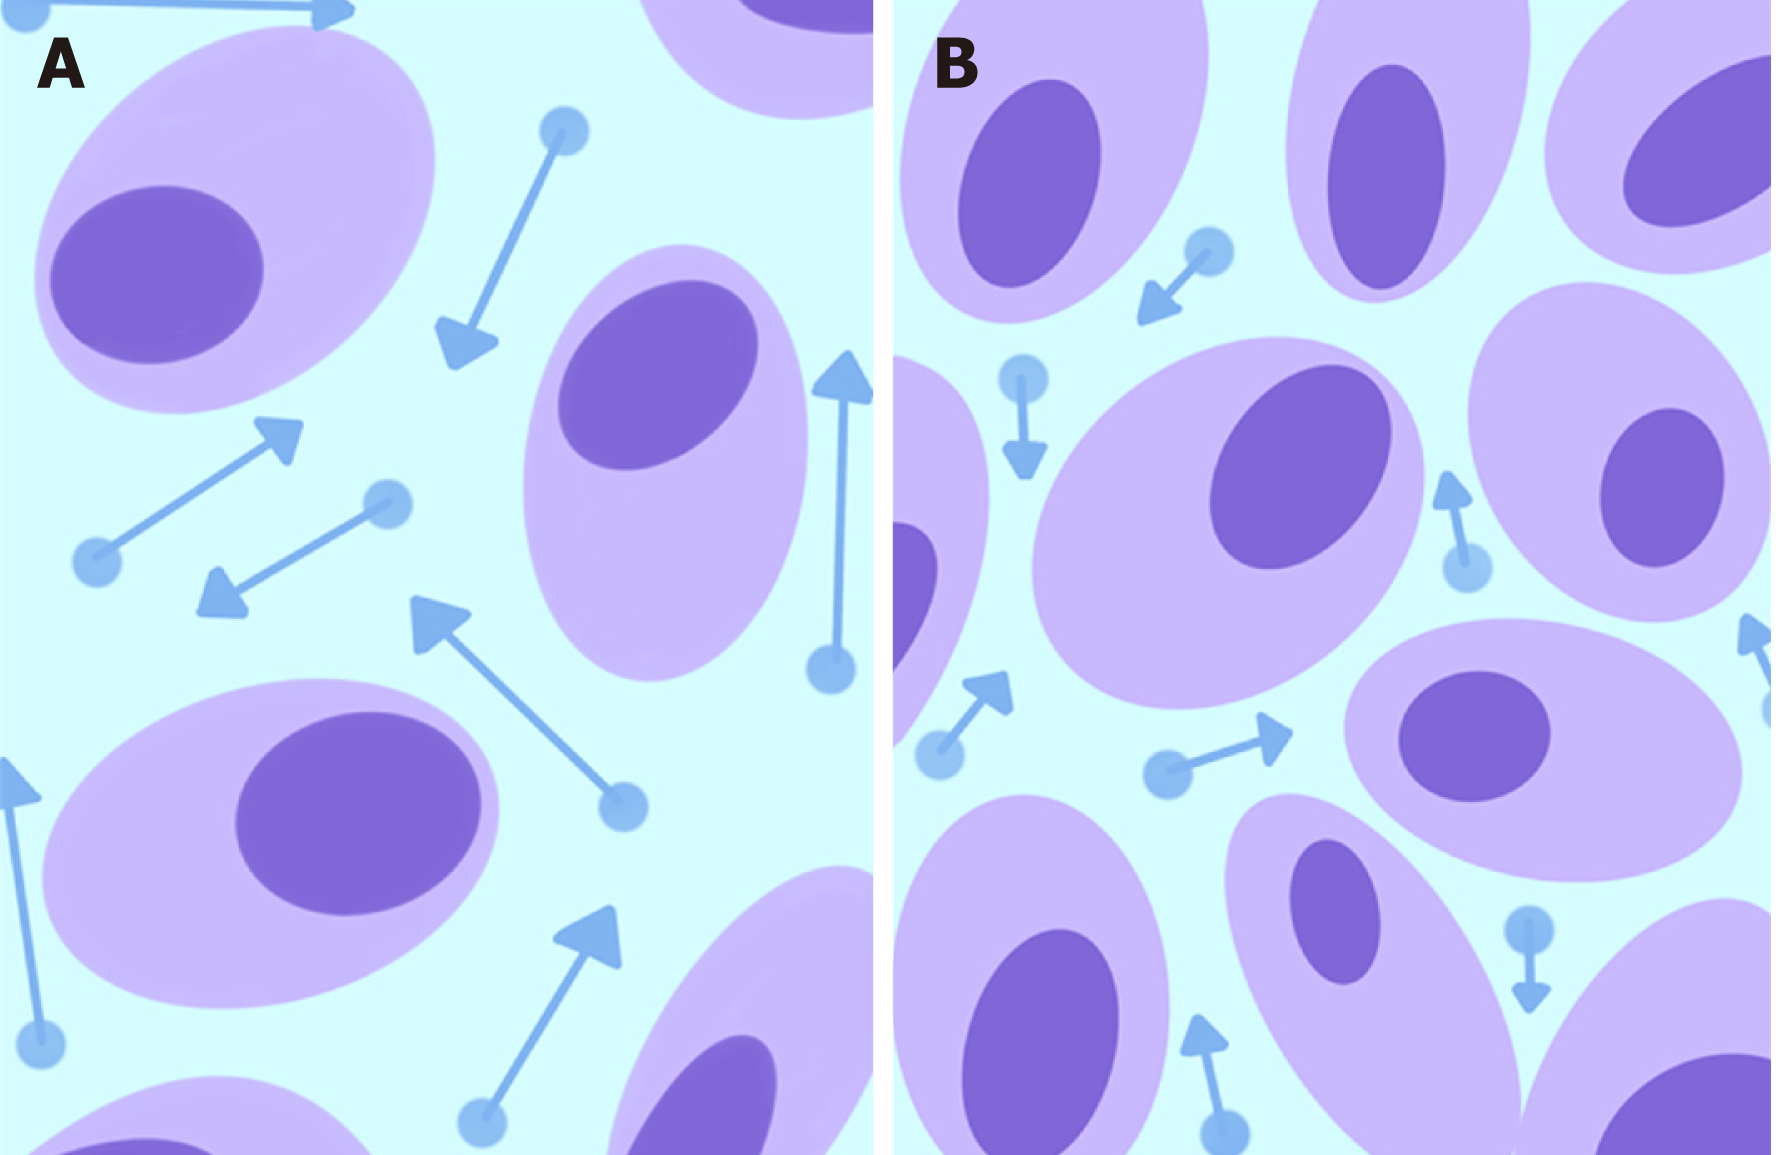
Figure 1 Schematic representation of water molecule diffusion (dots) in the extracellular space.
Normal tissues (A) show a relatively larger extracellular space with high water diffusion (longer arrow vectors higher ADC values), whereas the increased tissue cellularity in a neoplasm (B) reduces the intercellular space and consequently restricts diffusion (shorter arrow vectors lower ADC values).
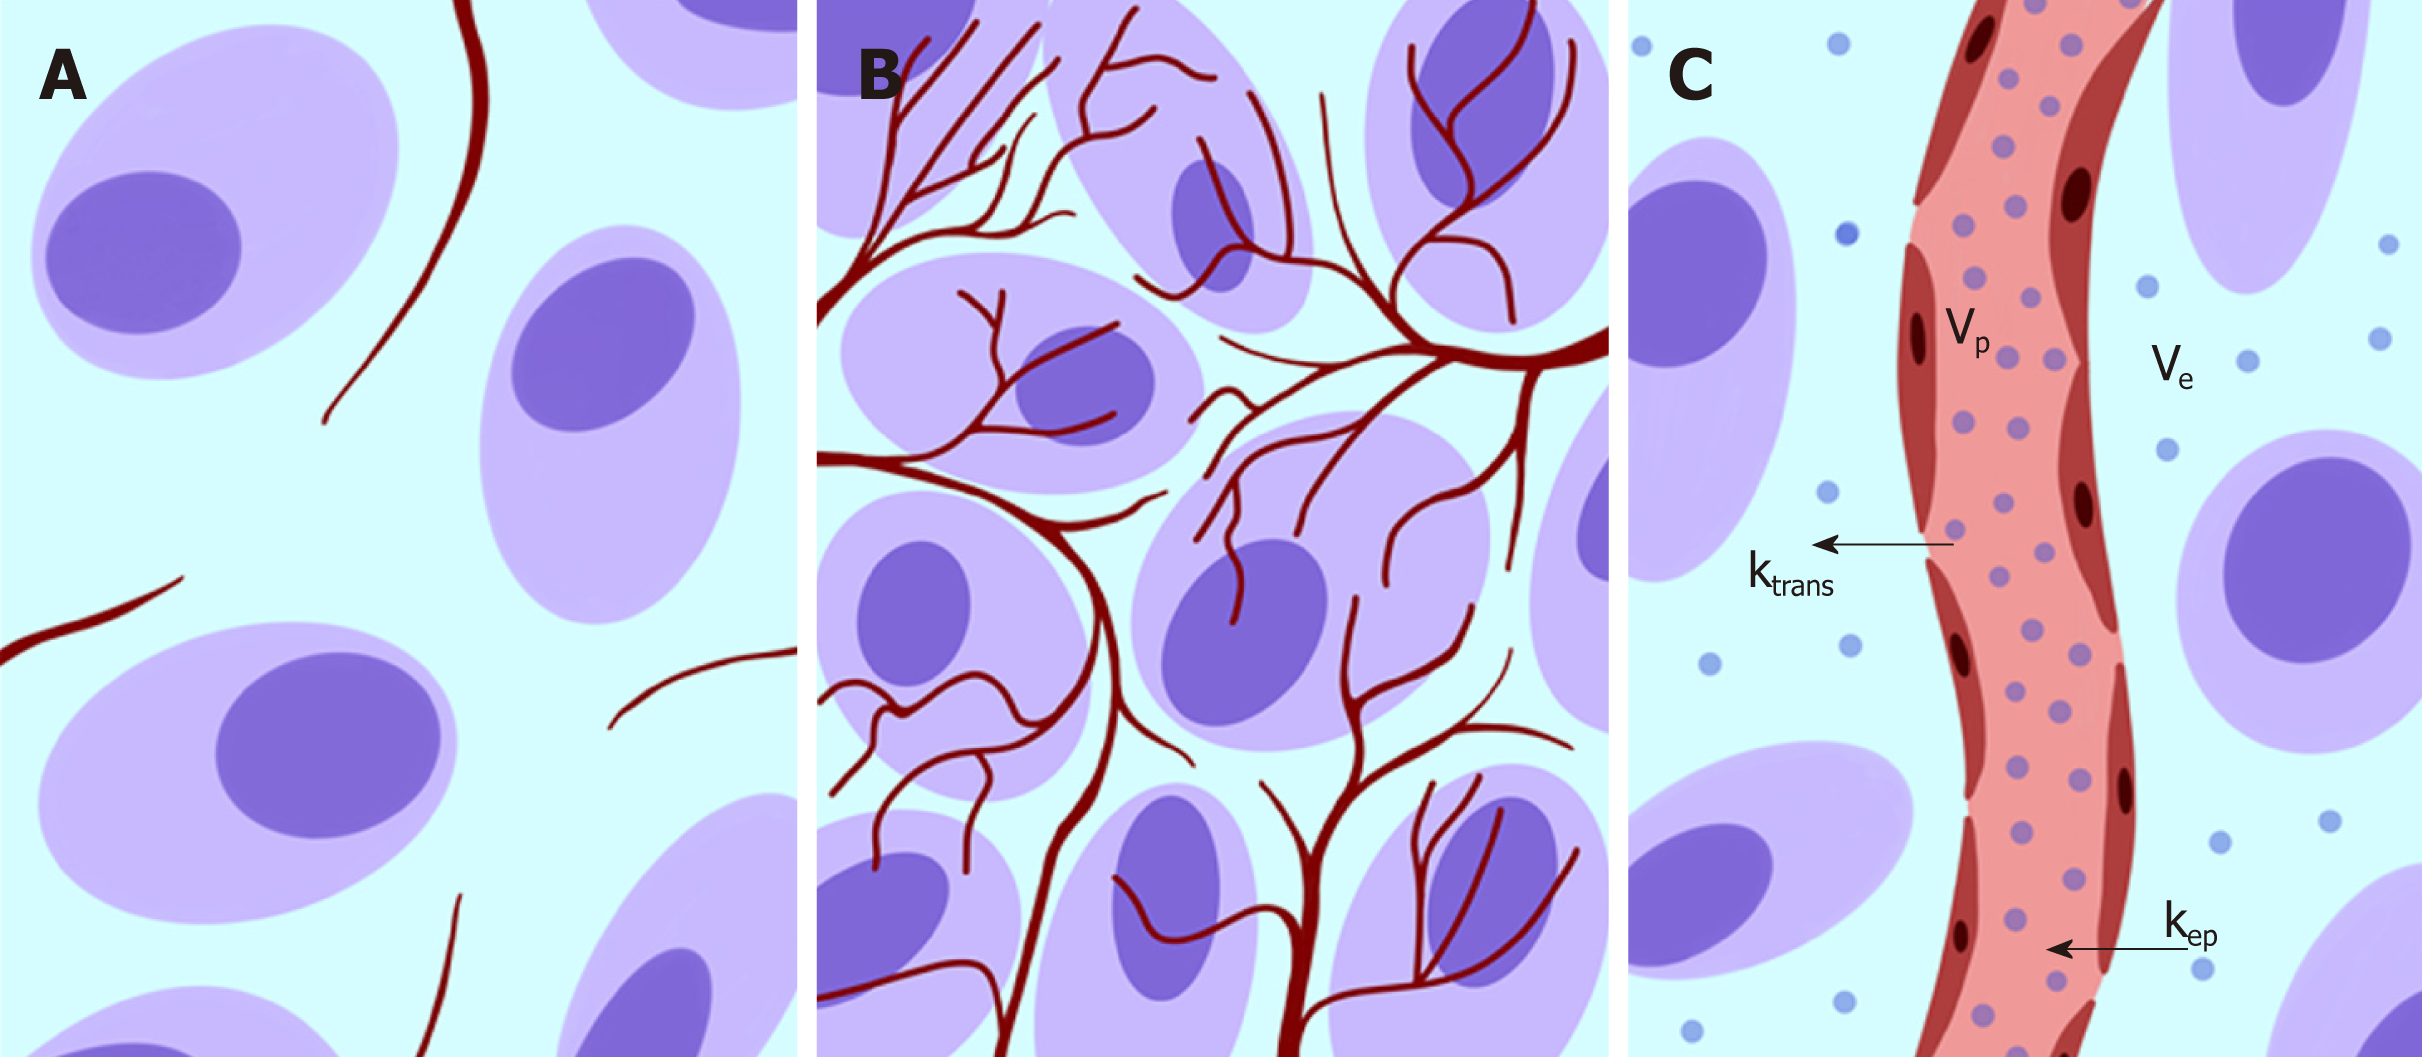
Figure 2 Schematic representation showing vascularization changes in normal tissue (A) and neoplastic neoangiogenesis (B).
In C, a typical bicompartmental model (extended Toft’s model) is depicted with various parameters that can be assessed according to the tissue contrast agent concentration (dots) and the arterial input function data.
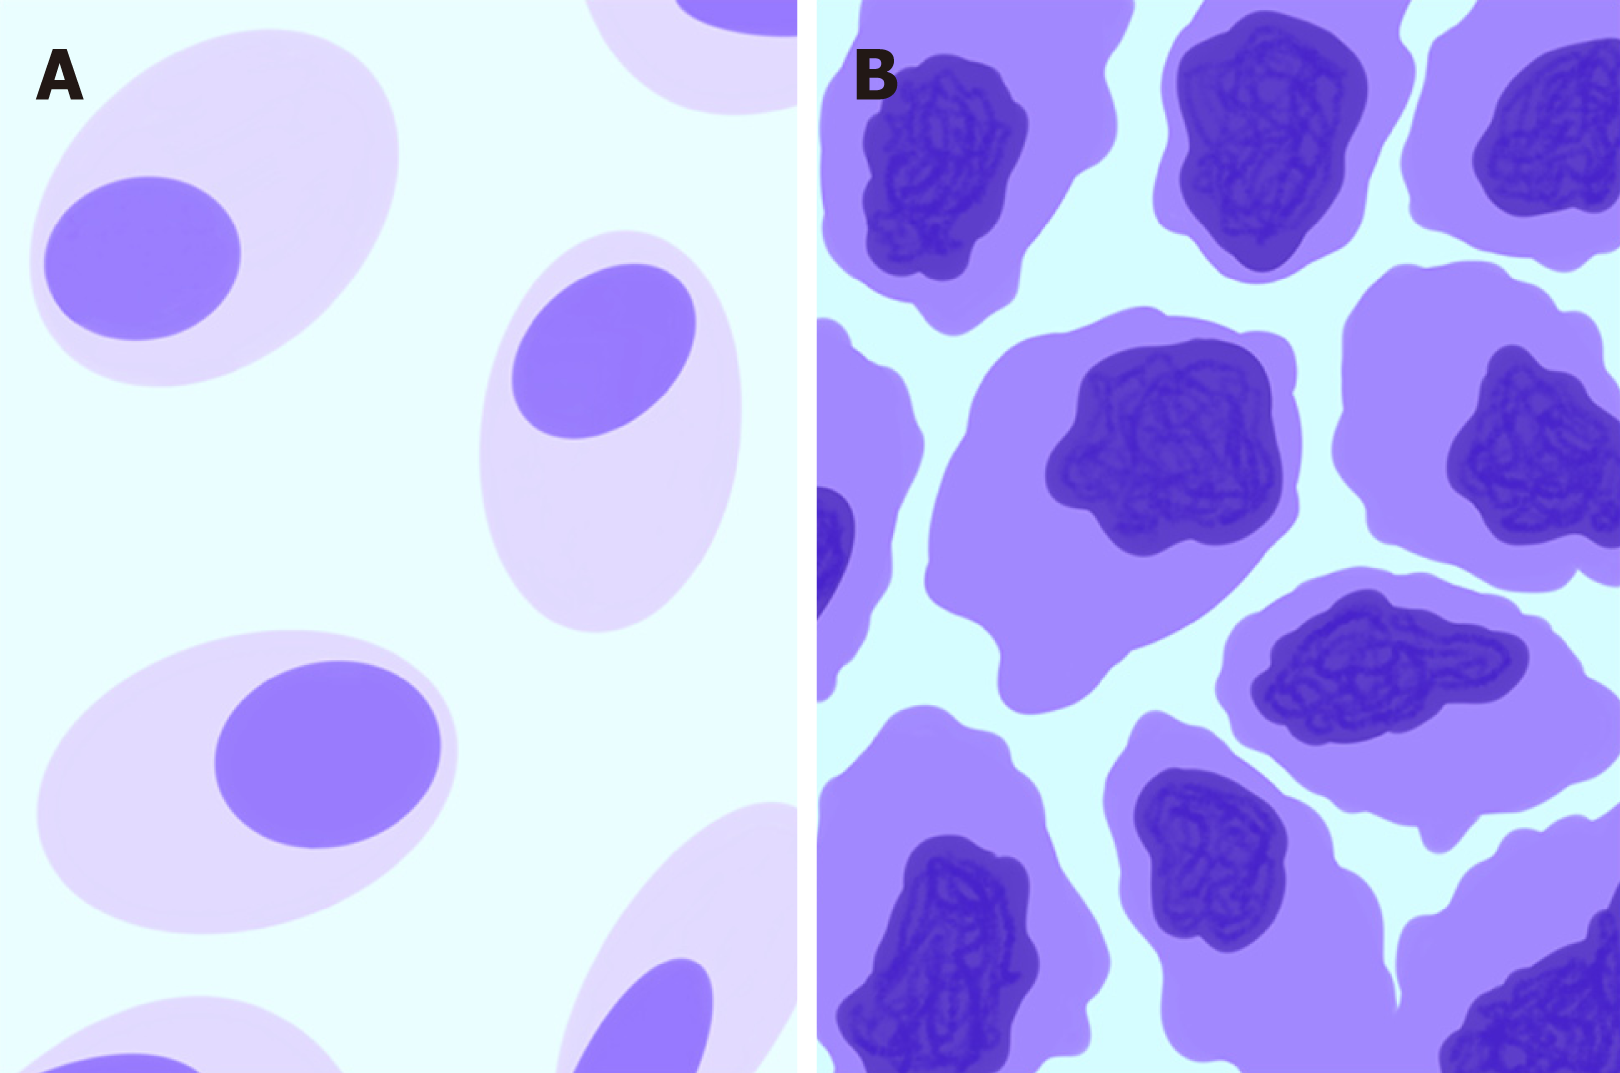
Figure 3 Schematic representation of morphological and metabolic features of normal tissue (A) compared with those of neoplastic malignant cells (B).
The darker shade of violet represents the higher glucose consumption typical of malignant cells.
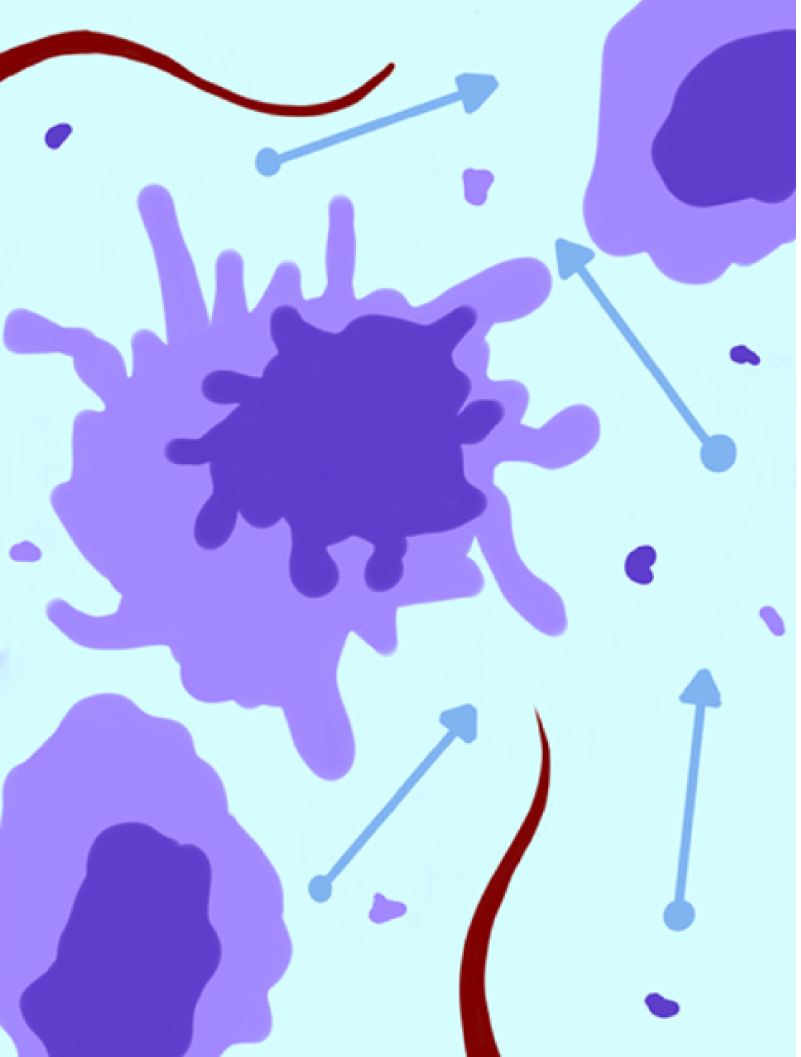
Figure 4 Schematic representation of neoplastic tissue after treatment.
Cytolysis increases the extracellular space and consequently water diffusion and reduces lesion vascularization and metabolism.
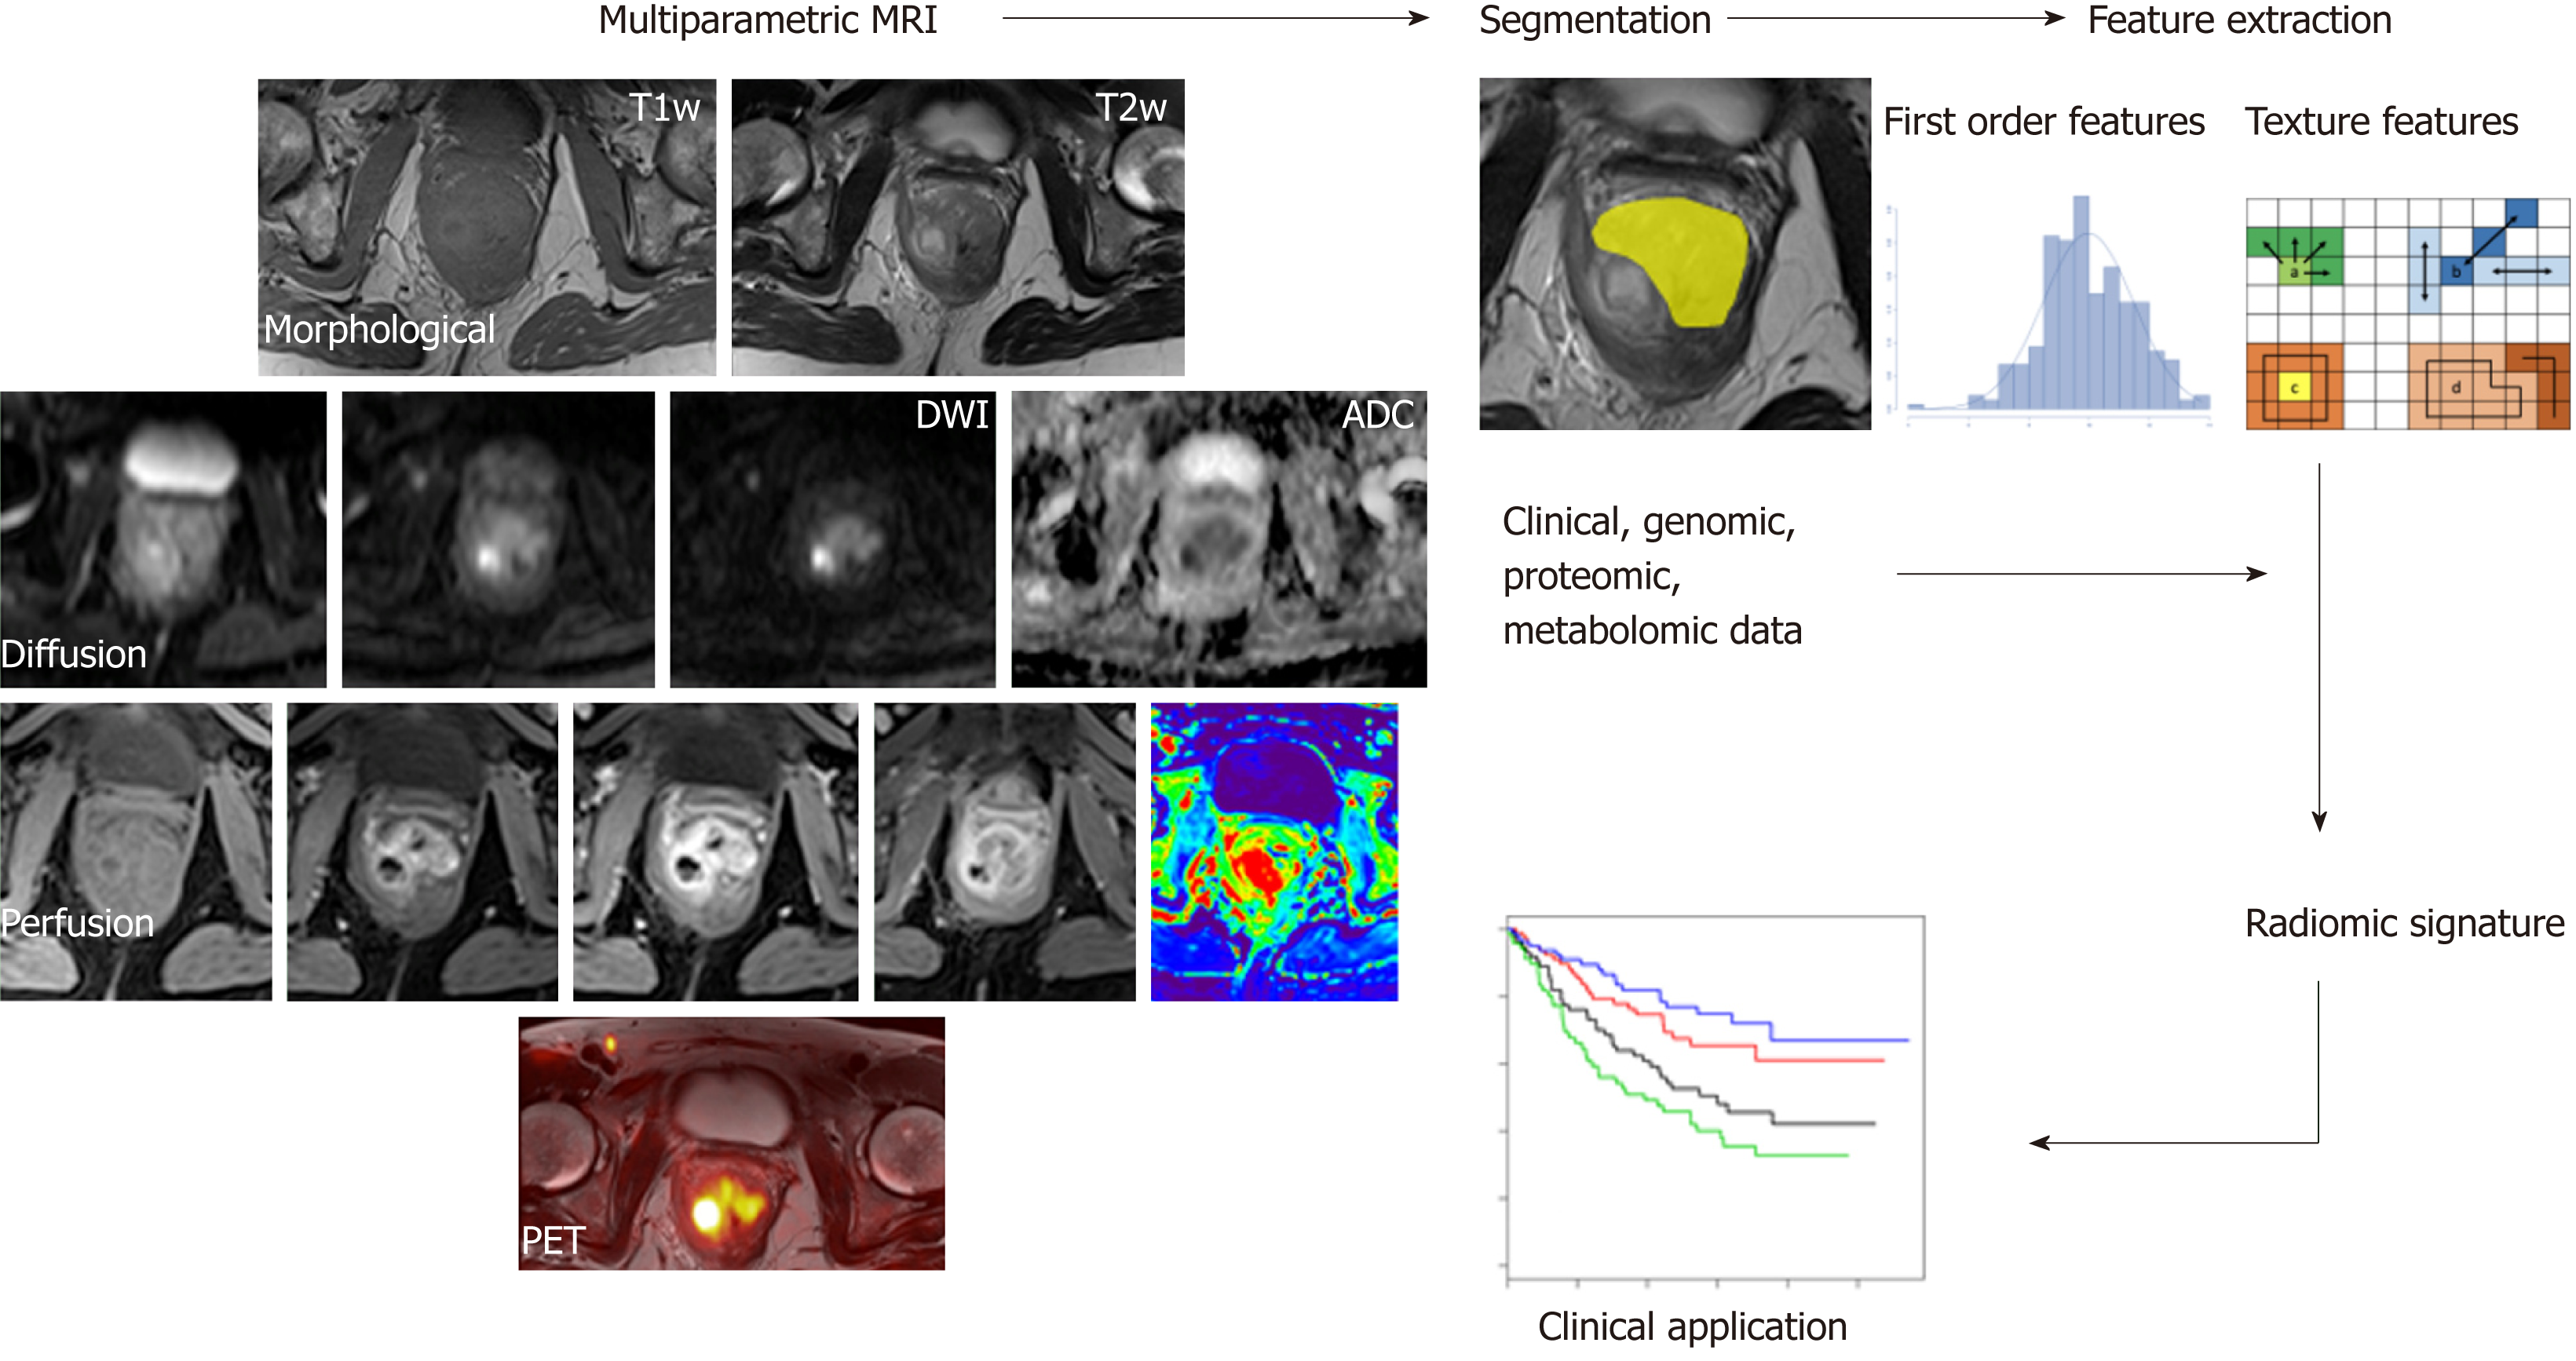
Figure 5 A typical radiomics workflow consists of several steps.
After image acquisition, segmentation is performed to define the tumor region. From this region, several features are extracted based on the intensity histogram and texture analysis. Finally, these features are assessed for their prognostic power or are linked with the stage or gene expression.
- Citation: Mainenti PP, Stanzione A, Guarino S, Romeo V, Ugga L, Romano F, Storto G, Maurea S, Brunetti A. Colorectal cancer: Parametric evaluation of morphological, functional and molecular tomographic imaging. World J Gastroenterol 2019; 25(35): 5233-5256
- URL: https://www.wjgnet.com/1007-9327/full/v25/i35/5233.htm
- DOI: https://dx.doi.org/10.3748/wjg.v25.i35.5233


