Copyright
©The Author(s) 2019.
World J Gastroenterol. Sep 14, 2019; 25(34): 5210-5219
Published online Sep 14, 2019. doi: 10.3748/wjg.v25.i34.5210
Published online Sep 14, 2019. doi: 10.3748/wjg.v25.i34.5210
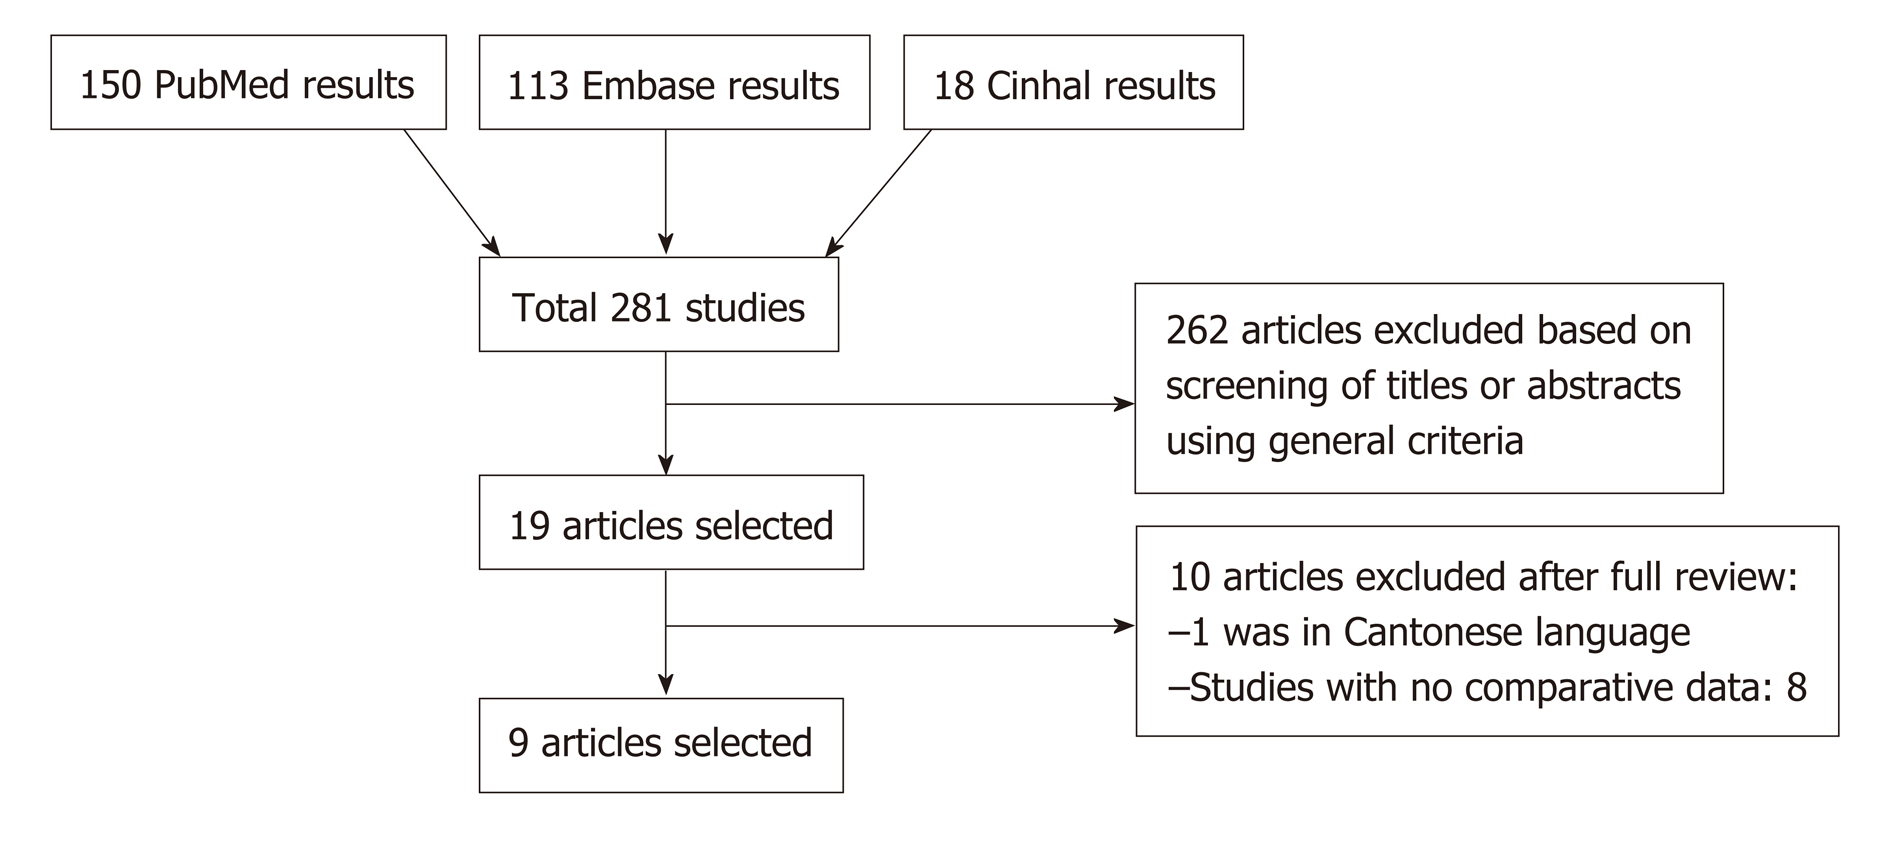
Figure 1 PRISMA diagram of the literature search.
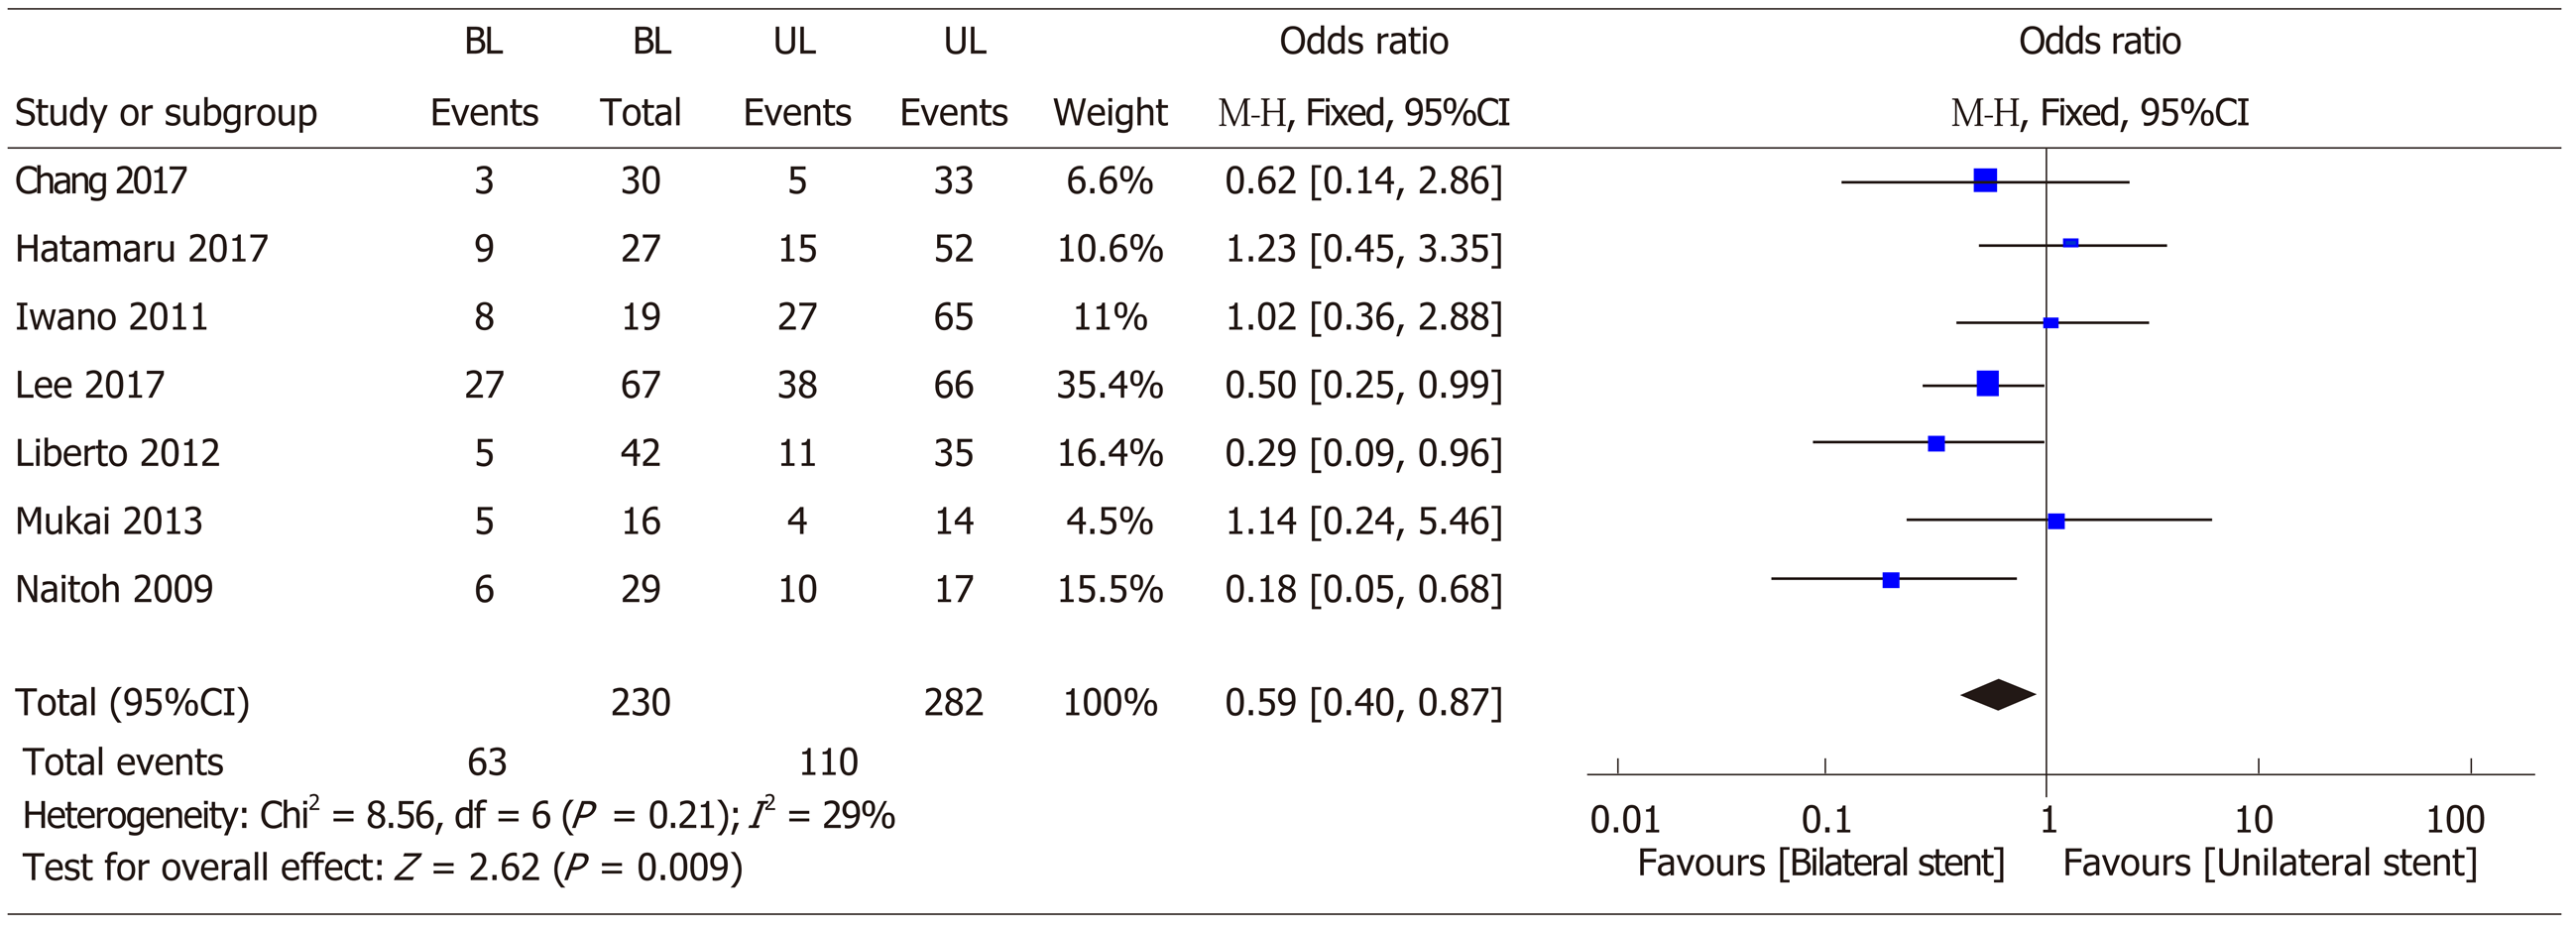
Figure 2 Forest plot of re-intervention rates with bilateral self expanding metal stents vs unilateral stent.
SEMS: Self expanding metal stents; OR: Odds ratio; CI: Confidence interval.
Figure 3 Cochrane collaboration tool.
Risk assessment.
Figure 4 Forest plot of technical success rates with bilateral self expanding metal stents vs unilateral stent.
SEMS: Self expanding metal stents; OR: Odds ratio; CI: Confidence interval.
Figure 5 Forest plot of early complication rates with bilateral self expanding metal stents vs unilateral stent.
SEMS: Self expanding metal stents; OR: Odds ratio; CI: Confidence interval.
Figure 6 Forest plot of late complication rates with bilateral self expanding metal stents vs unilateral stent.
SEMS: Self expanding metal stents; OR: Odds ratio; CI: Confidence interval.
Figure 7 Forest plot of stent malfunction rates with bilateral self expanding metal stents vs unilateral stent.
SEMS: Self expanding metal stents; OR: Odds ratio; CI: Confidence interval.
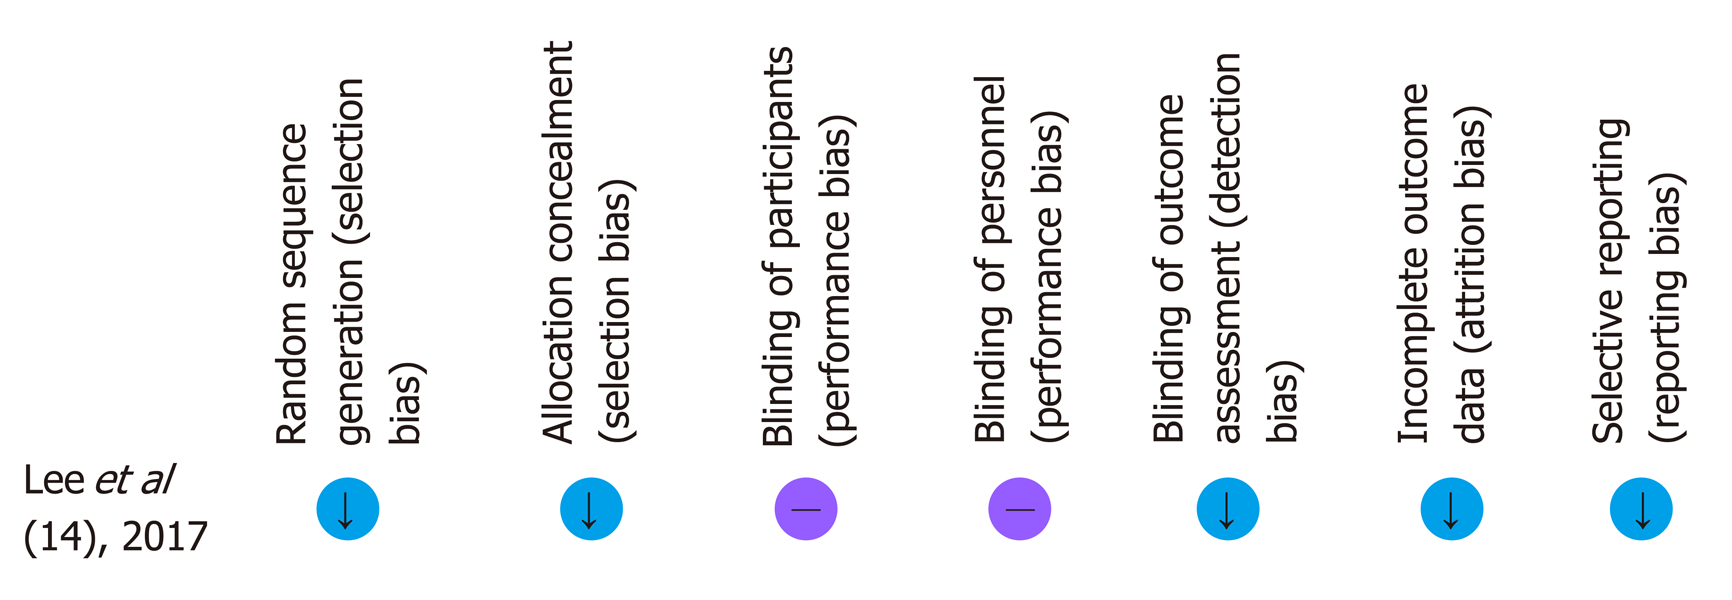
Figure 8 Risk of bias summary: Review authors' judgements about each risk of bias item for each included study.
- Citation: Ashat M, Arora S, Klair JS, Childs CA, Murali AR, Johlin FC. Bilateral vs unilateral placement of metal stents for inoperable high-grade hilar biliary strictures: A systemic review and meta-analysis. World J Gastroenterol 2019; 25(34): 5210-5219
- URL: https://www.wjgnet.com/1007-9327/full/v25/i34/5210.htm
- DOI: https://dx.doi.org/10.3748/wjg.v25.i34.5210


