Copyright
©The Author(s) 2019.
World J Gastroenterol. Sep 7, 2019; 25(33): 4959-4969
Published online Sep 7, 2019. doi: 10.3748/wjg.v25.i33.4959
Published online Sep 7, 2019. doi: 10.3748/wjg.v25.i33.4959
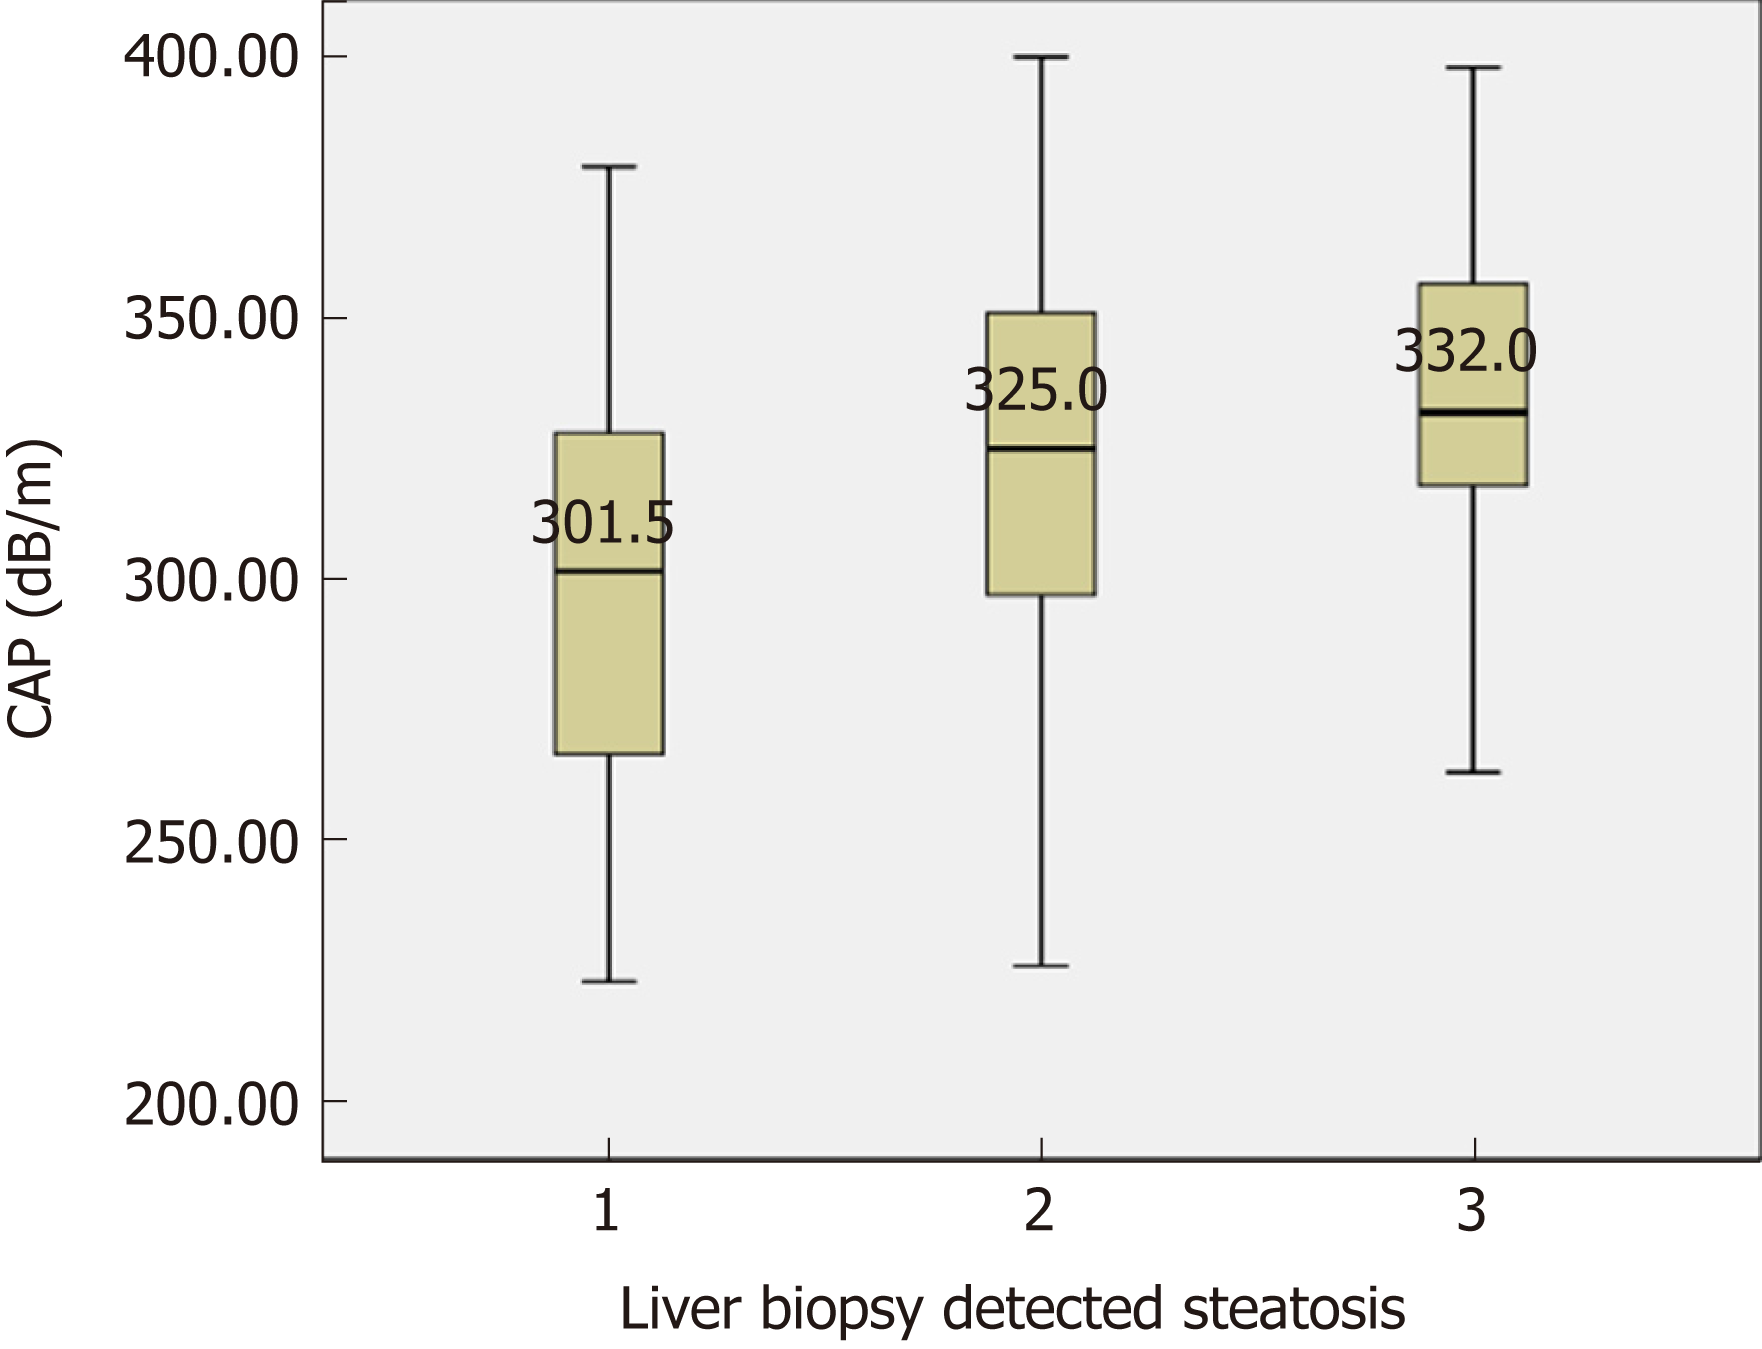
Figure 1 Distribution of controlled attenuation parameter scores according to histologically assessed steatosis grades (S).
CAP: Controlled attenuation parameter.
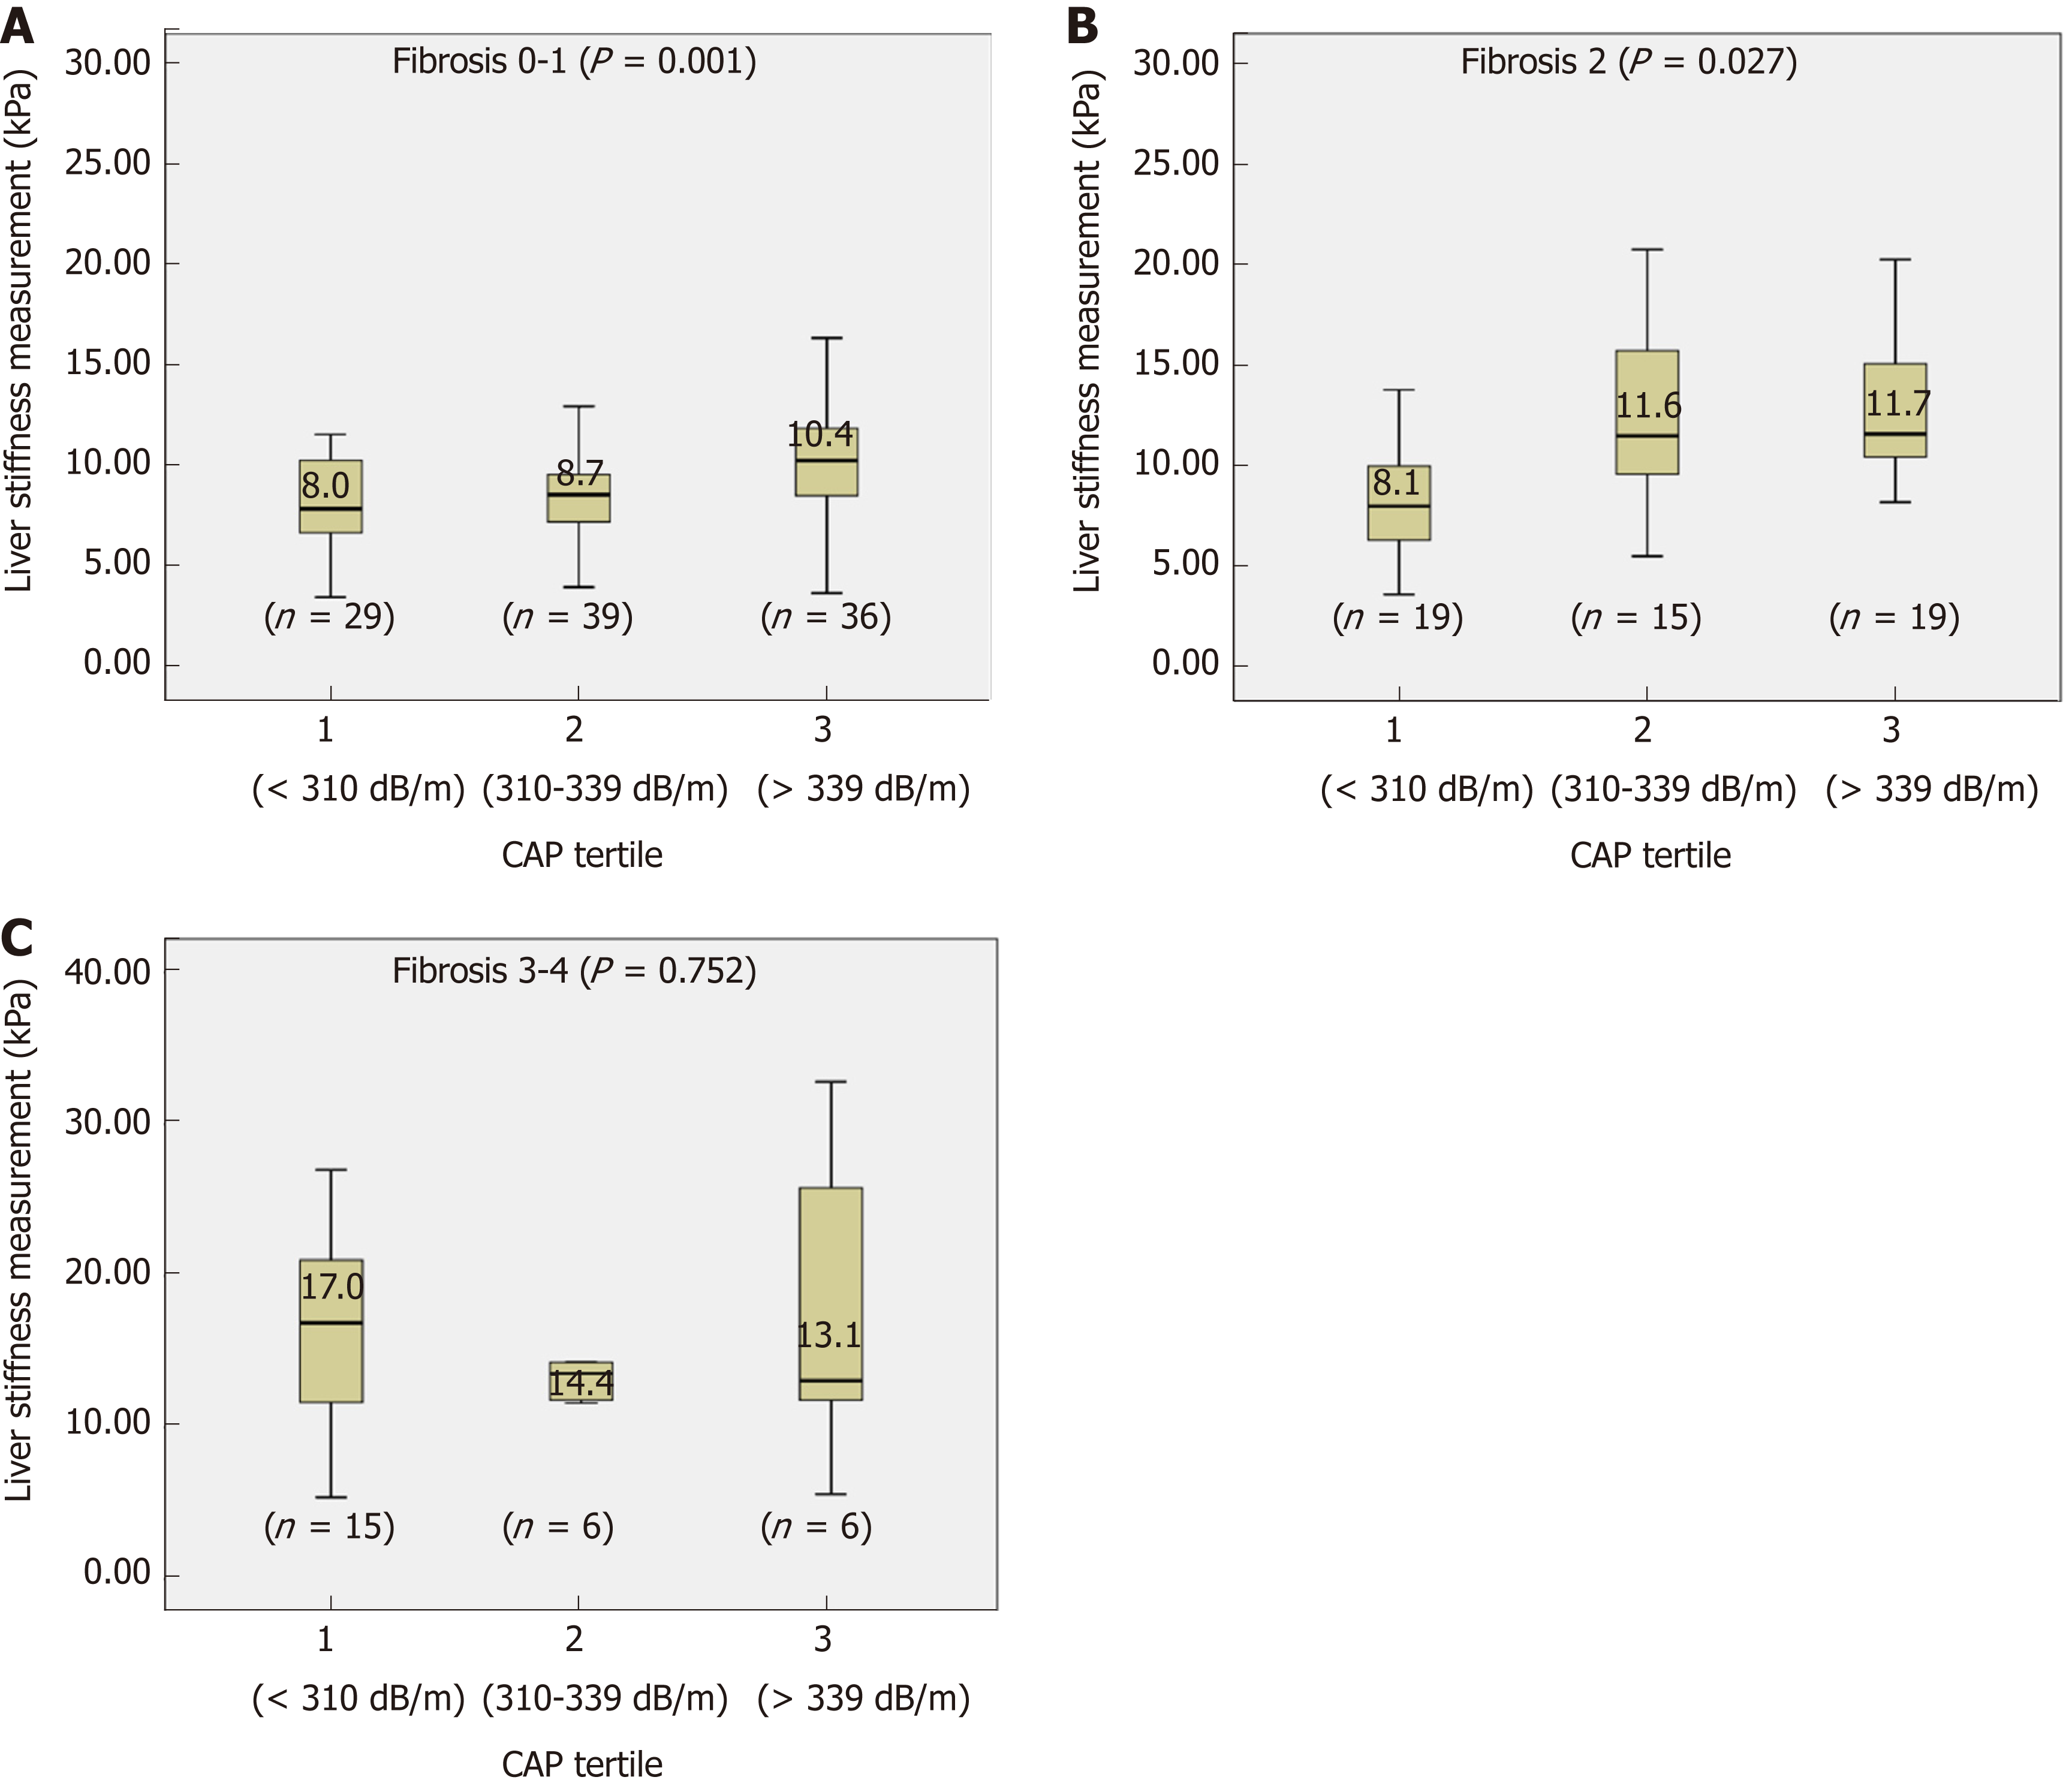
Figure 2 Distribution of liver stiffness values within the same Kleiner fibrosis stages (F0-4) in different controlled attenuation parameter tertiles.
A: F0-1; B: F2; C: F3-4. CAP: Controlled attenuation parameter.
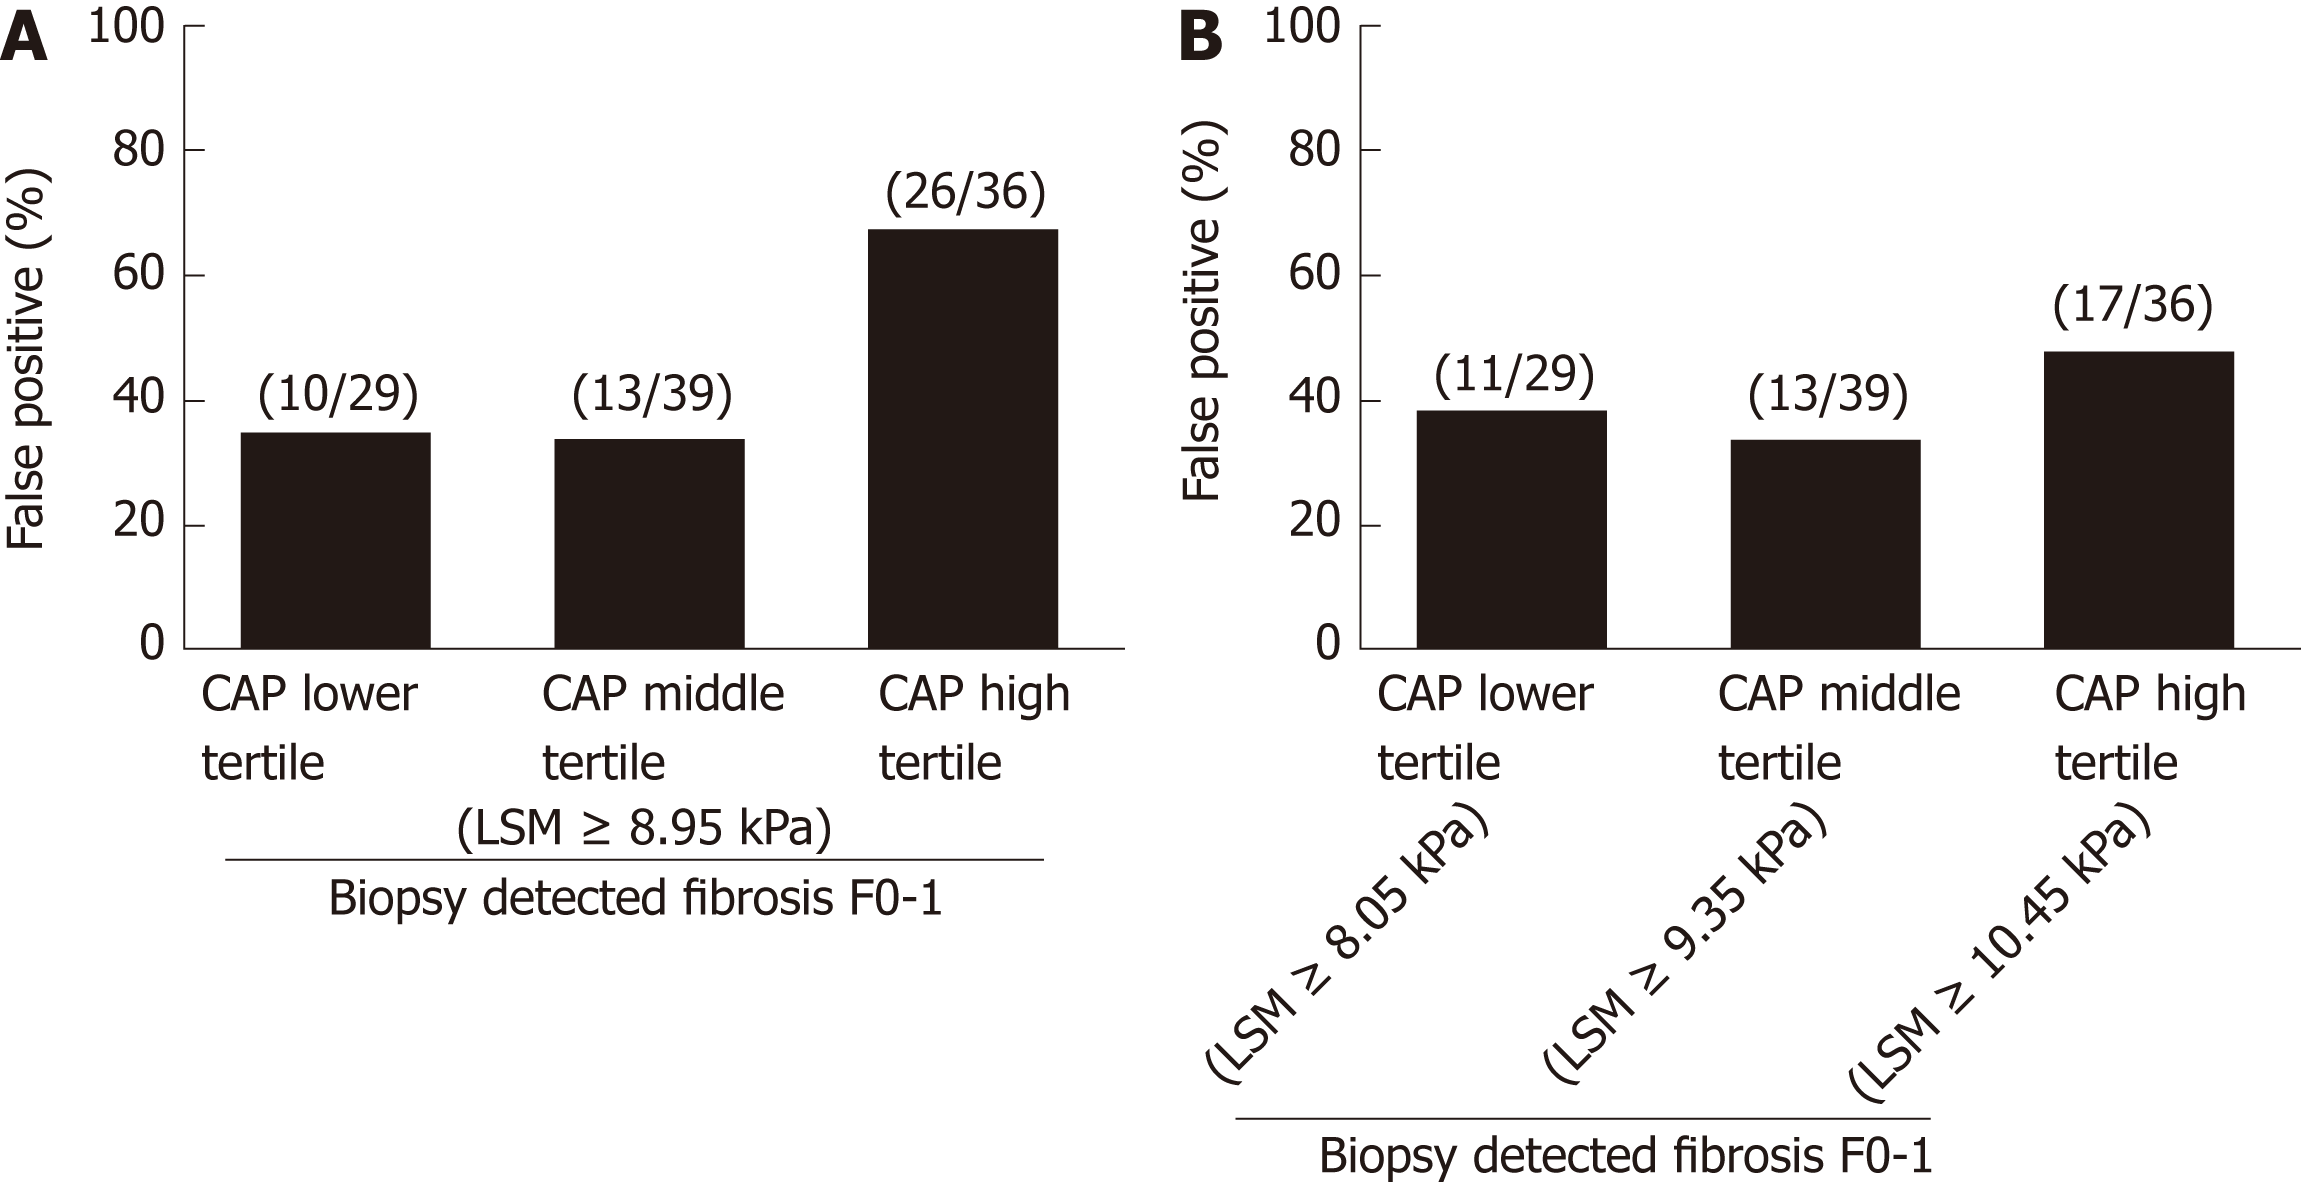
Figure 3 False-positive rates when evaluating liver fibrosis stages by liver stiffness measurements.
A: The cutoff of 8.95 kPa for detecting Kleiner fibrosis stage (F) ≥ 2 was applied in all controlled attenuation parameter (CAP) tertiles; B: Different cutoffs were applied according to CAP tertiles. CAP: Controlled attenuation parameter; LSM: Liver stiffness measurements.
Figure 4 Change in the proportion of liver stiffness measurements predicting significant liver fibrosis, Kleiner fibrosis stage F ≥ 2, after 1-year of pioglitazone or ursodeoxycholic acid treatment.
A: In the lower controlled attenuation parameter (CAP) tertile; B: In the middle CAP tertile; C: In the high CAP tertile. The liver stiffness measurements (LSM) cutoff values for F ≥ 2 are derived from the analysis 184 patients with biopsy proven nonalcoholic steatohepatitis after considering different CAP scores in tertiles. The changes in LSM values are compared by paired t-test. CAP: Controlled attenuation parameter; LSM: Liver stiffness measurements.
- Citation: Lee JI, Lee HW, Lee KS. Value of controlled attenuation parameter in fibrosis prediction in nonalcoholic steatohepatitis. World J Gastroenterol 2019; 25(33): 4959-4969
- URL: https://www.wjgnet.com/1007-9327/full/v25/i33/4959.htm
- DOI: https://dx.doi.org/10.3748/wjg.v25.i33.4959


