Copyright
©The Author(s) 2019.
World J Gastroenterol. Aug 21, 2019; 25(31): 4555-4566
Published online Aug 21, 2019. doi: 10.3748/wjg.v25.i31.4555
Published online Aug 21, 2019. doi: 10.3748/wjg.v25.i31.4555
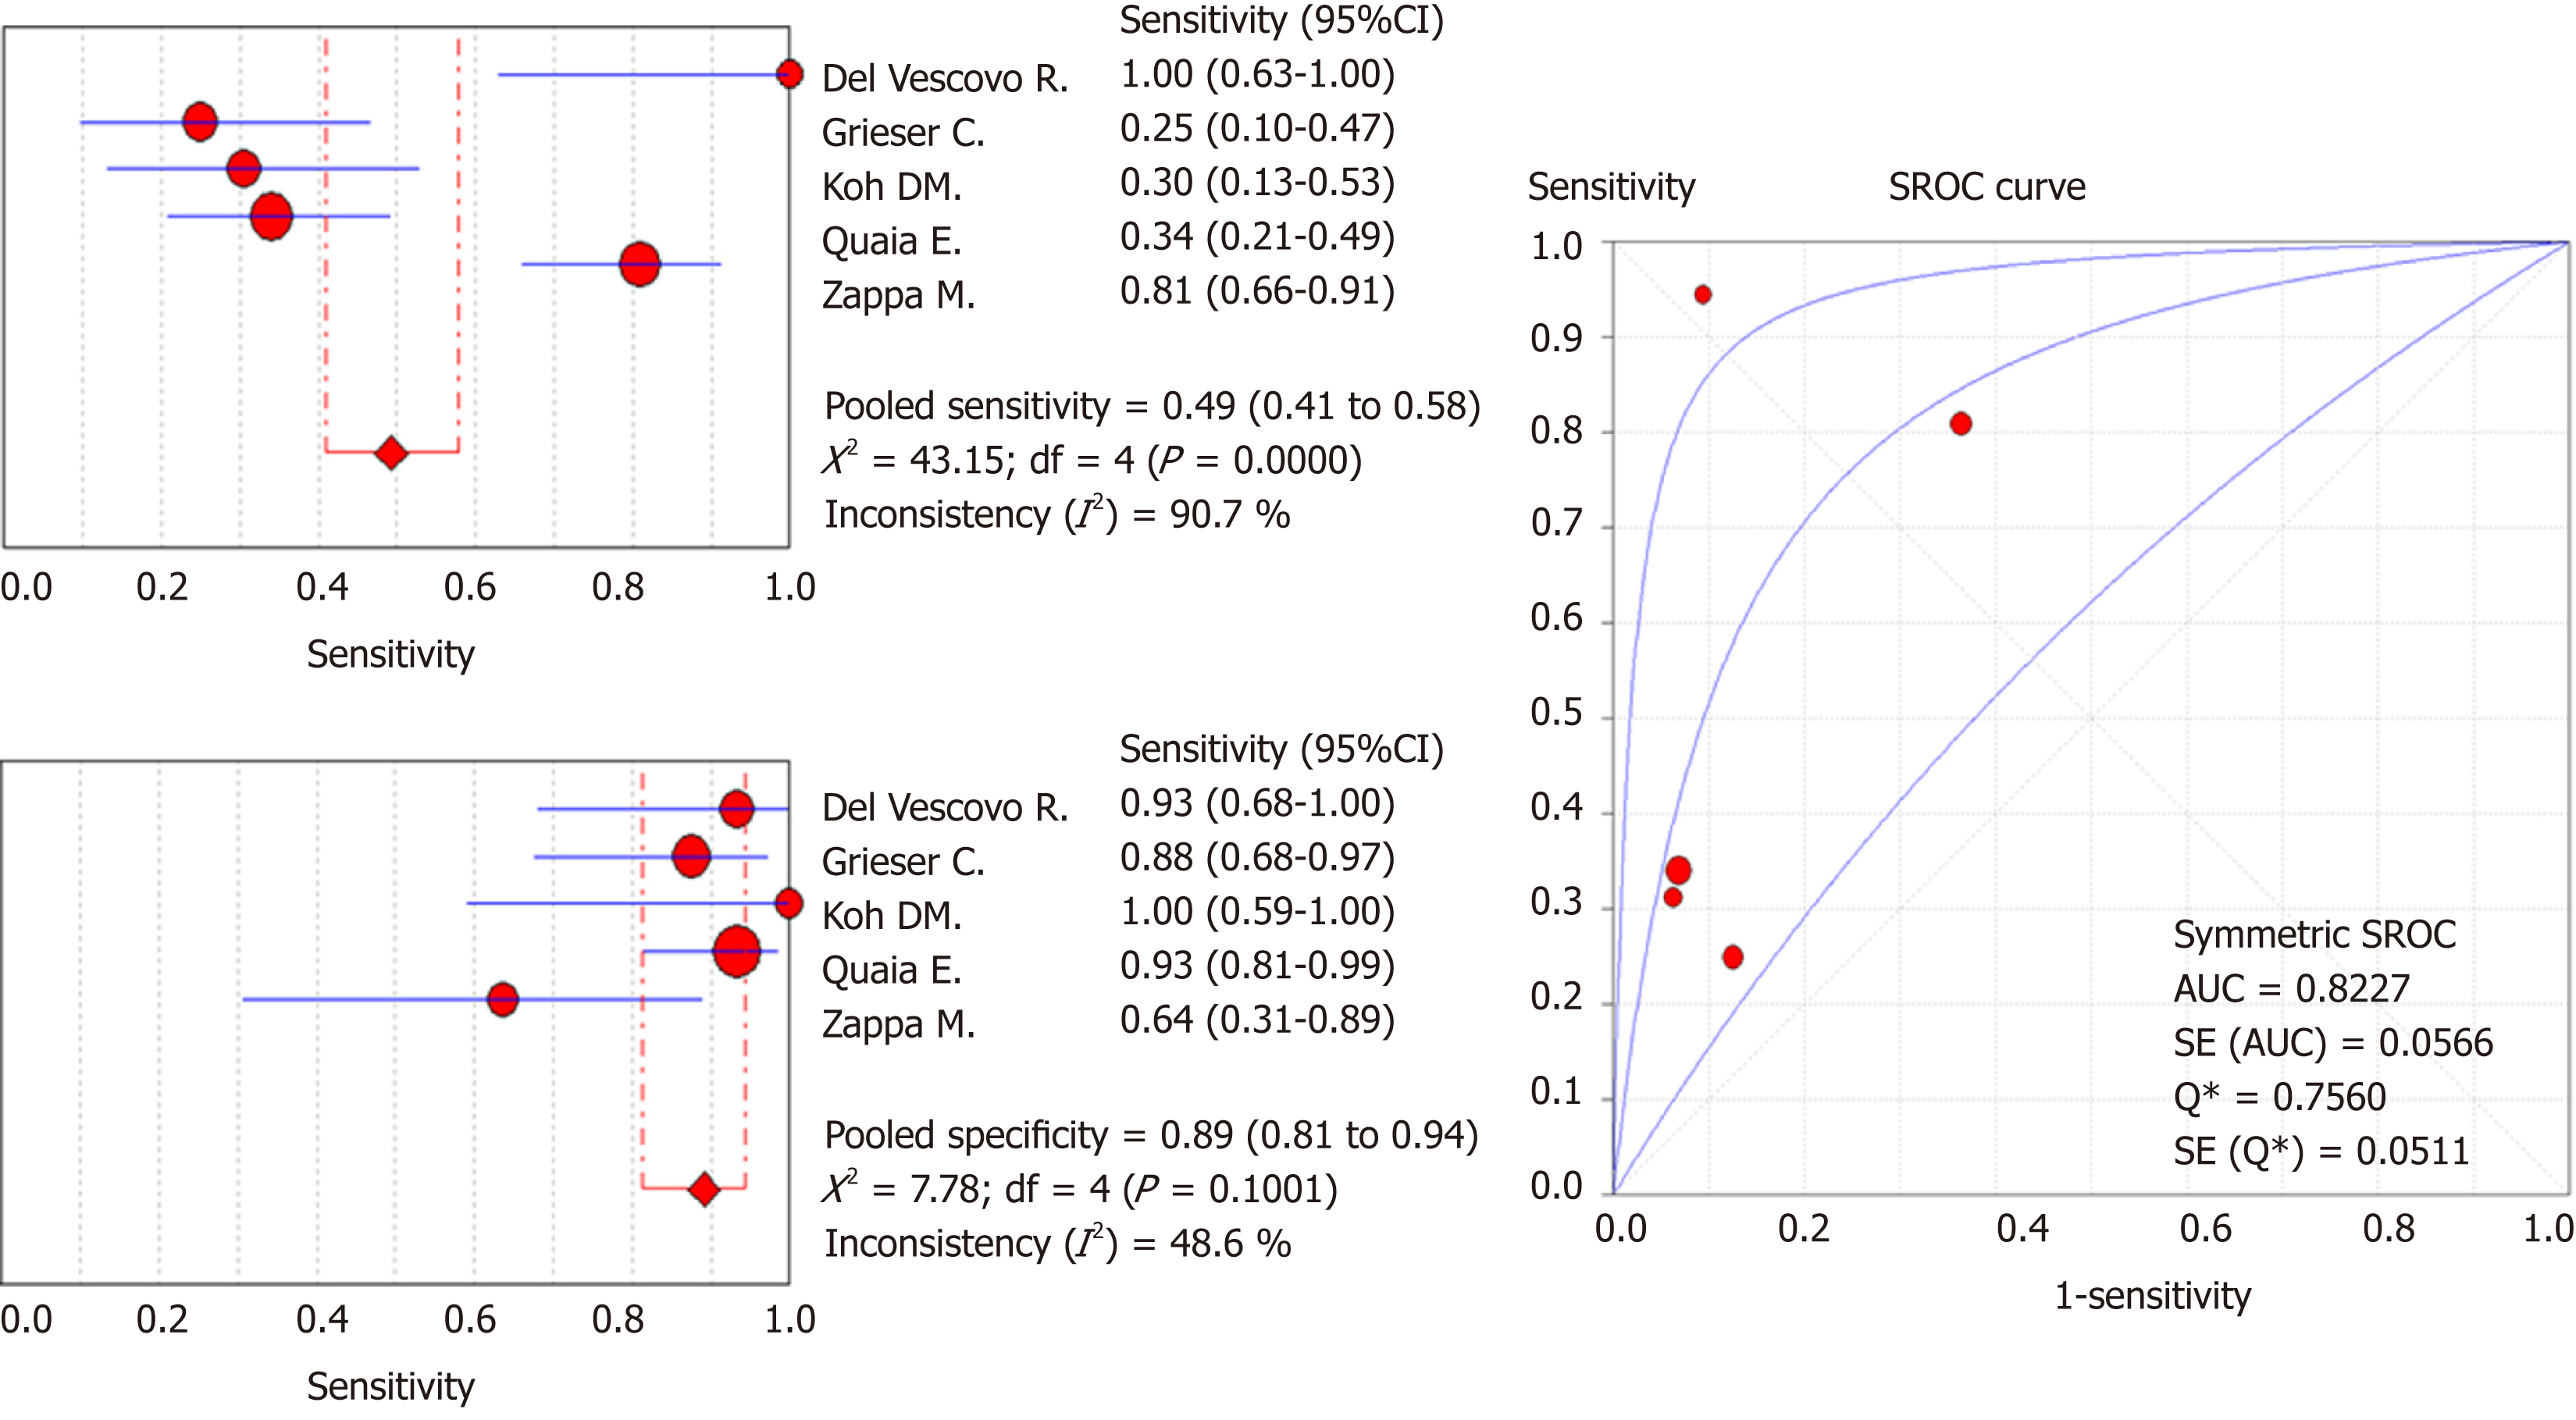
Figure 2 Diagnostic accuracy of layered pattern of enhancement for active Crohn’s disease.
Forest plot of diagnostic sensitivity, specificity, and summary ROC in discriminating active and non-active inflammation. SROC: Summary receiver operating characteristic; AUC: Area under the curve.
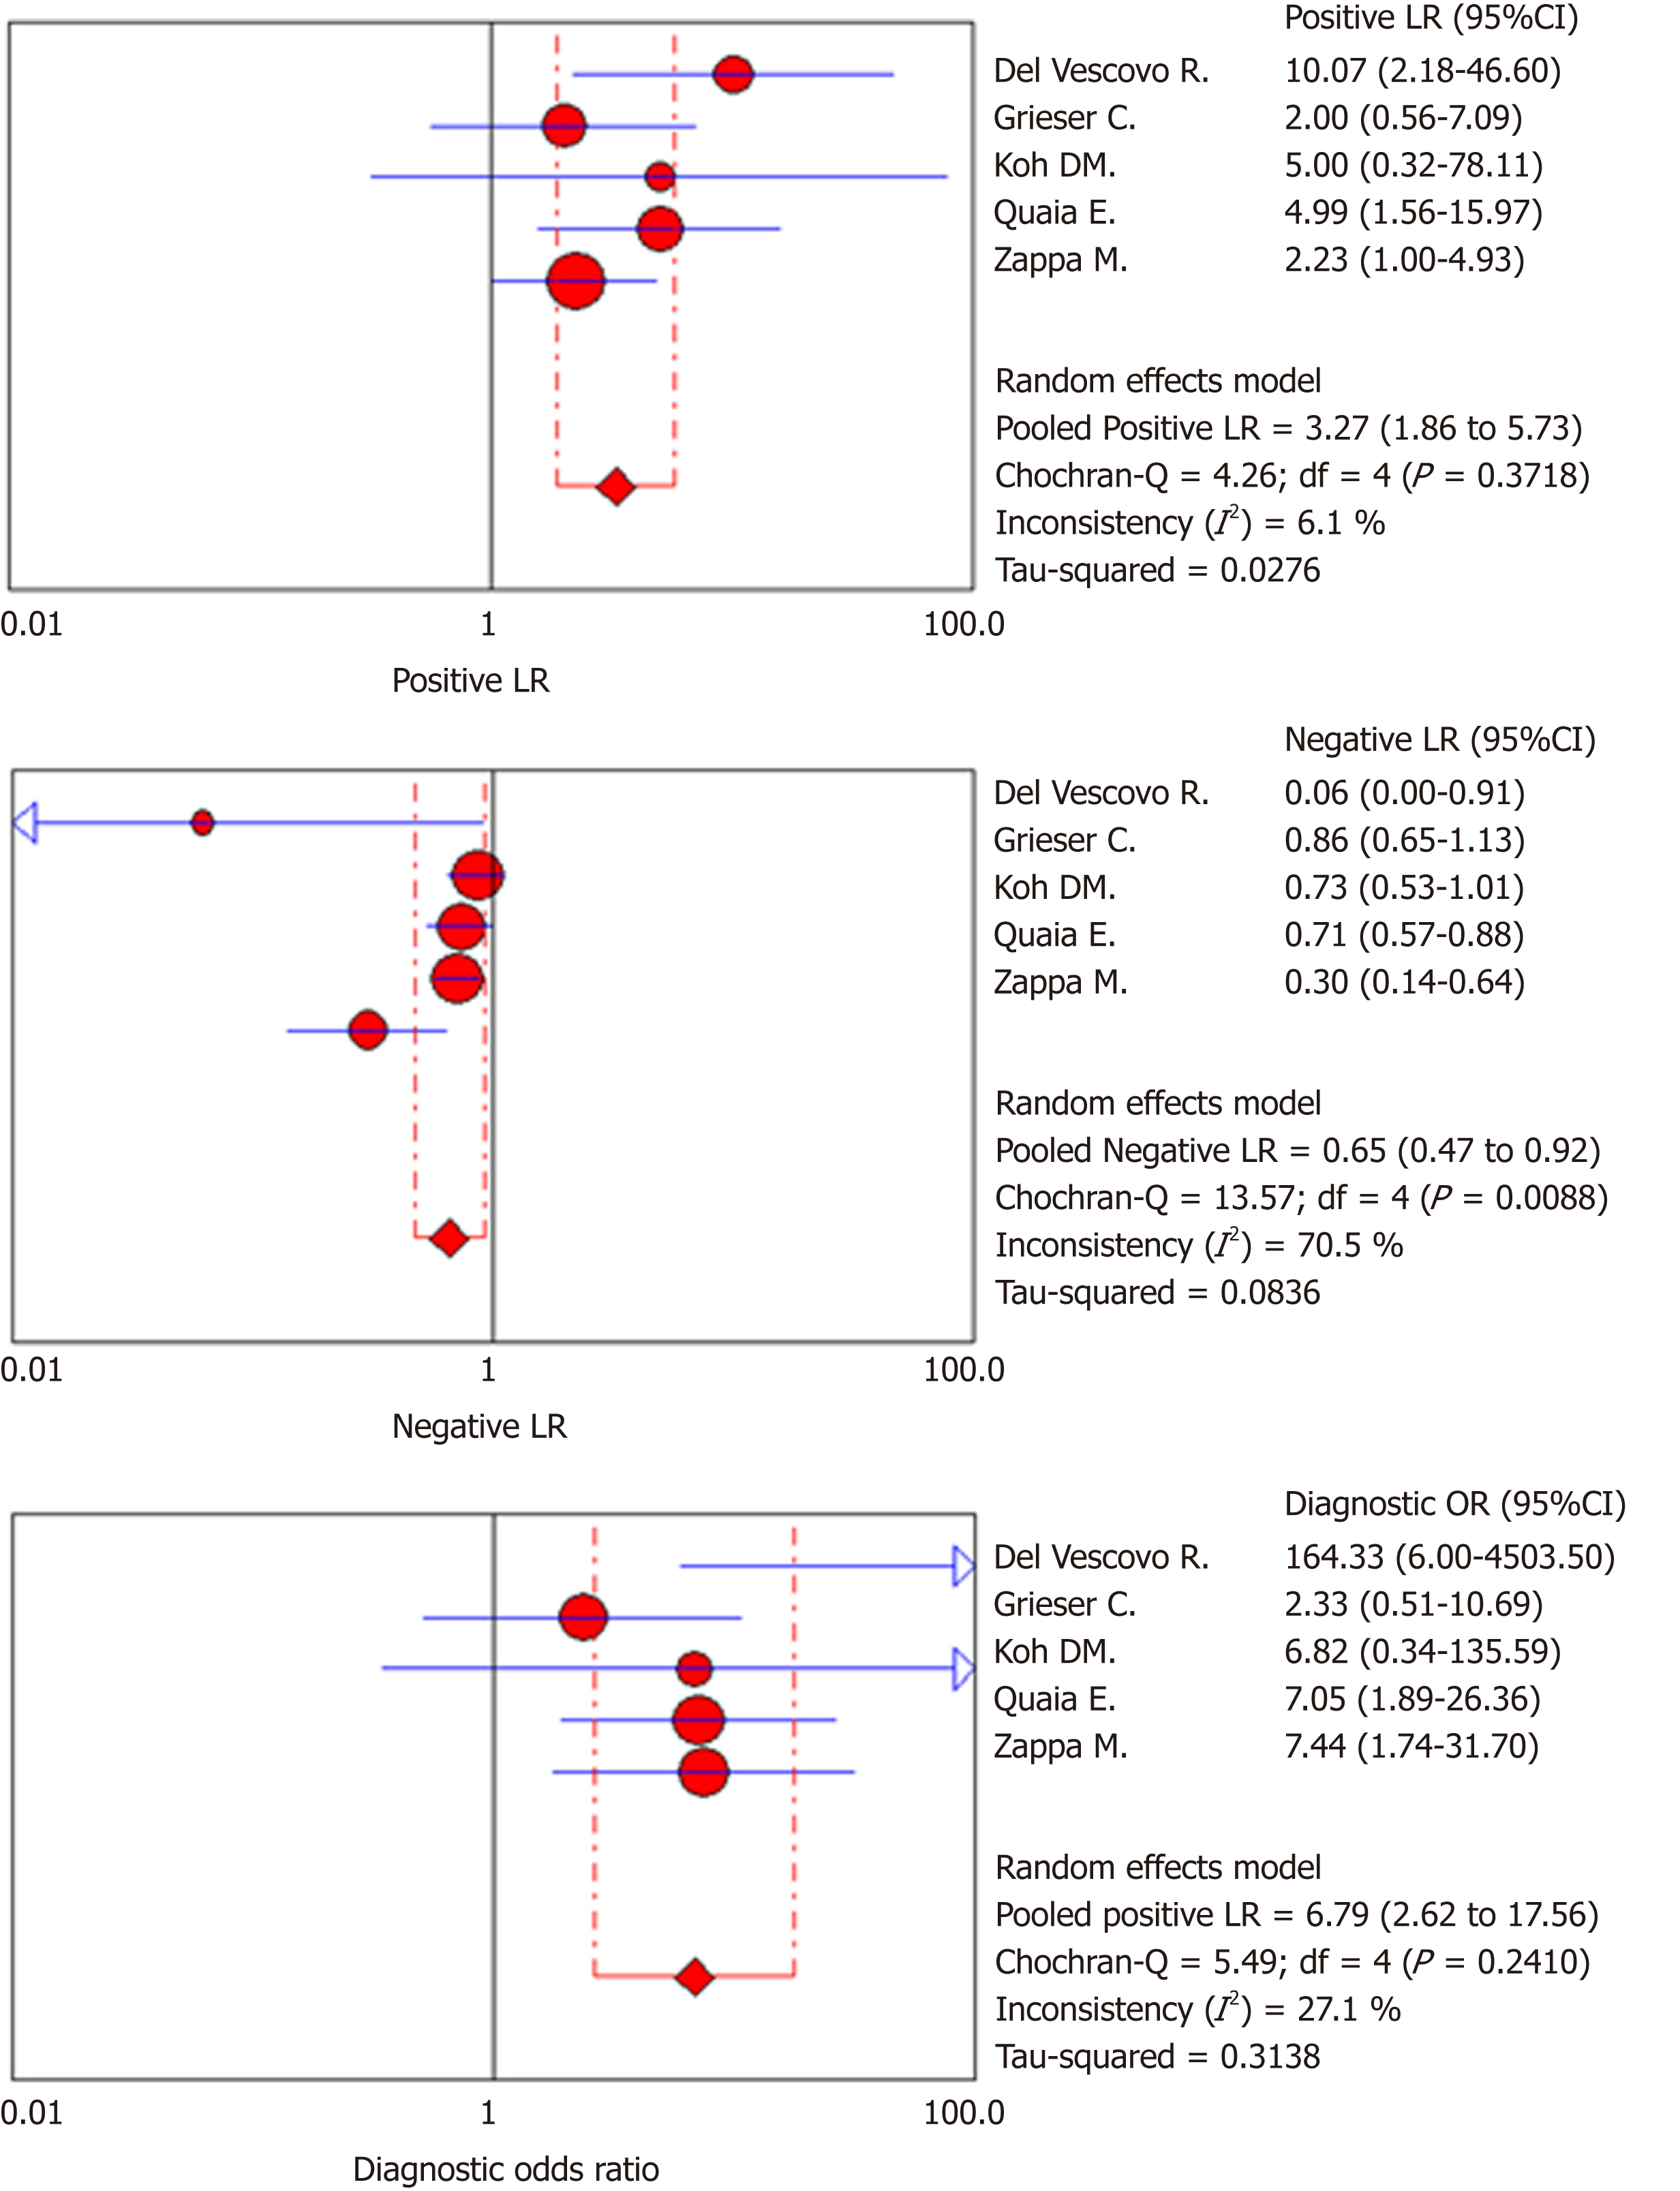
Figure 3 Diagnostic accuracy of layered pattern of enhancement for active Crohn’s disease.
Forest plot of positive likelihood ratio, negative likelihood ratio and diagnostic odds ratio in discriminating active and non-active inflammation. LR: Likelihood ratio.
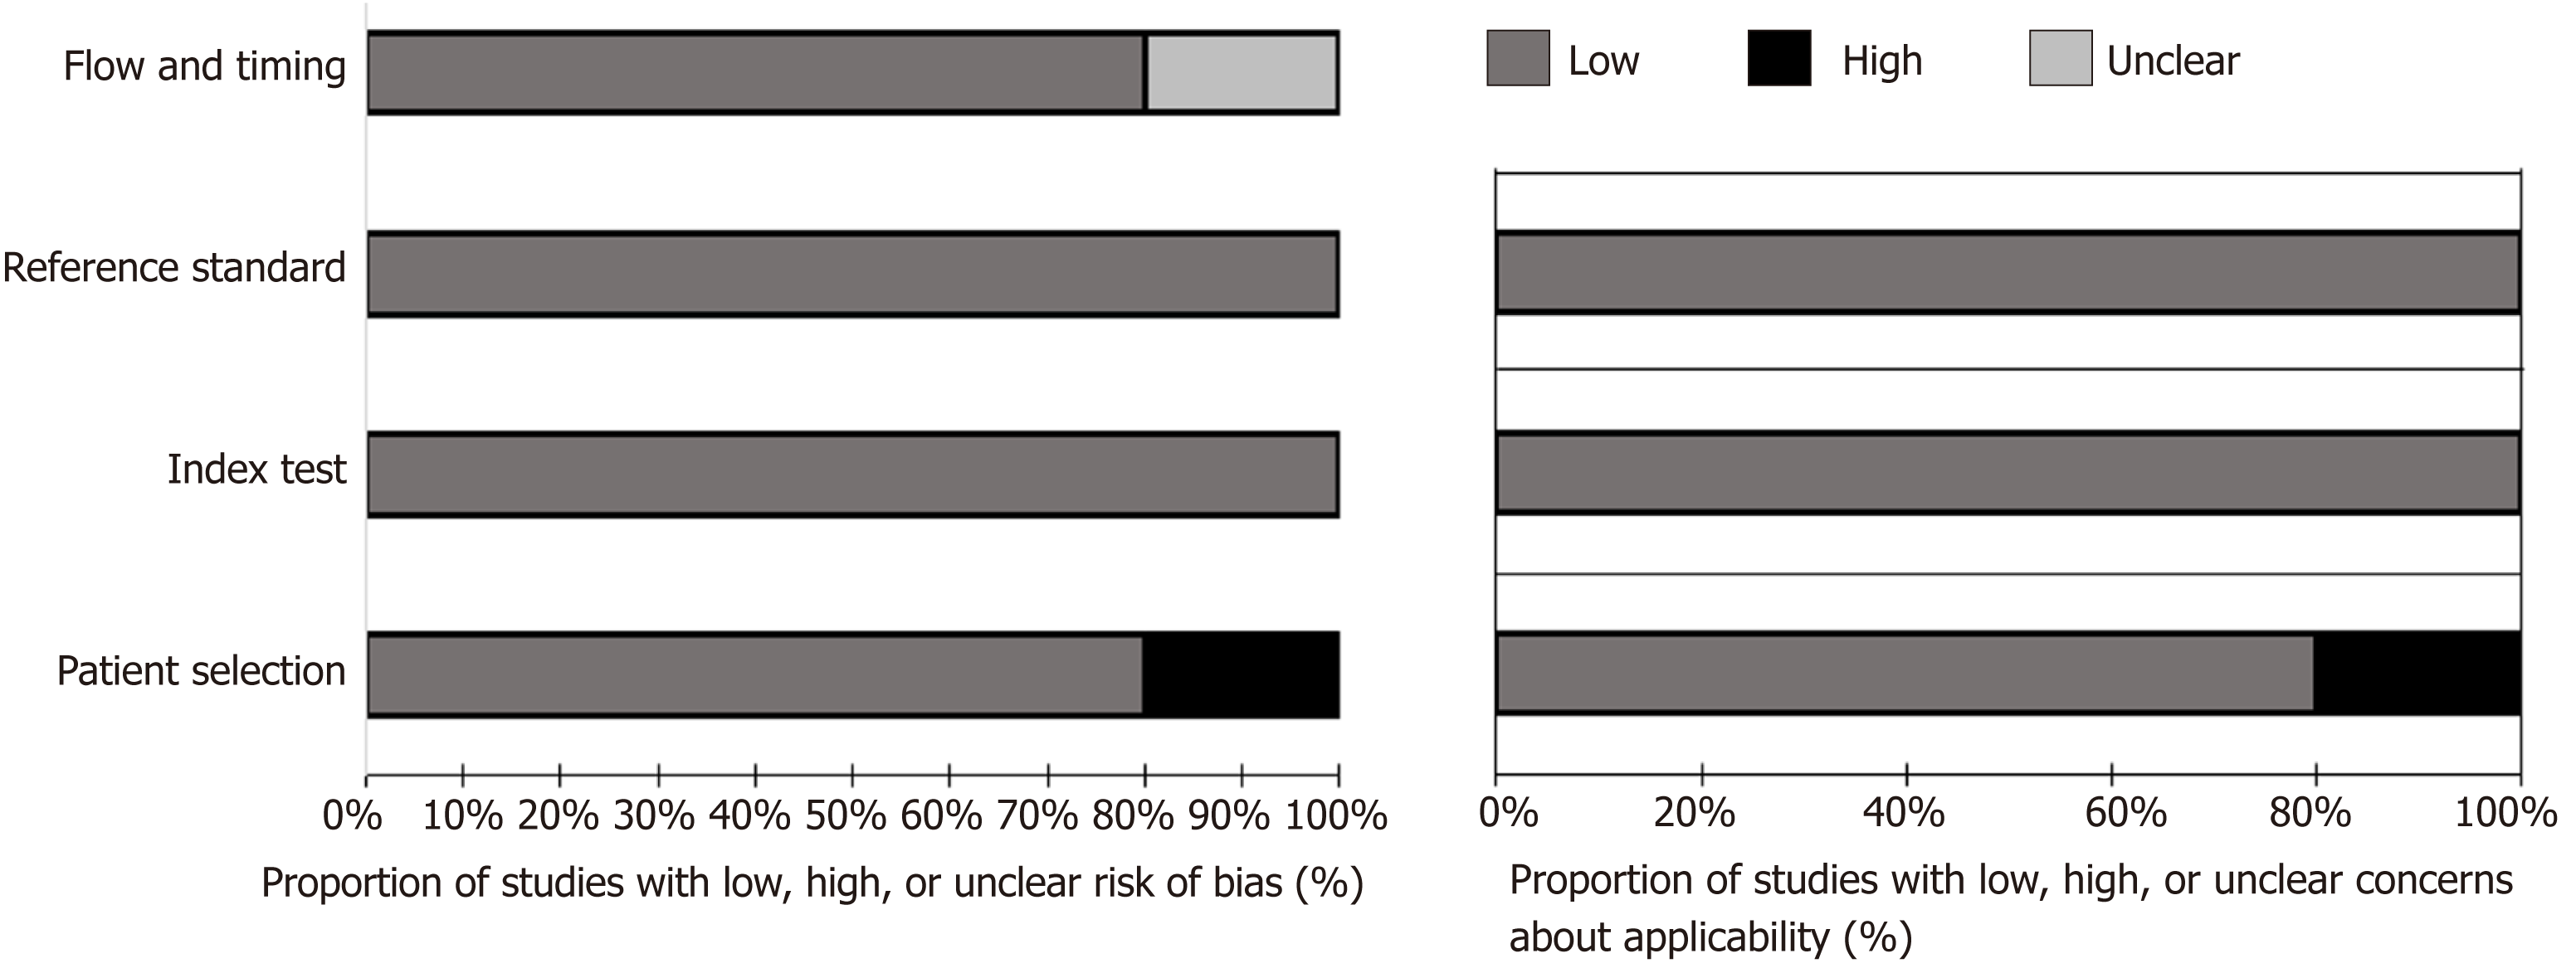
Figure 4 Graphs show evaluation of risk of bias and applicability concerns for the five included studies combined using the quality assessment of diagnostic accuracy studies-2 tool.
Risk of bias and applicability concerns for individuals in included studies are reported in Appendix S3.
- Citation: Bellini D, Rivosecchi F, Panvini N, Rengo M, Caruso D, Carbone I, Ferrari R, Paolantonio P, Laghi A. Layered enhancement at magnetic resonance enterography in inflammatory bowel disease: A meta-analysis. World J Gastroenterol 2019; 25(31): 4555-4566
- URL: https://www.wjgnet.com/1007-9327/full/v25/i31/4555.htm
- DOI: https://dx.doi.org/10.3748/wjg.v25.i31.4555


