Copyright
©The Author(s) 2019.
World J Gastroenterol. Jul 21, 2019; 25(27): 3619-3633
Published online Jul 21, 2019. doi: 10.3748/wjg.v25.i27.3619
Published online Jul 21, 2019. doi: 10.3748/wjg.v25.i27.3619
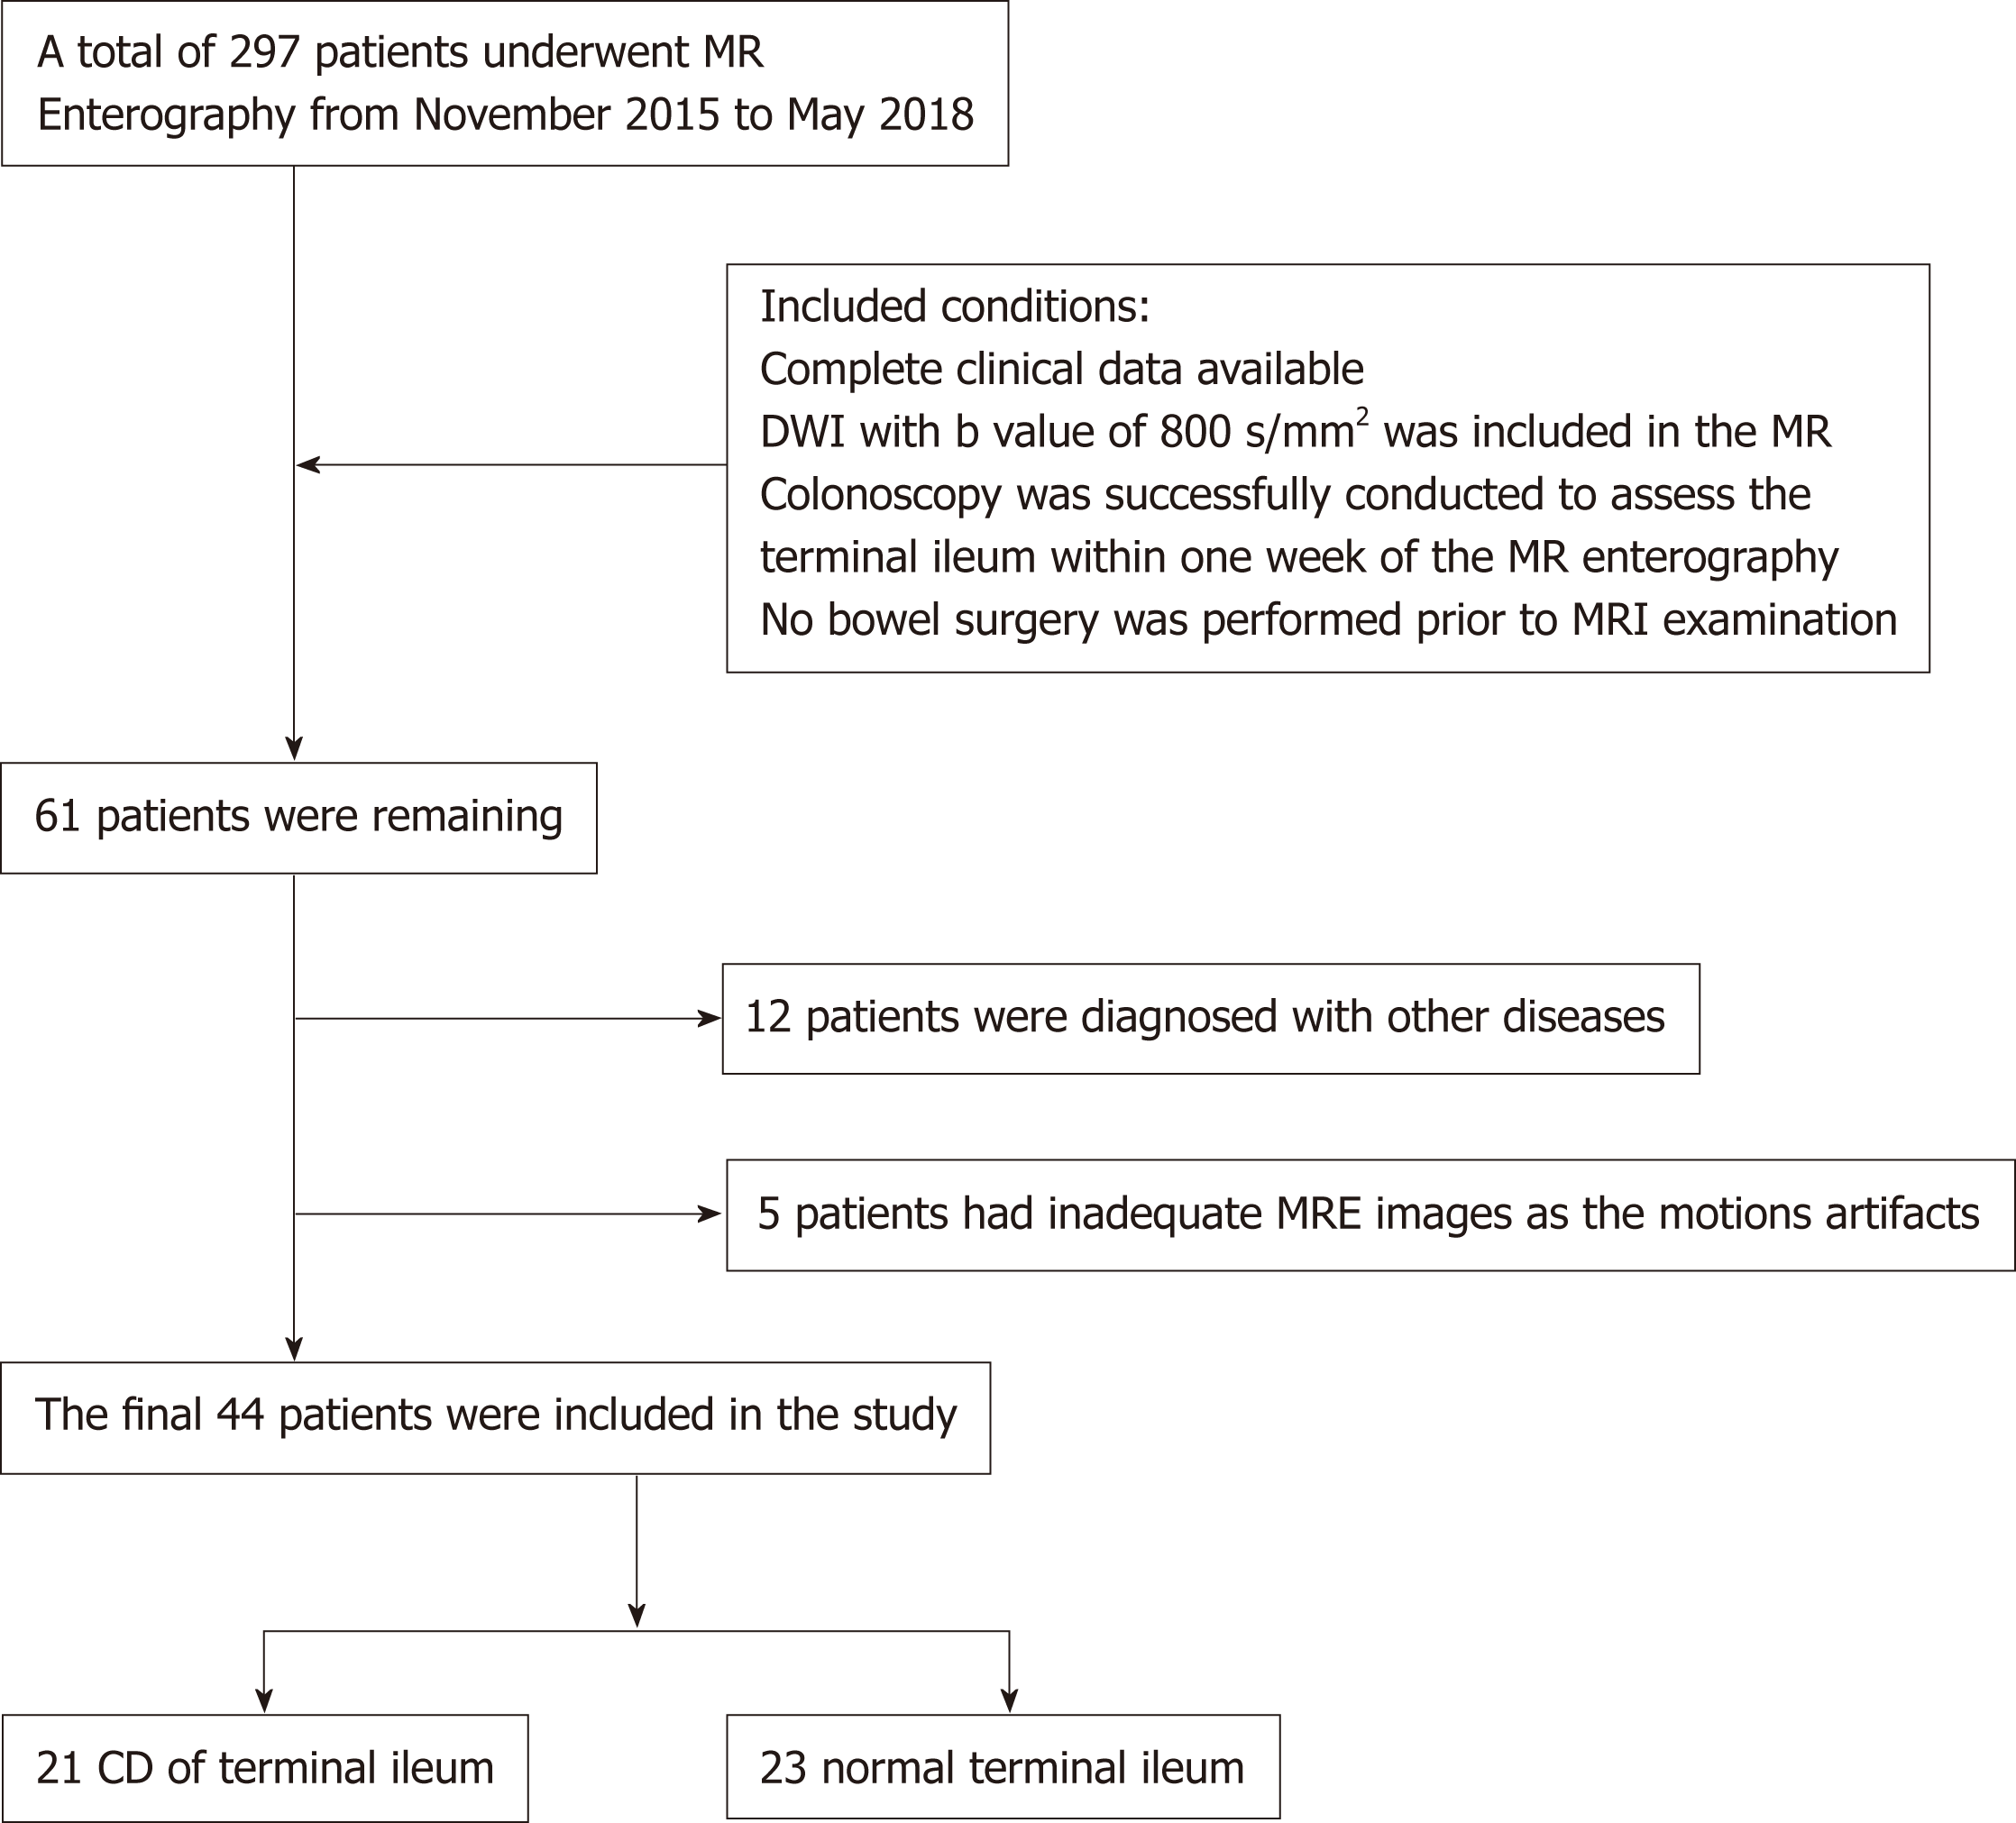
Figure 1 Flow chart illustrating study design.
DWI: Diffusion weighted imaging; CD: Crohn’s disease.
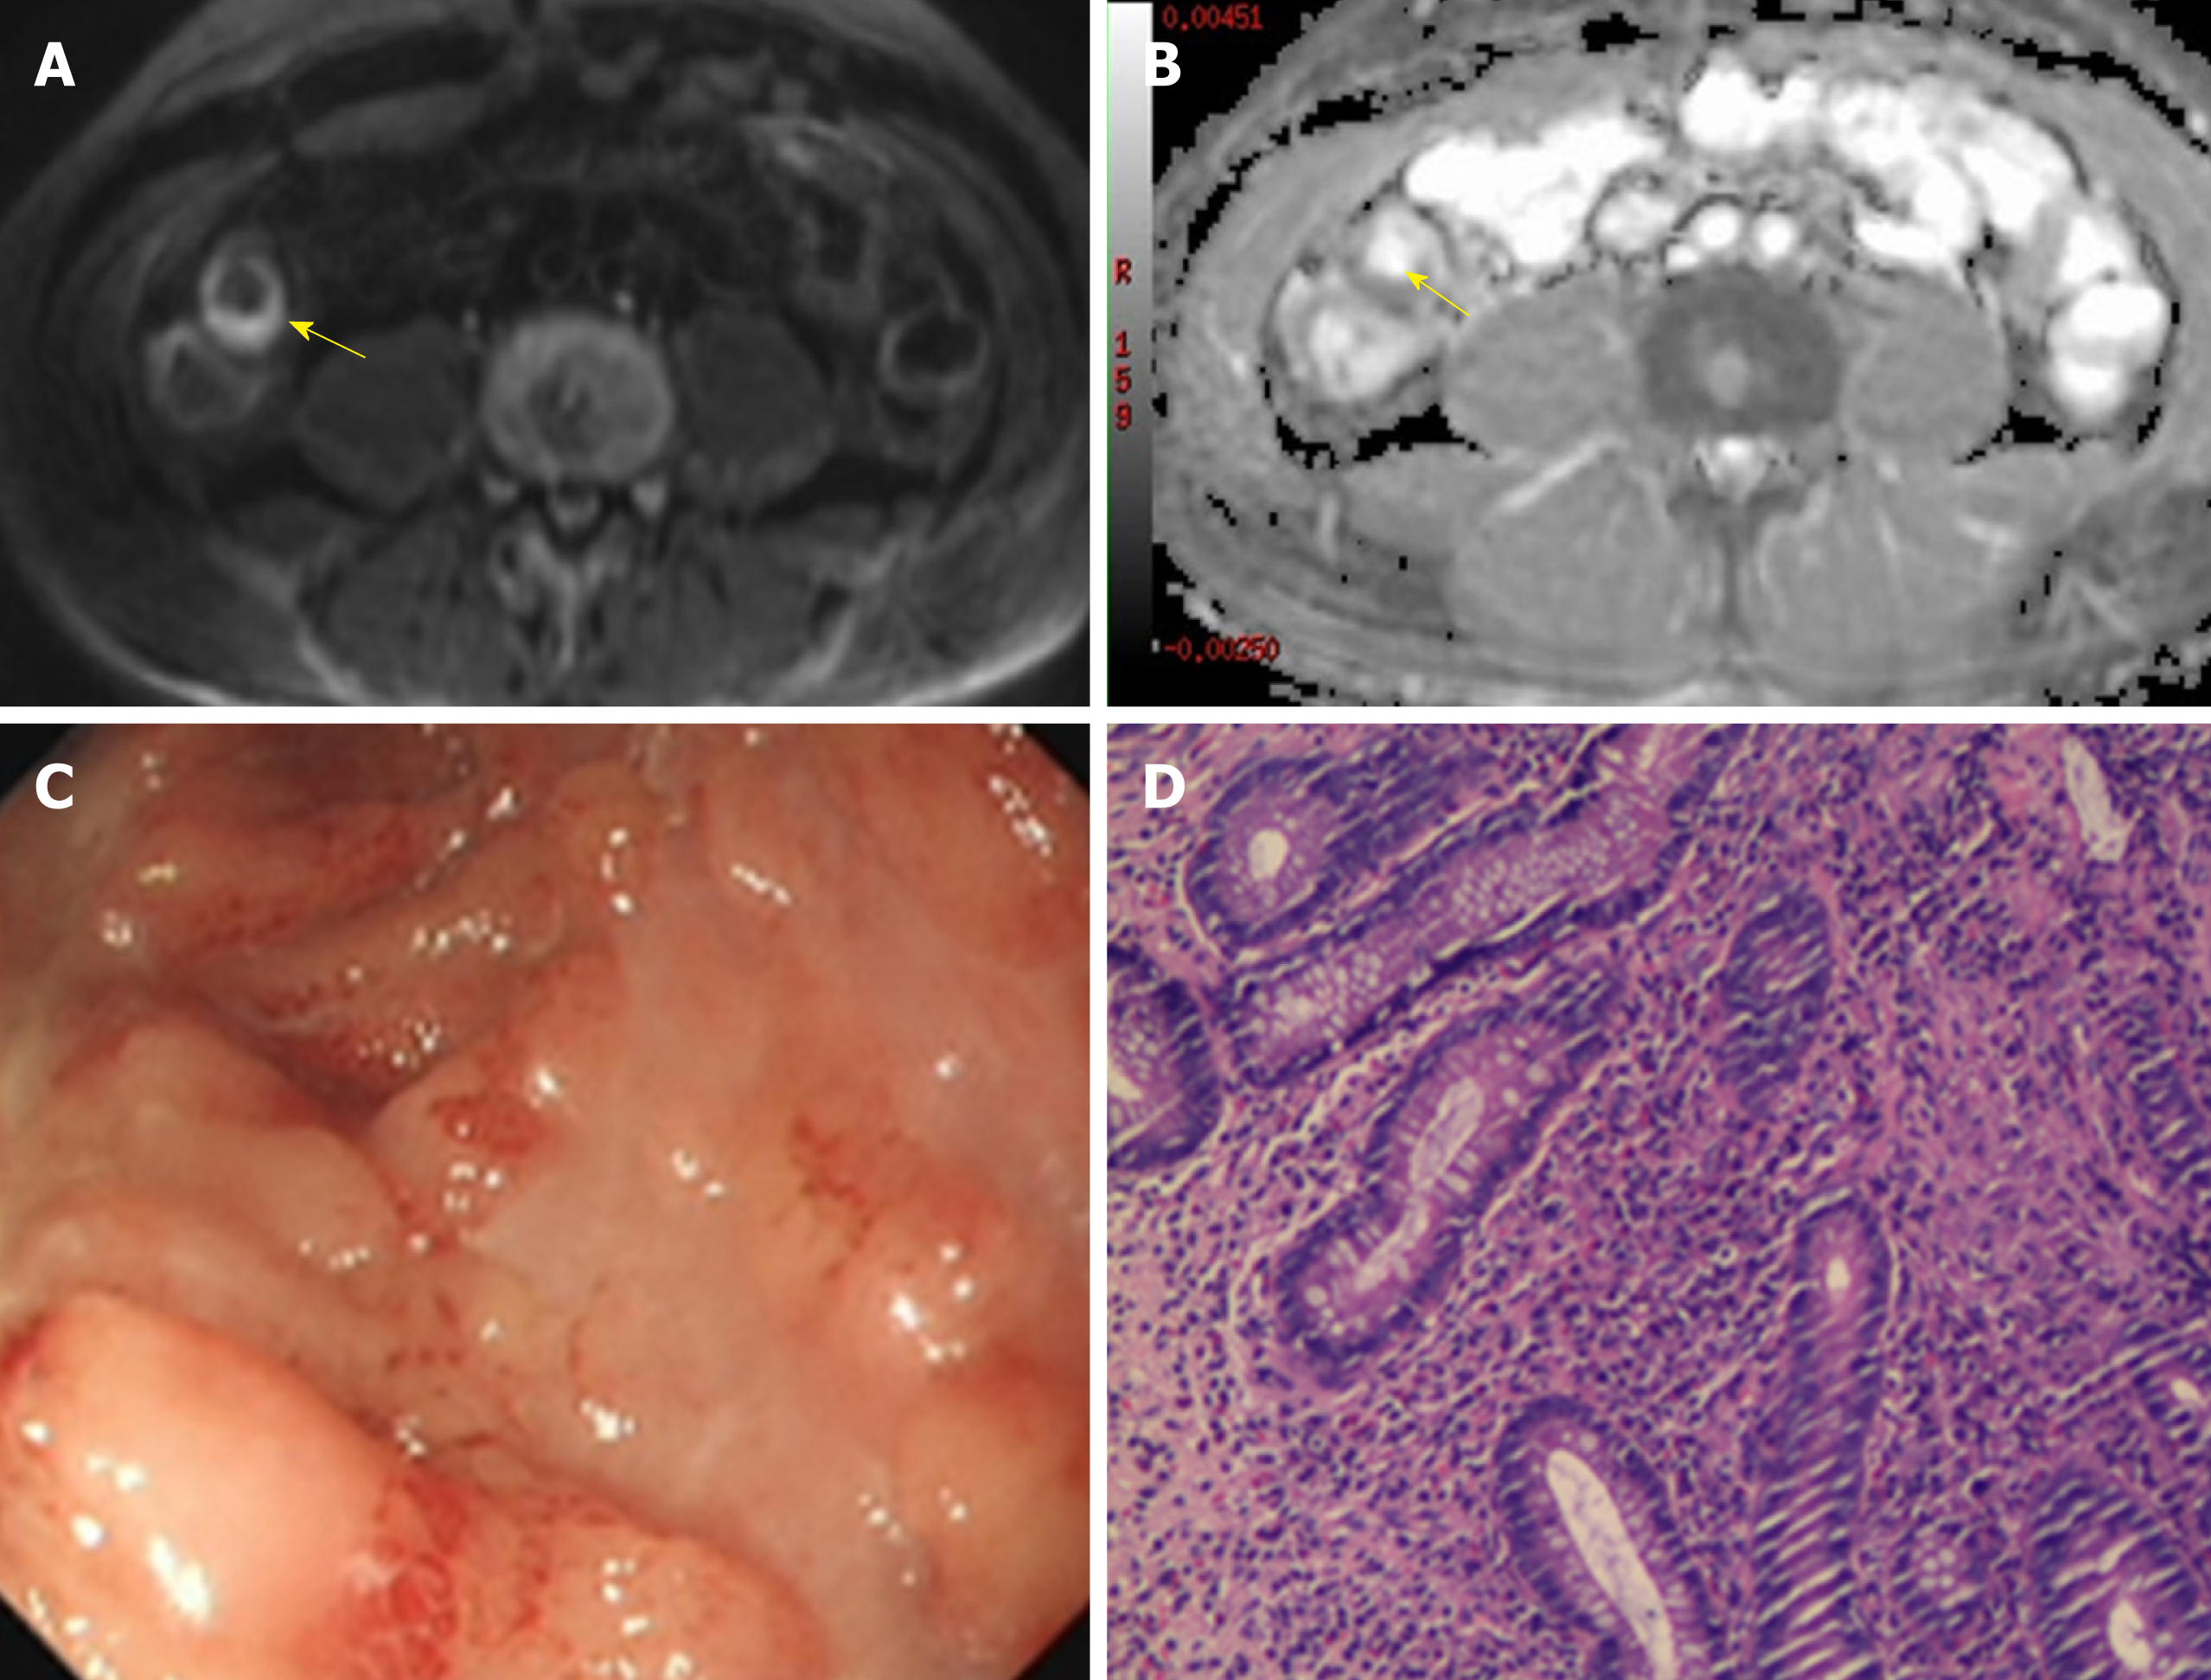
Figure 2 A 48-year-old man with Crohn’s disease involving the terminal ileum.
A: Axial diffusion-weighted imaging with b = 800 s/mm2 demonstrated high signal intensity of the terminal ileum (arrow). B: The terminal ileum was hypointense (arrow) on the corresponding apparent diffusion coefficient map. C: Ileocolonoscopy showed mucosal ulcers. D: Histopathology demonstrated neutrophil infiltration.
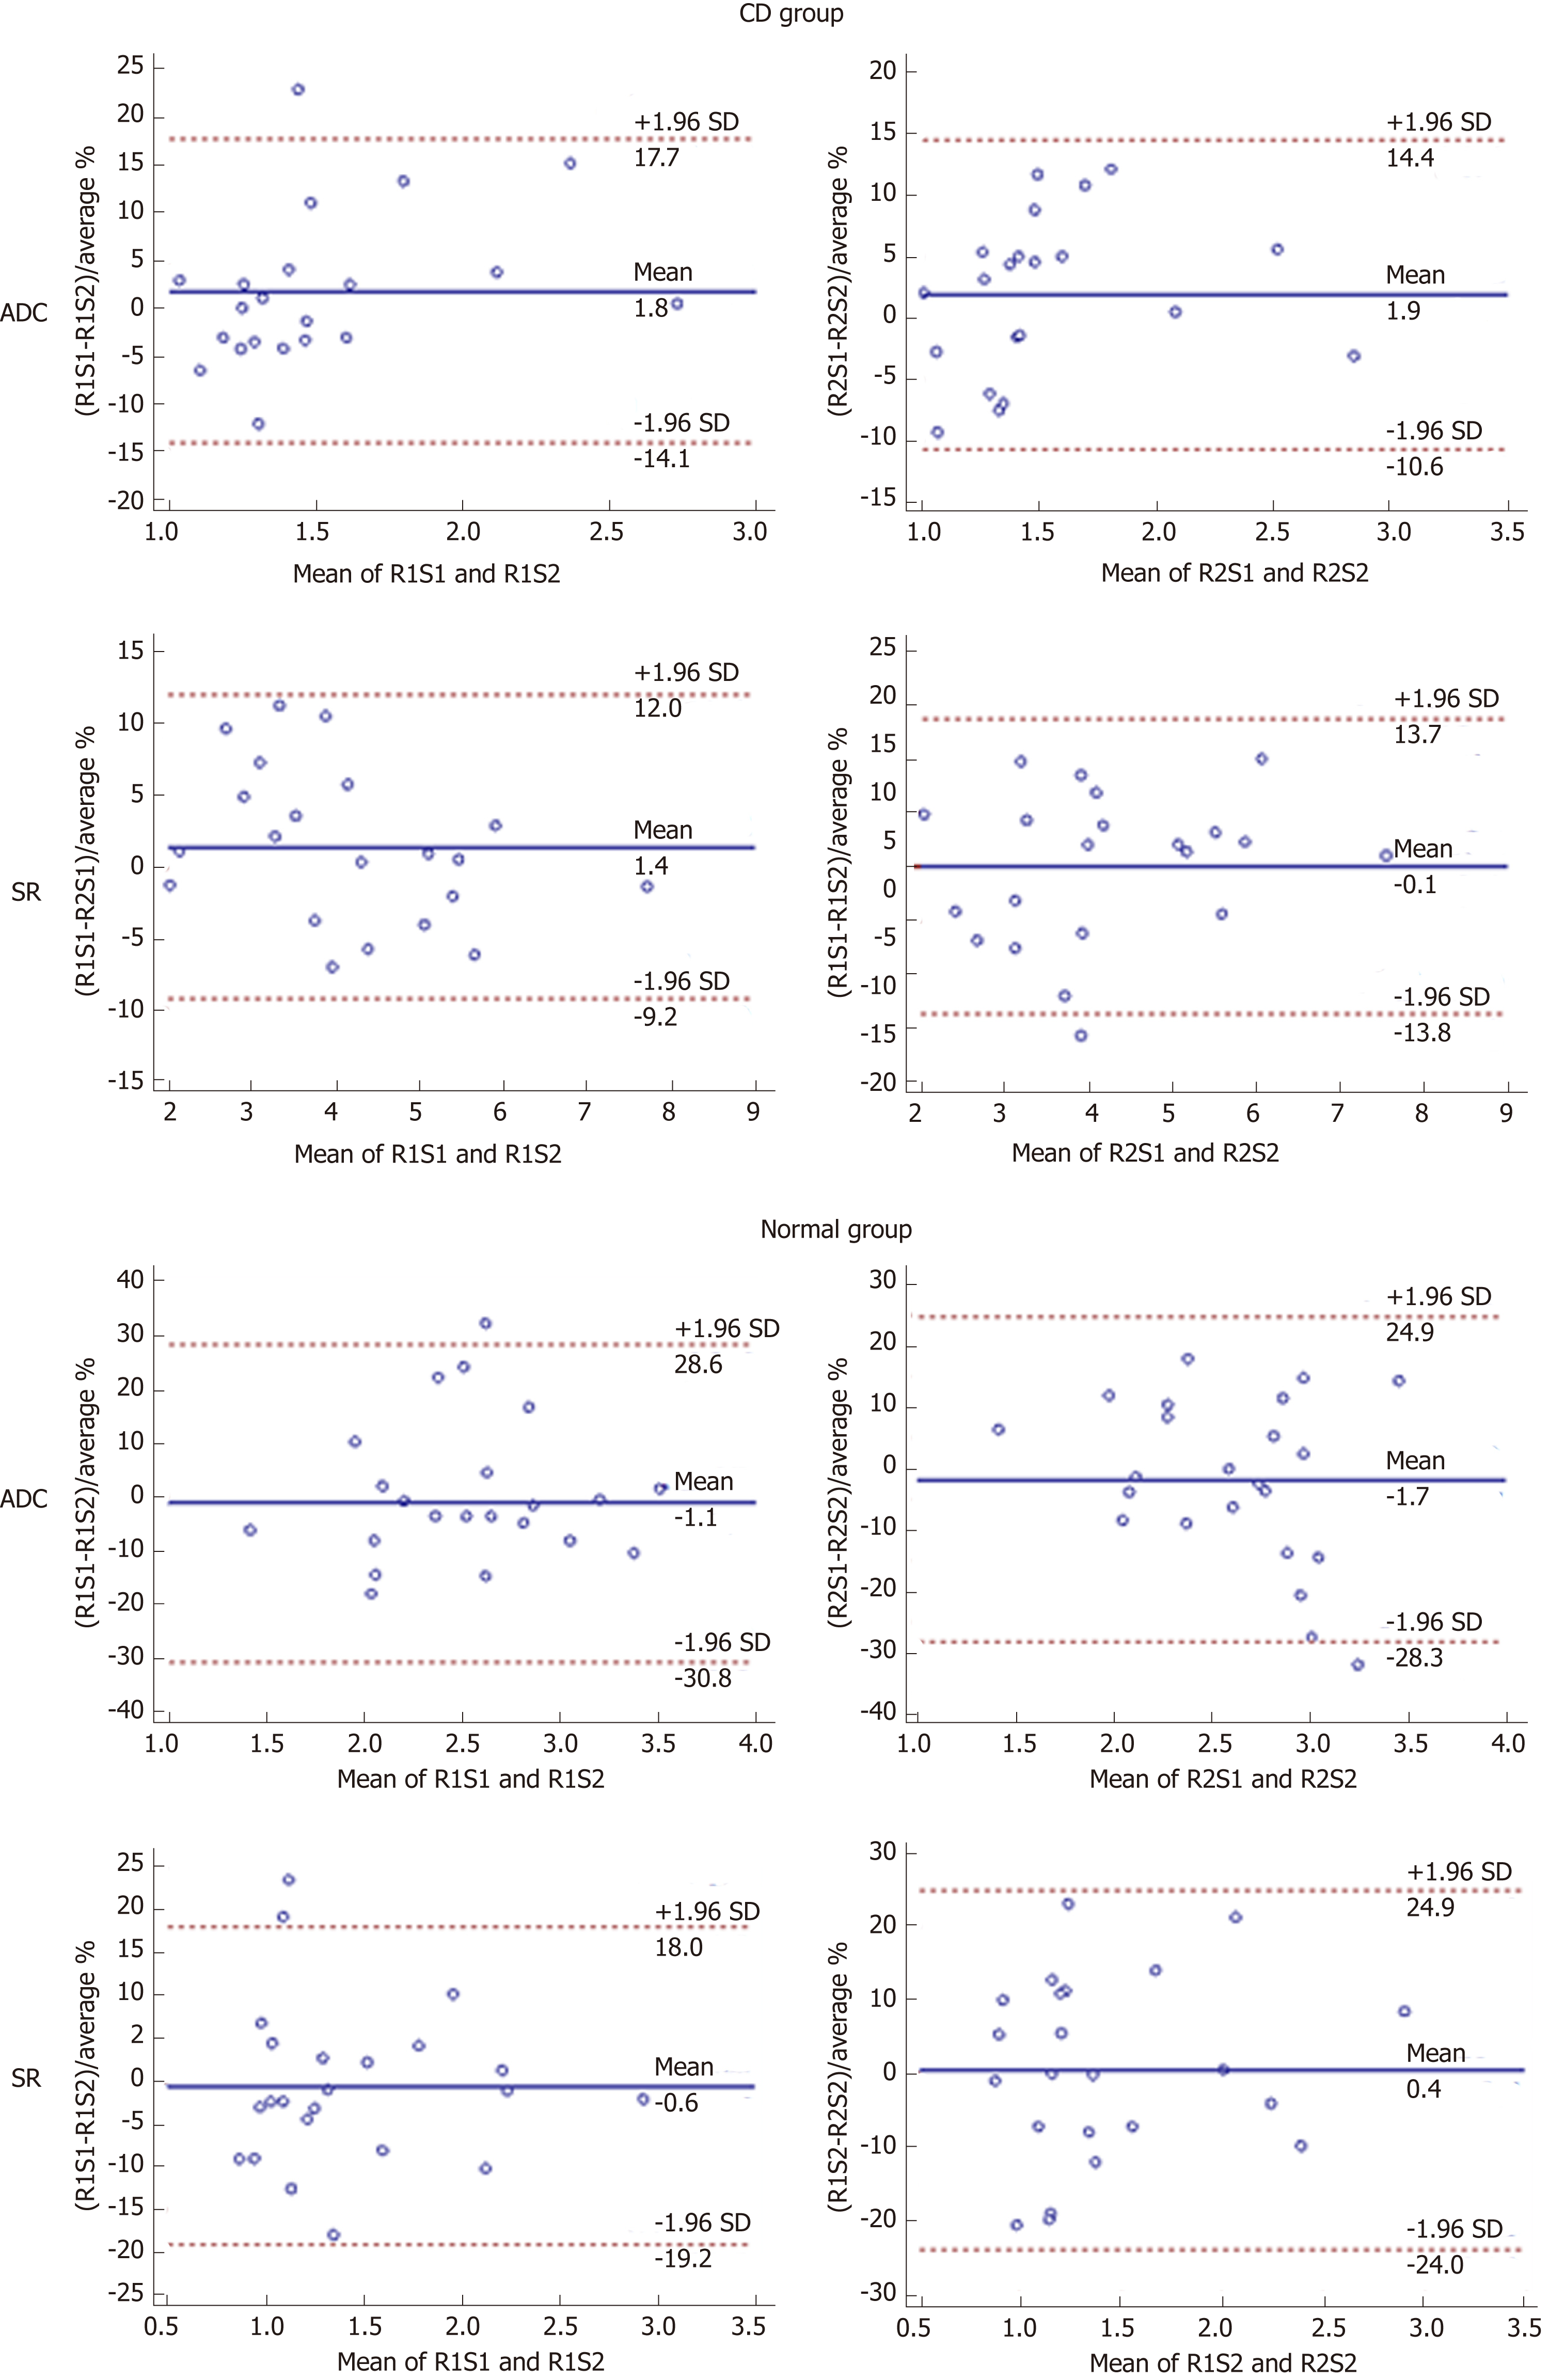
Figure 3 Bland-Altman plots of intraobserver agreement between 2 two sessions of two readers.
Bland-Altman 95% limits of agreement with diffusion weighted imaging parameters including apparent diffusion coefficient and signal ratio from the Crohn’s disease group and normal group. The solid line represents the mean relative difference as a percentage and the dashed lines represent the upper and lower 95% limits of agreement. ADC: Apparent diffusion coefficient; SR: Signal ratio; CD: Crohn’s disease; SD: Standard deviation; R1S1: First session of reader 1; R1S2: Second session of reader 1; R1S2: First session of reader 2; R2S2: Second session of reader 2.
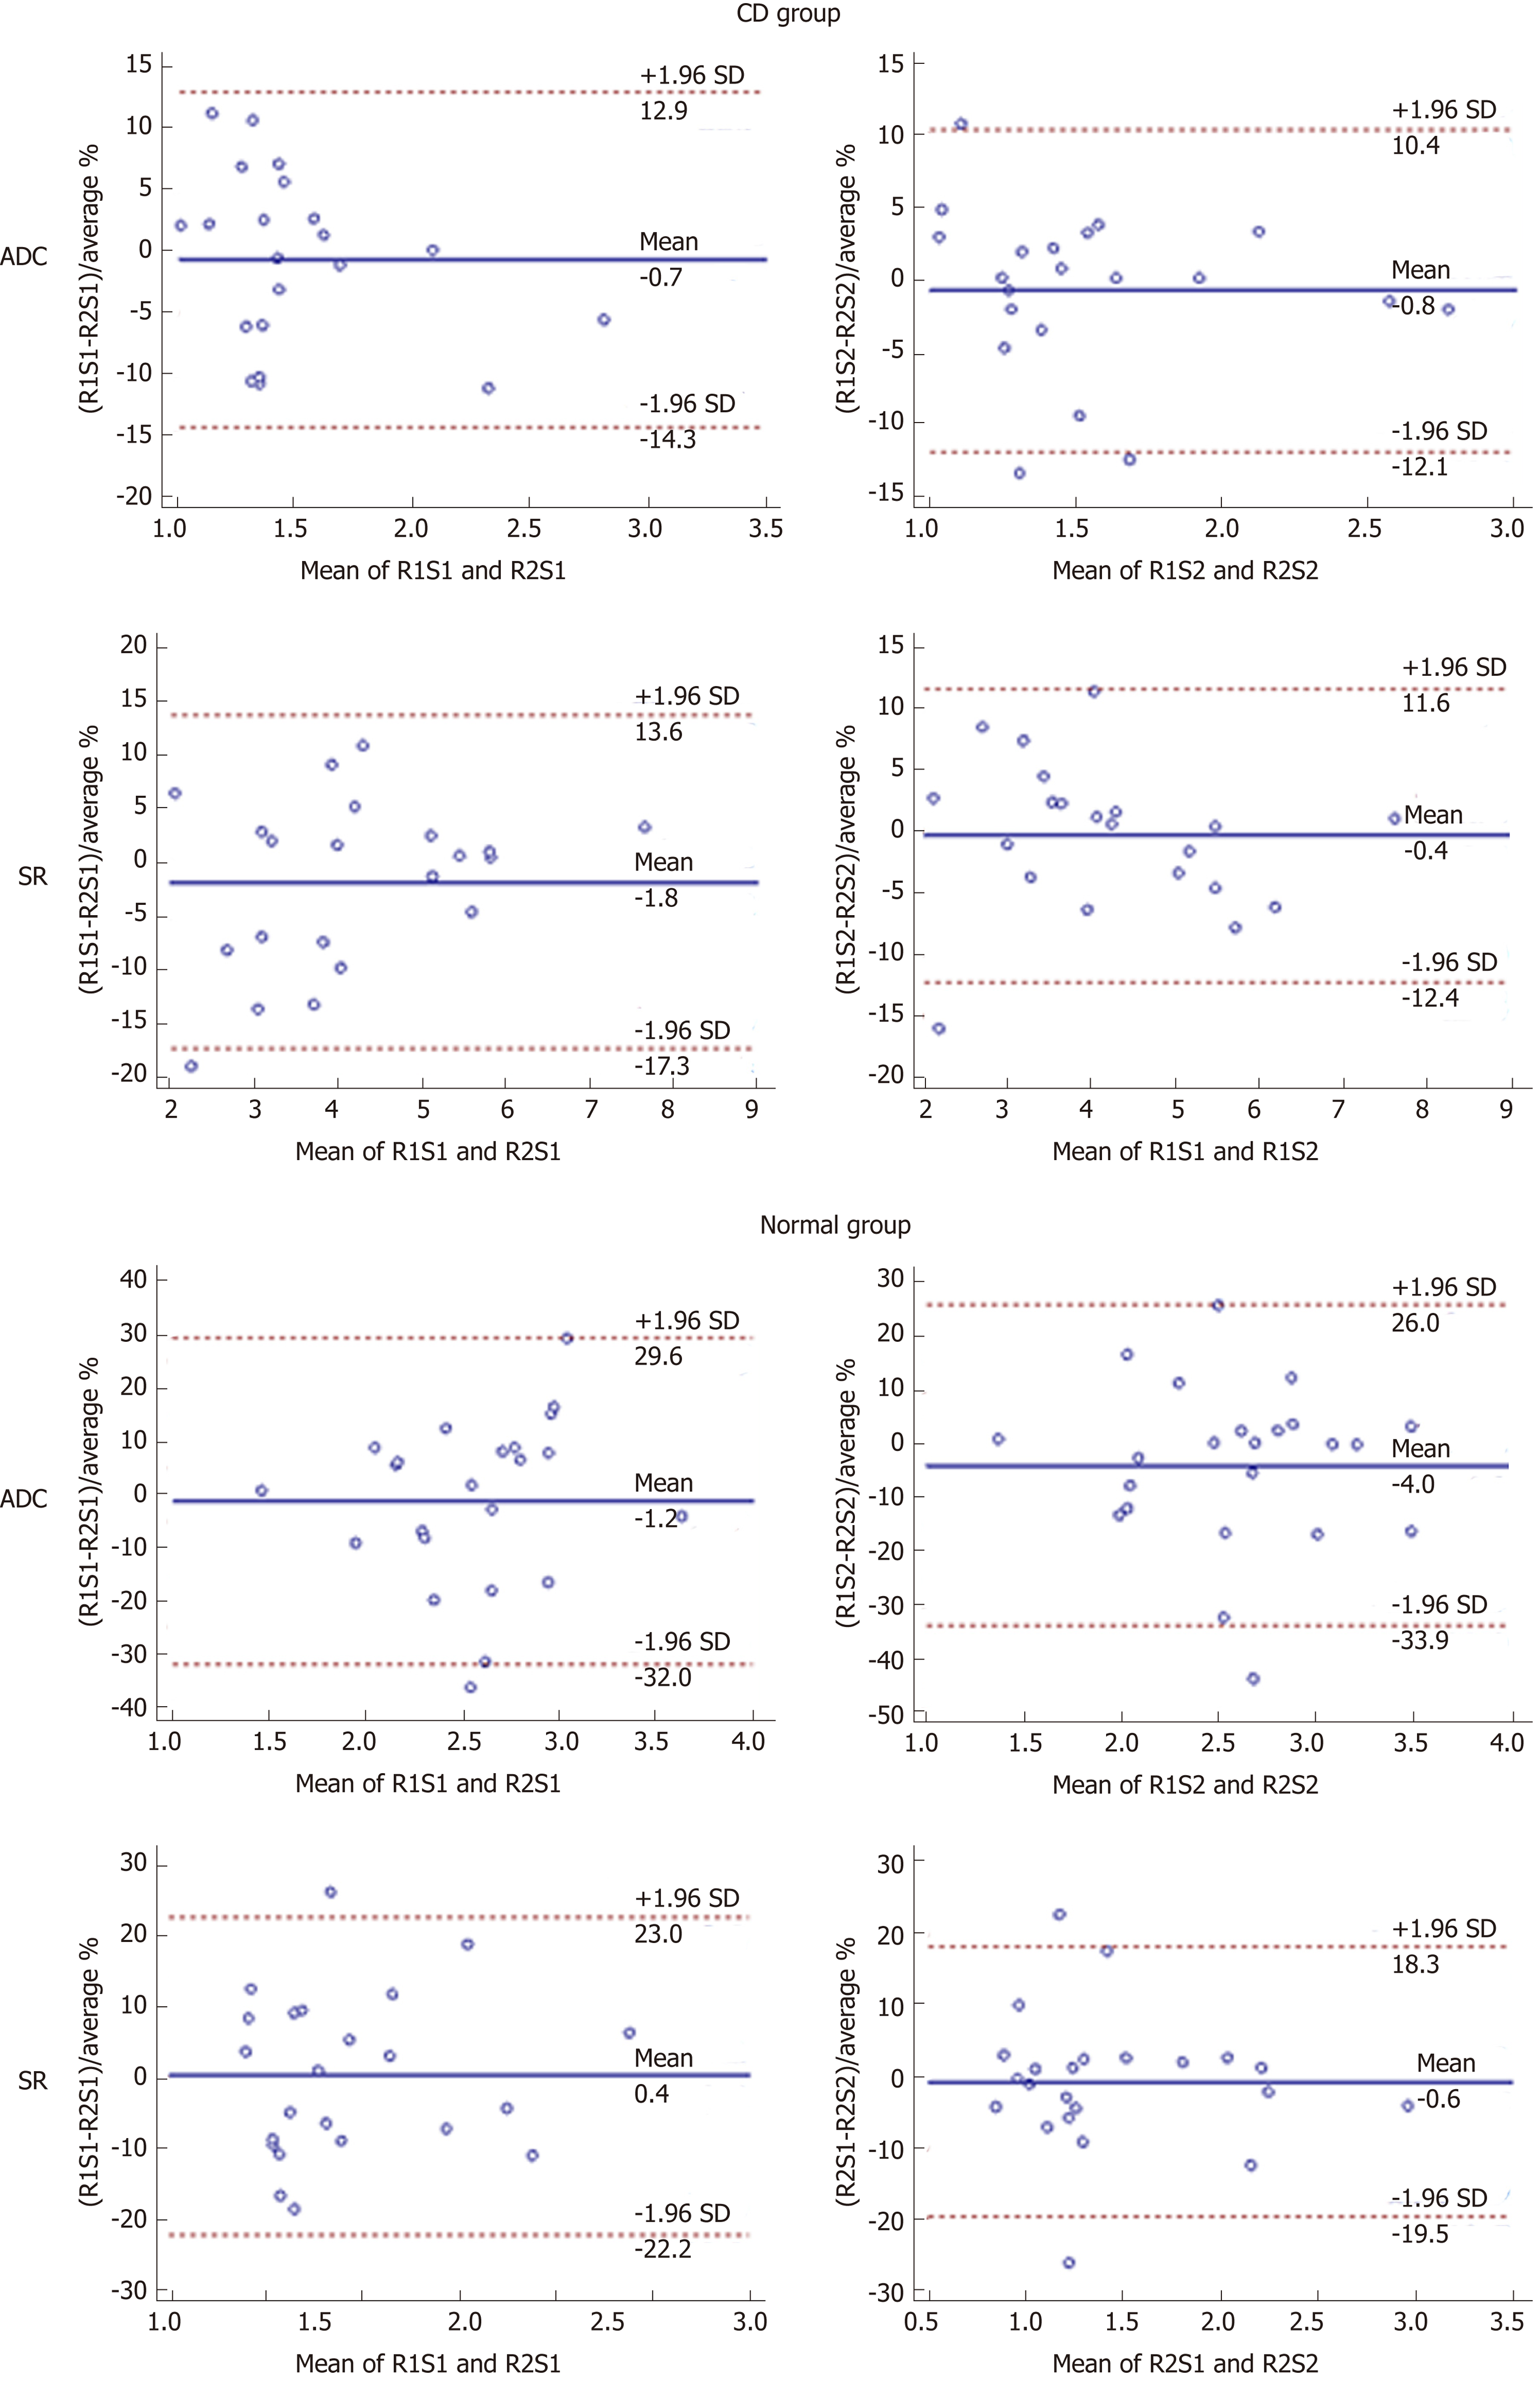
Figure 4 Bland-Altman plots of interobserver agreement between two readers at two sessions.
Bland-Altman 95% limits of agreement with Crohn’s disease parameters including apparent diffusion coefficient and signal ratio from the Crohn’s disease group and normal group. The solid line represents the mean relative difference as a percentage and the dashed lines represent the upper and lower 95% limits of agreement. ADC: Apparent diffusion coefficient; SR: Signal ratio; CD: Crohn’s disease; SD: Standard deviation; R1S1: First session of reader 1; R1S2: Second session of reader 1; R1S2: First session of reader 2; R2S2: Second session of reader 2.
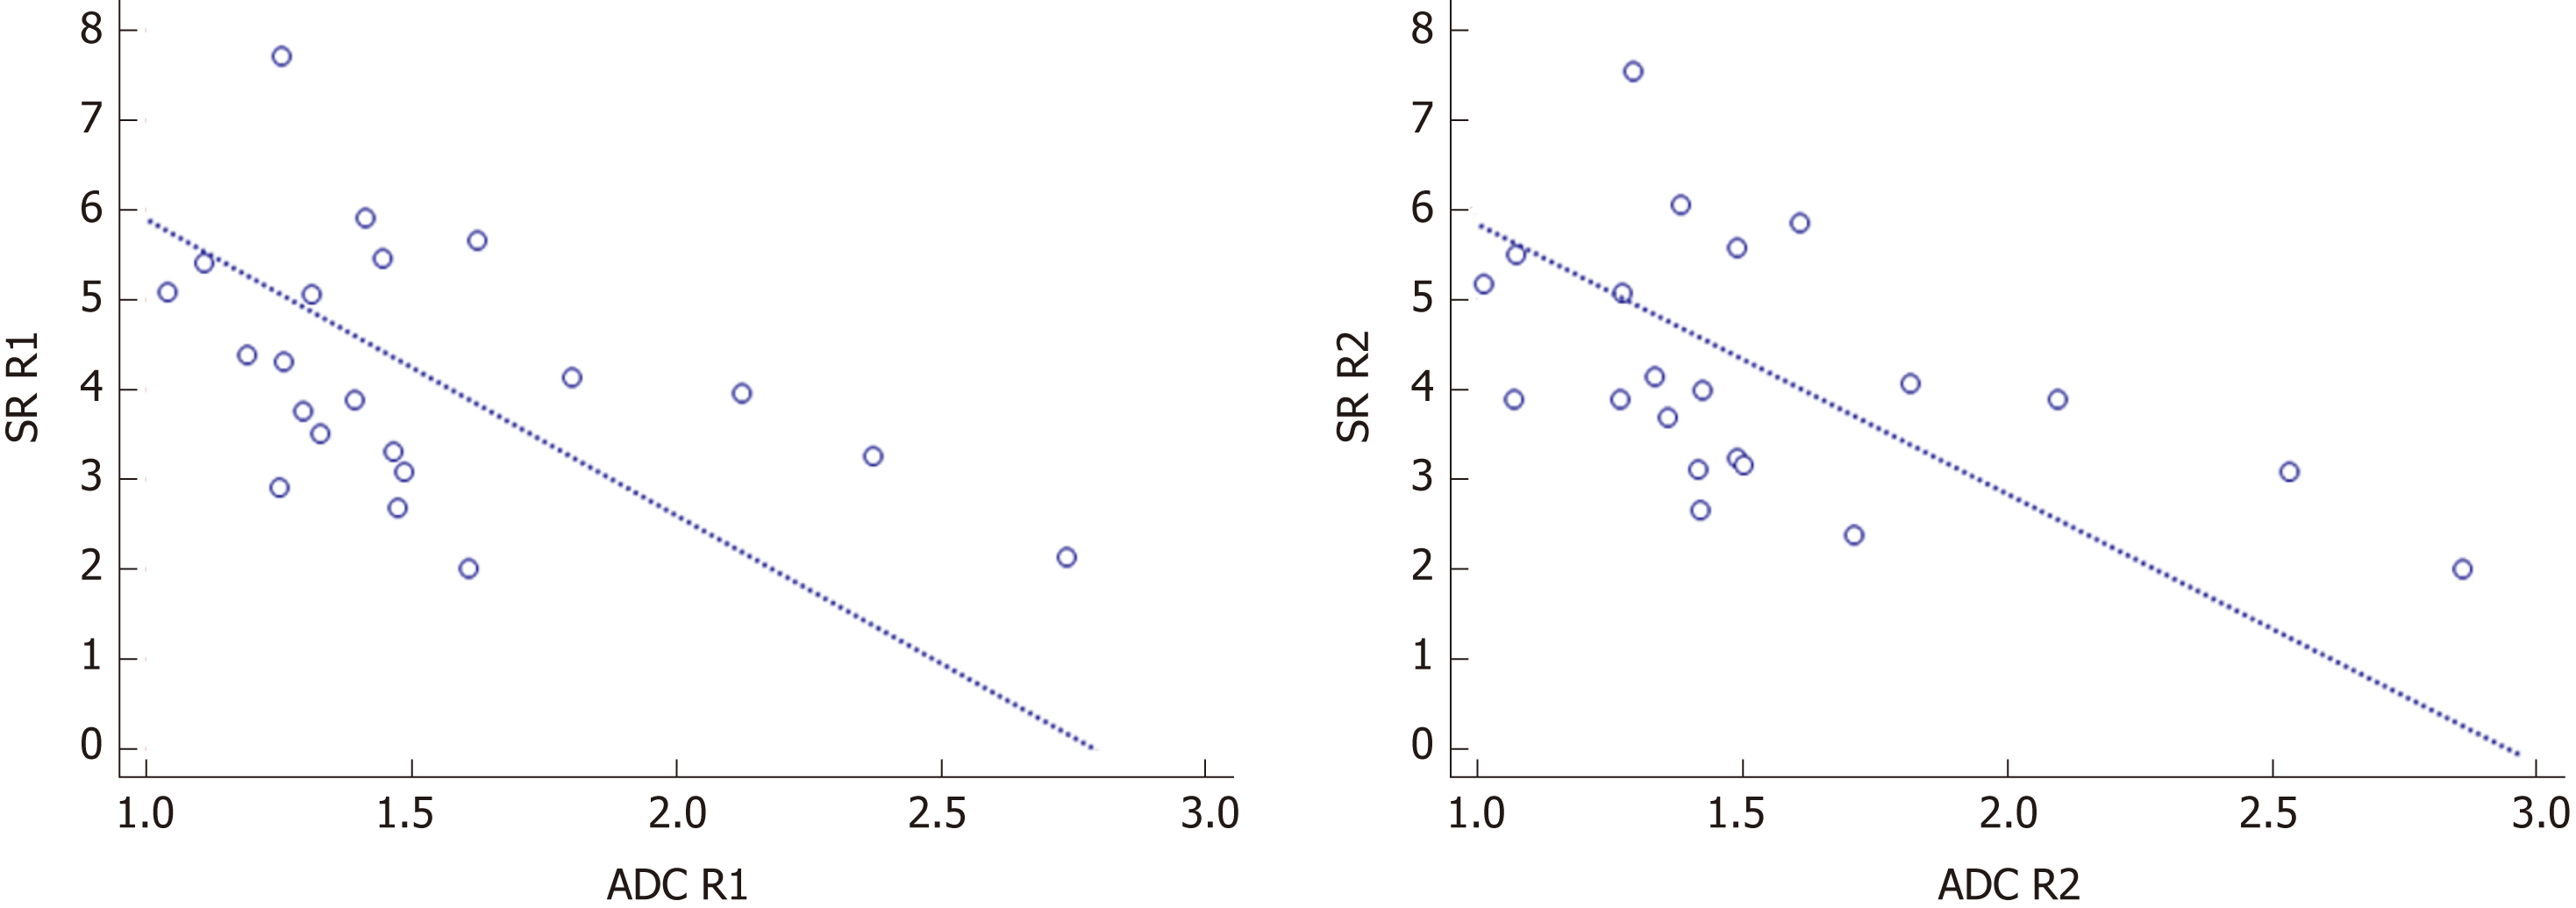
Figure 5 Scatterplots between apparent diffusion coefficient and signal ratio of reader 1 and reader 2.
Reader 1: r = -0.438, P = 0.047; Reader 2: r = -0.485, P = 0.026; R1: reader 1; R2: reader 2. ADC: Apparent diffusion coefficient; SR: Signal ratio; R1: Reader 1; R2: Reader 2.
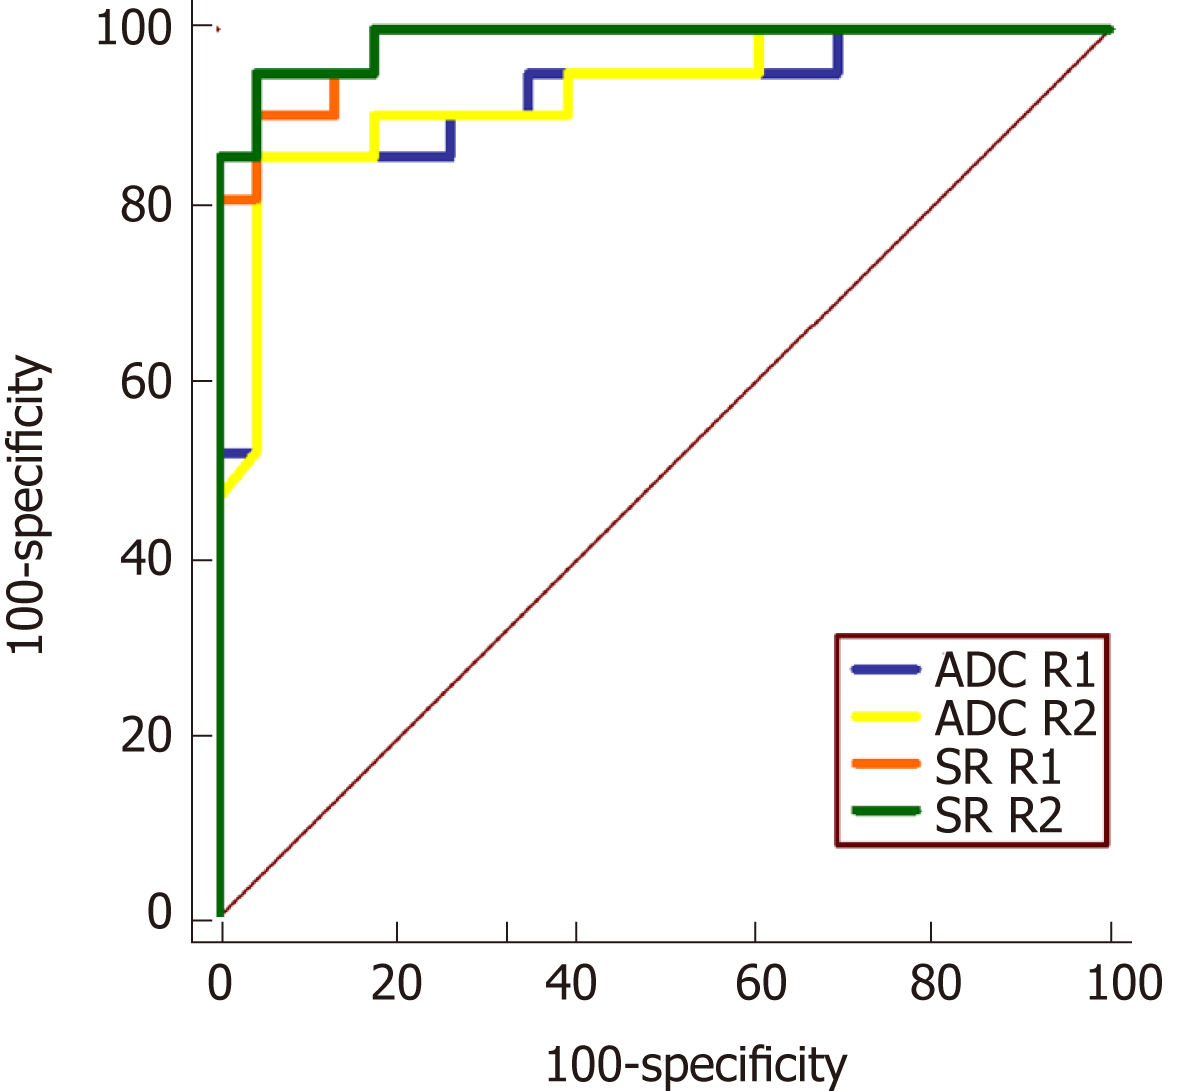
Figure 6 Receiver operating characteristic curve for quantitative apparent diffusion coefficient and signal ratio of the two readers.
ADC: Apparent diffusion coefficient; SR: Signal ratio; R1: Reader 1; R2: Reader 2.
- Citation: Yu H, Shen YQ, Tan FQ, Zhou ZL, Li Z, Hu DY, Morelli JN. Quantitative diffusion-weighted magnetic resonance enterography in ileal Crohn's disease: A systematic analysis of intra and interobserver reproducibility. World J Gastroenterol 2019; 25(27): 3619-3633
- URL: https://www.wjgnet.com/1007-9327/full/v25/i27/3619.htm
- DOI: https://dx.doi.org/10.3748/wjg.v25.i27.3619


