Copyright
©The Author(s) 2019.
World J Gastroenterol. Jul 14, 2019; 25(26): 3450-3467
Published online Jul 14, 2019. doi: 10.3748/wjg.v25.i26.3450
Published online Jul 14, 2019. doi: 10.3748/wjg.v25.i26.3450
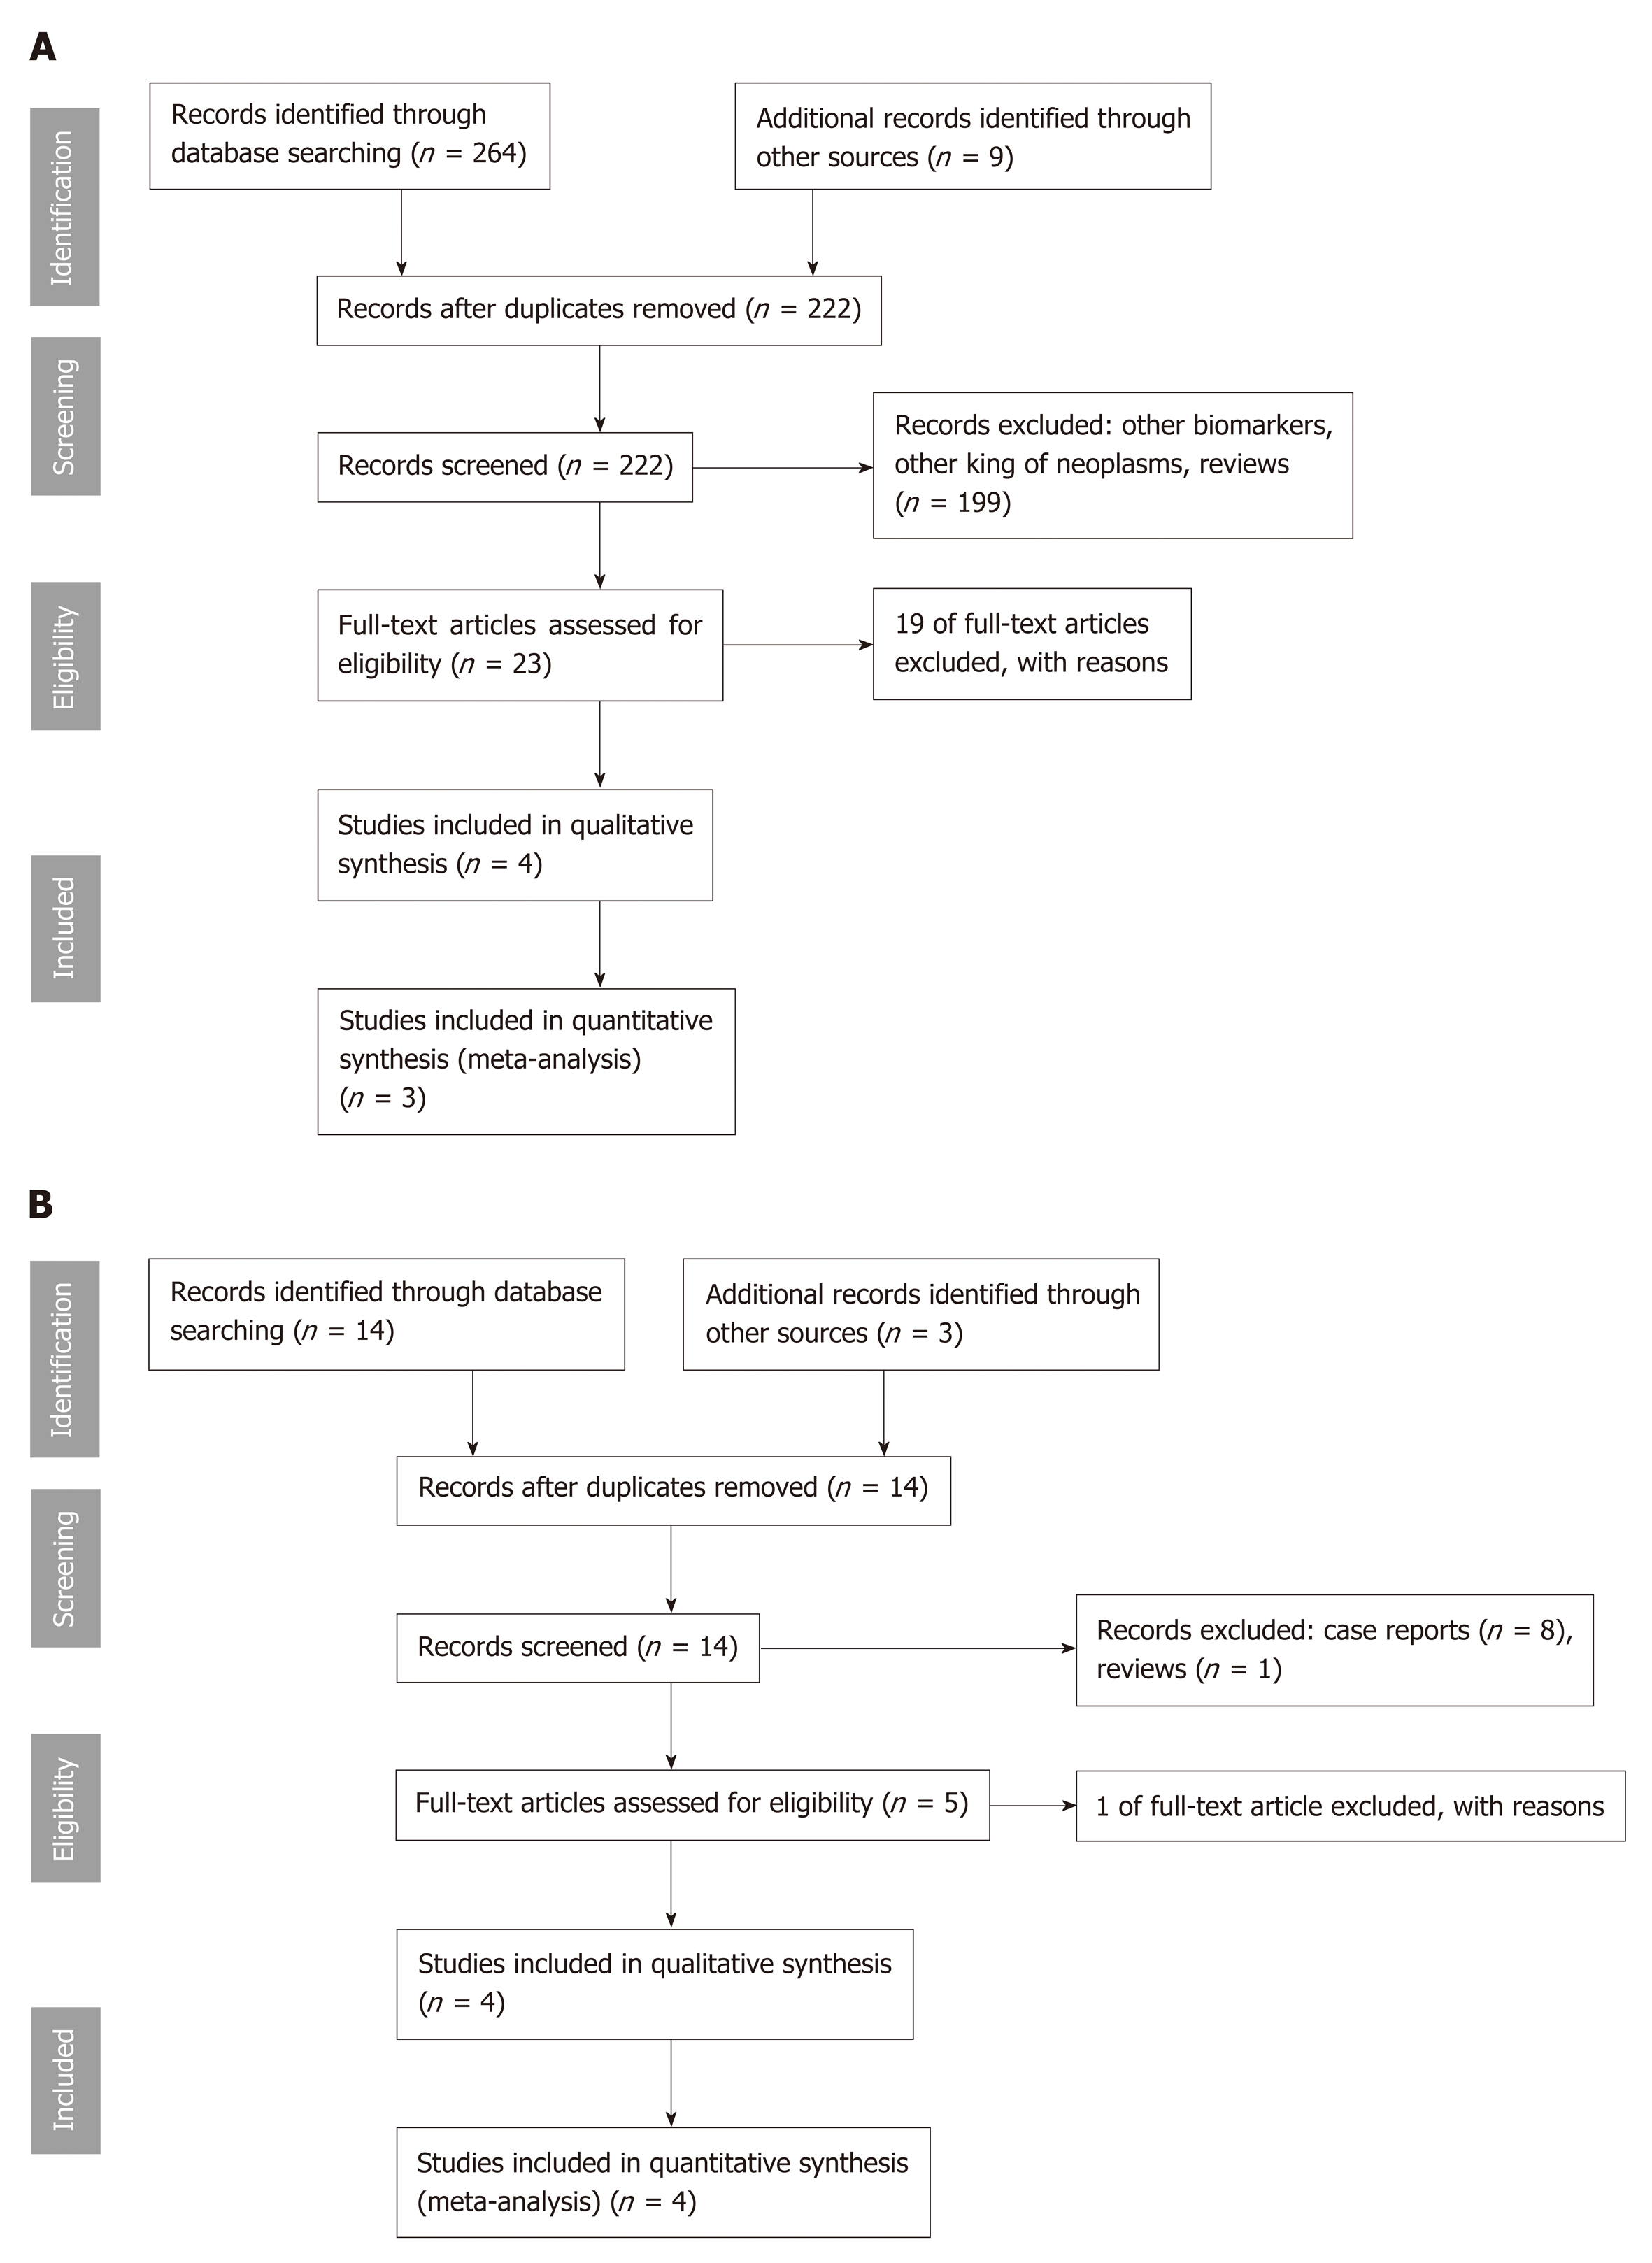
Figure 1 Flowchart with identification of eligible studies.
A: Molecular analysis; B: Microforceps biopsy.
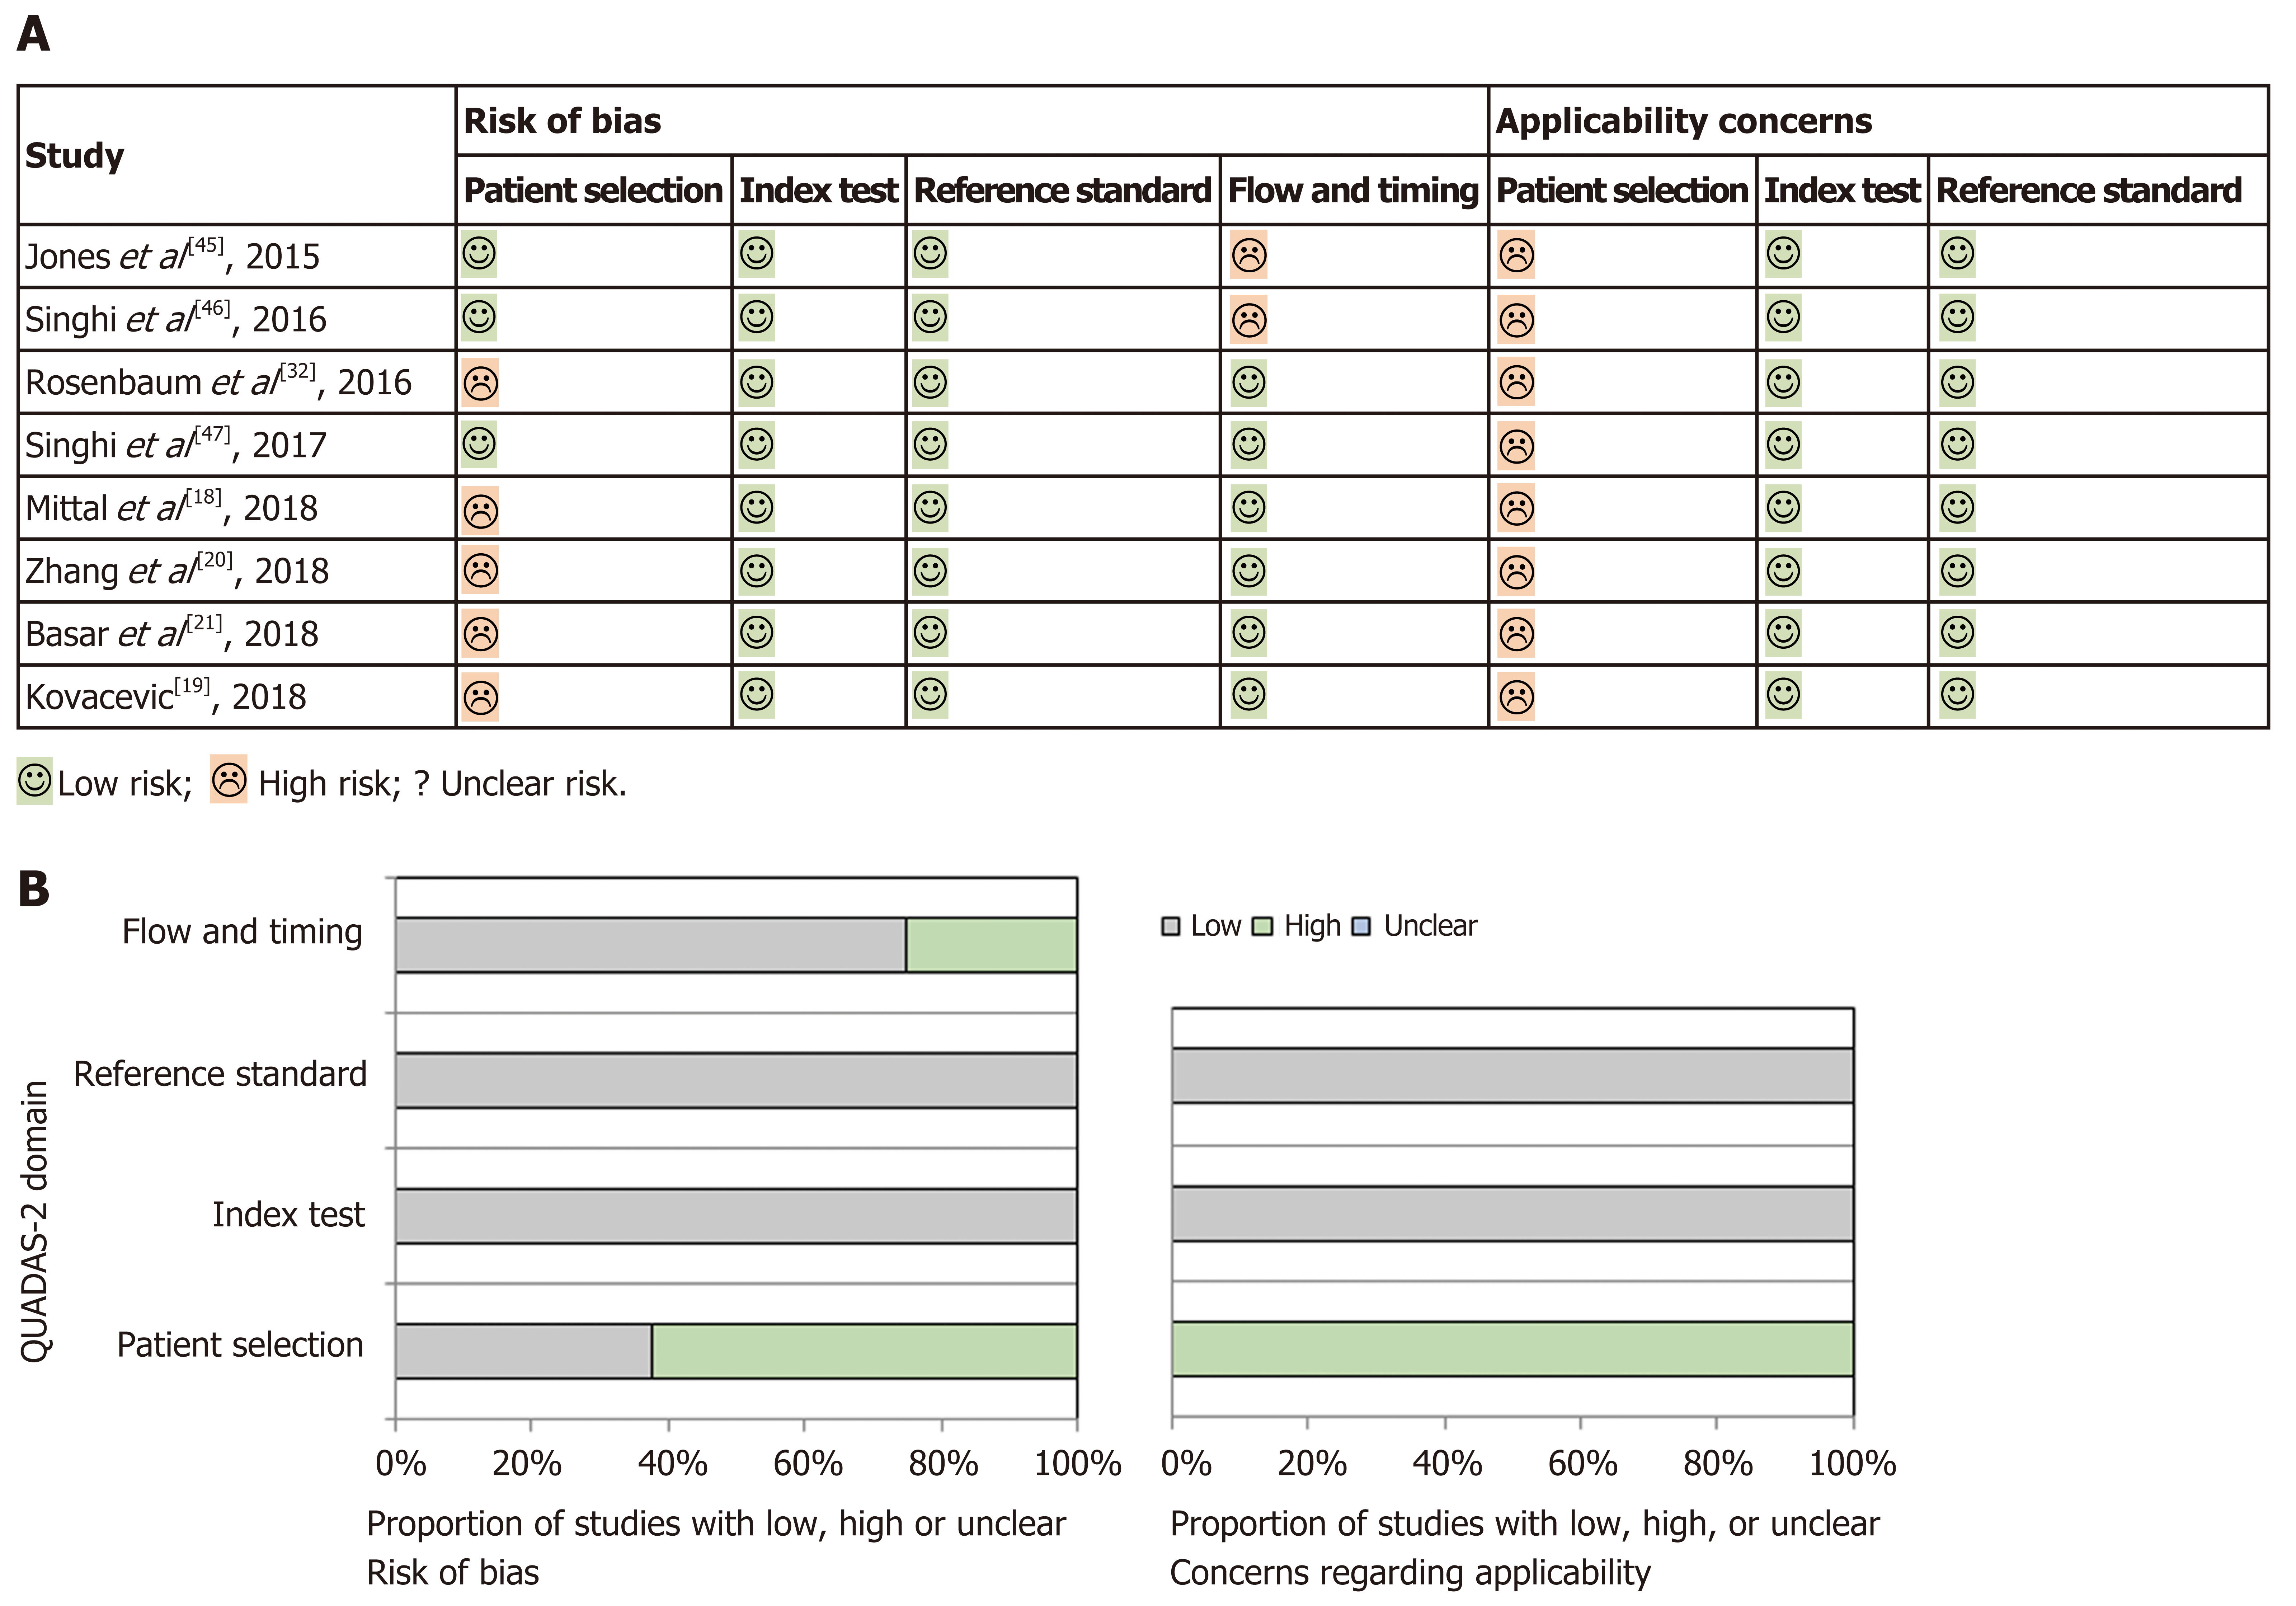
Figure 2 Quality assessment of the studies using QUADAS-2.
A: Tabular presentation of risk bias for each study; B: Graphical display of bias.
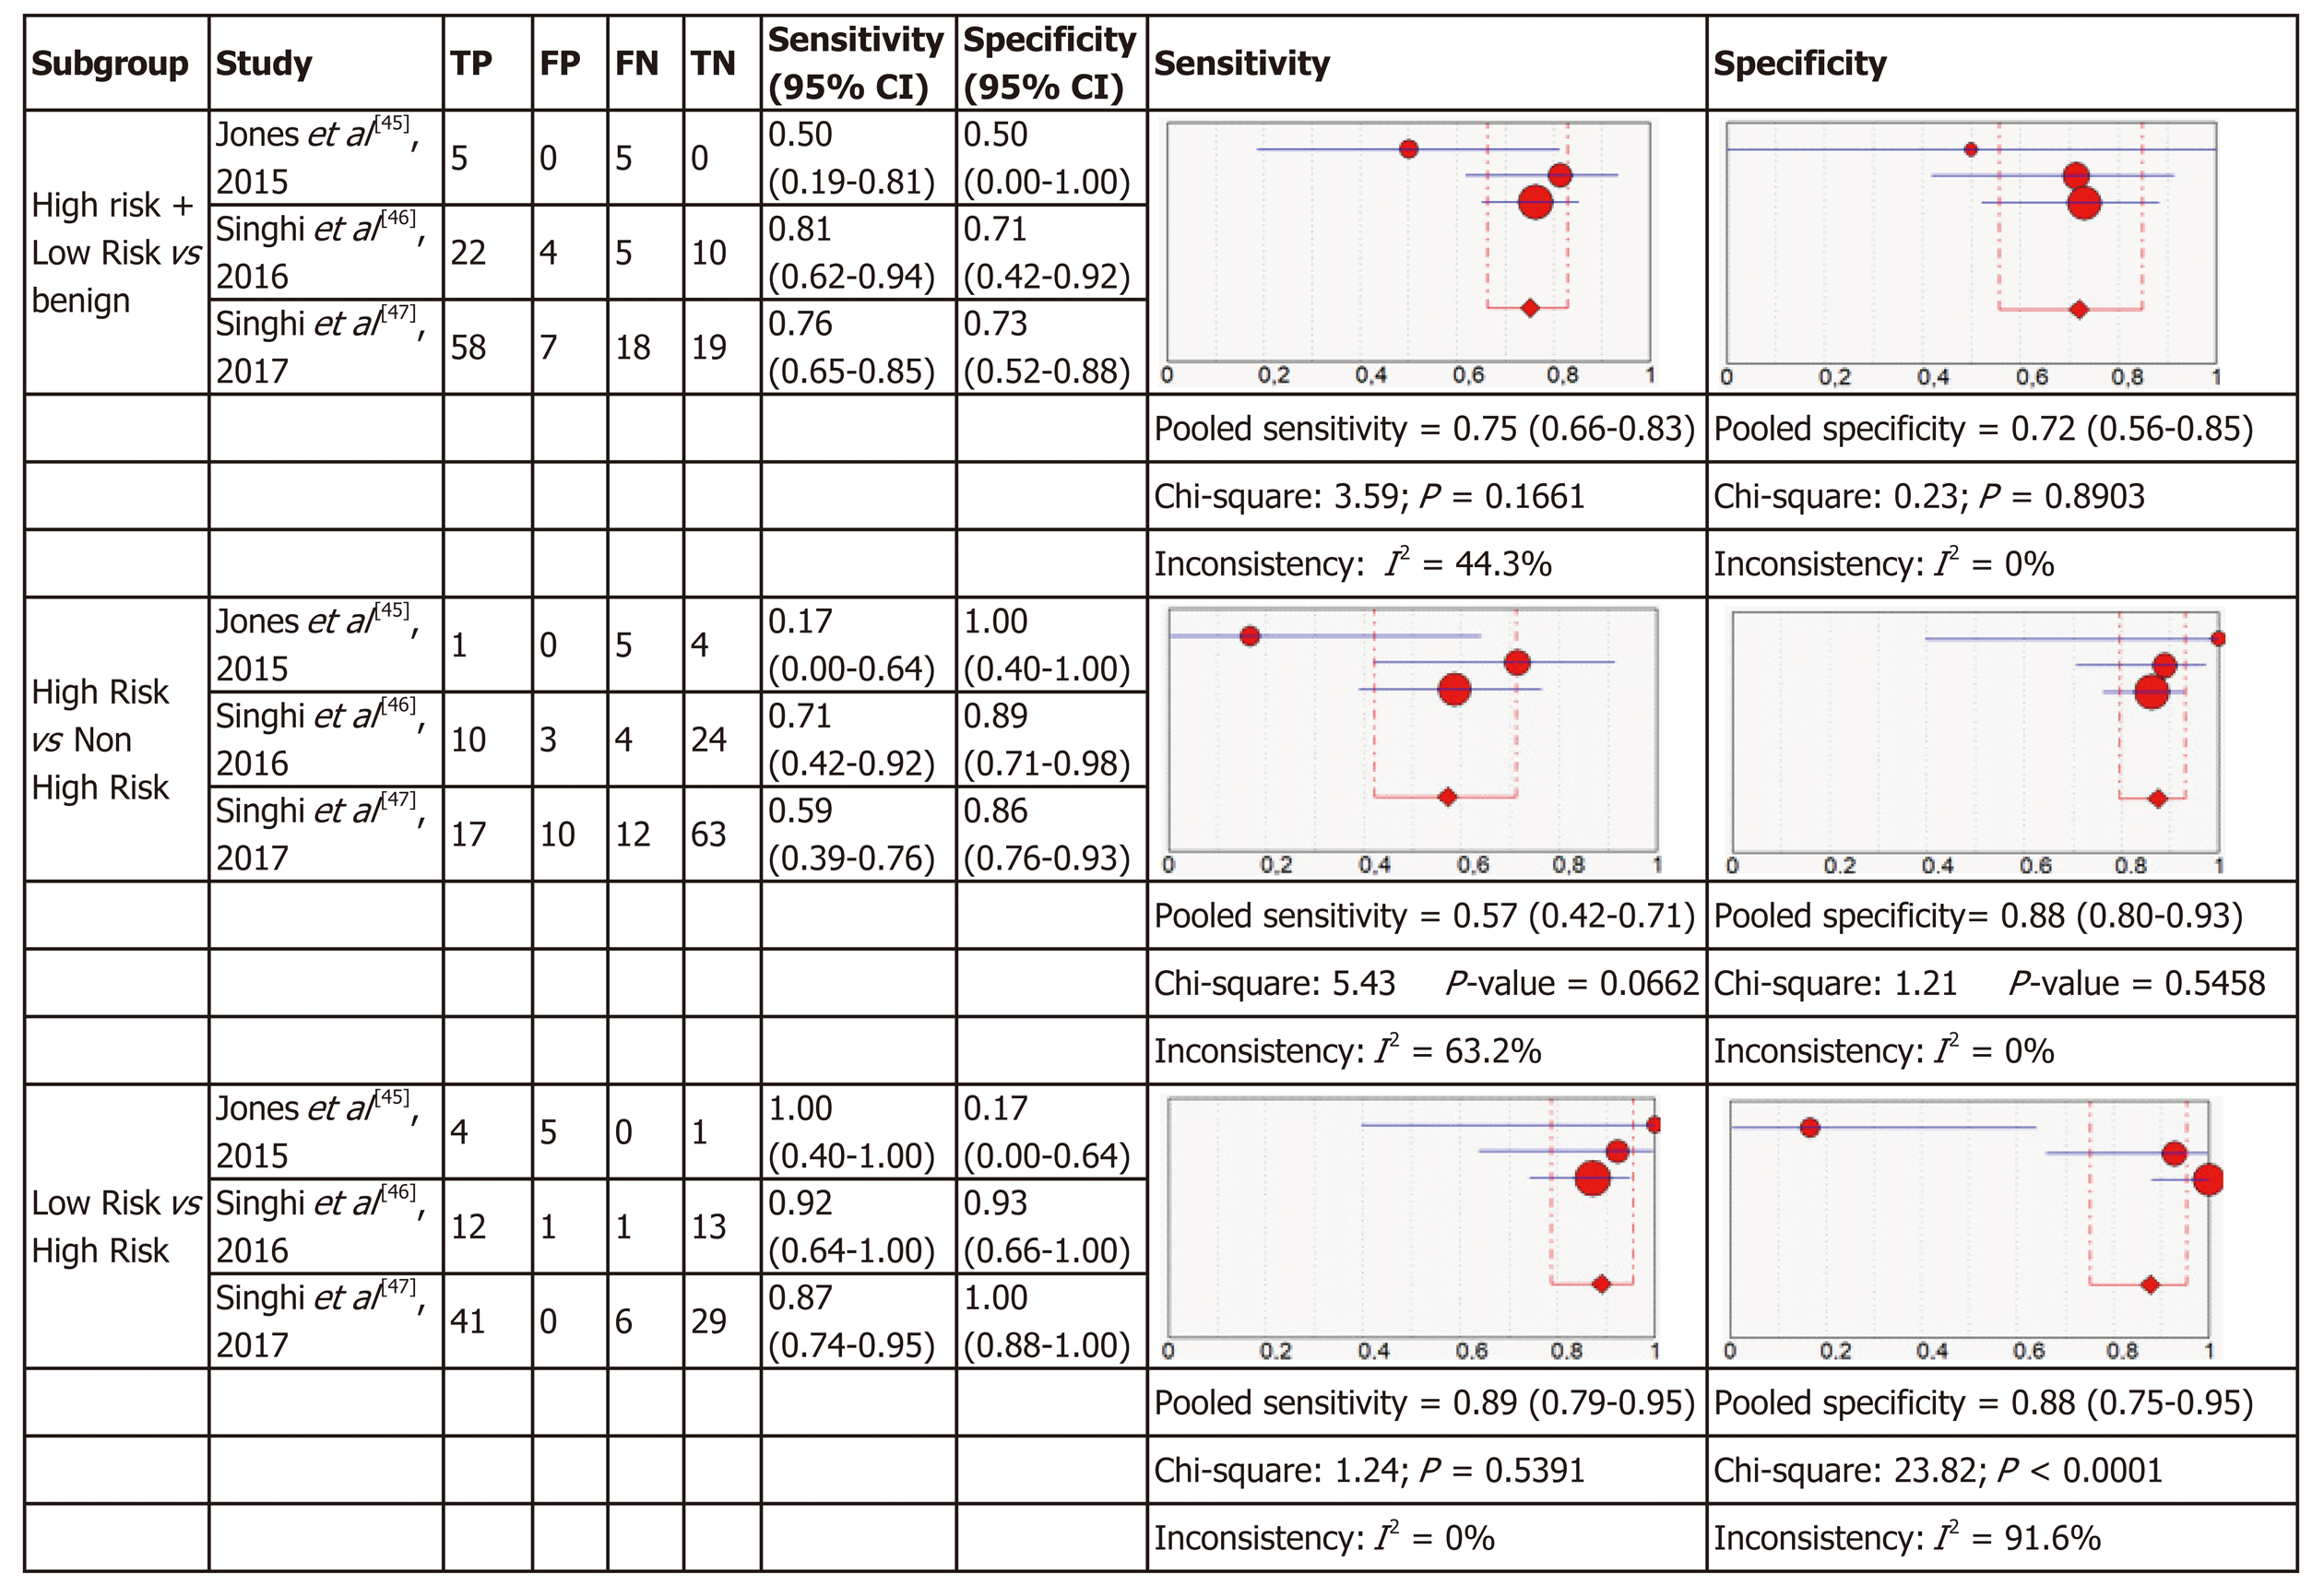
Figure 3 Forest plots of the studies included for molecular analysis.
In parentheses are the 95% confidence intervals (CI) of the sensitivity and specificity. The figure shows the estimated sensitivity and specificity of the study (red circle) and its 95% CI (blue horizontal line). The area of the circle reflects the weight that the study contributes to the meta-analysis.
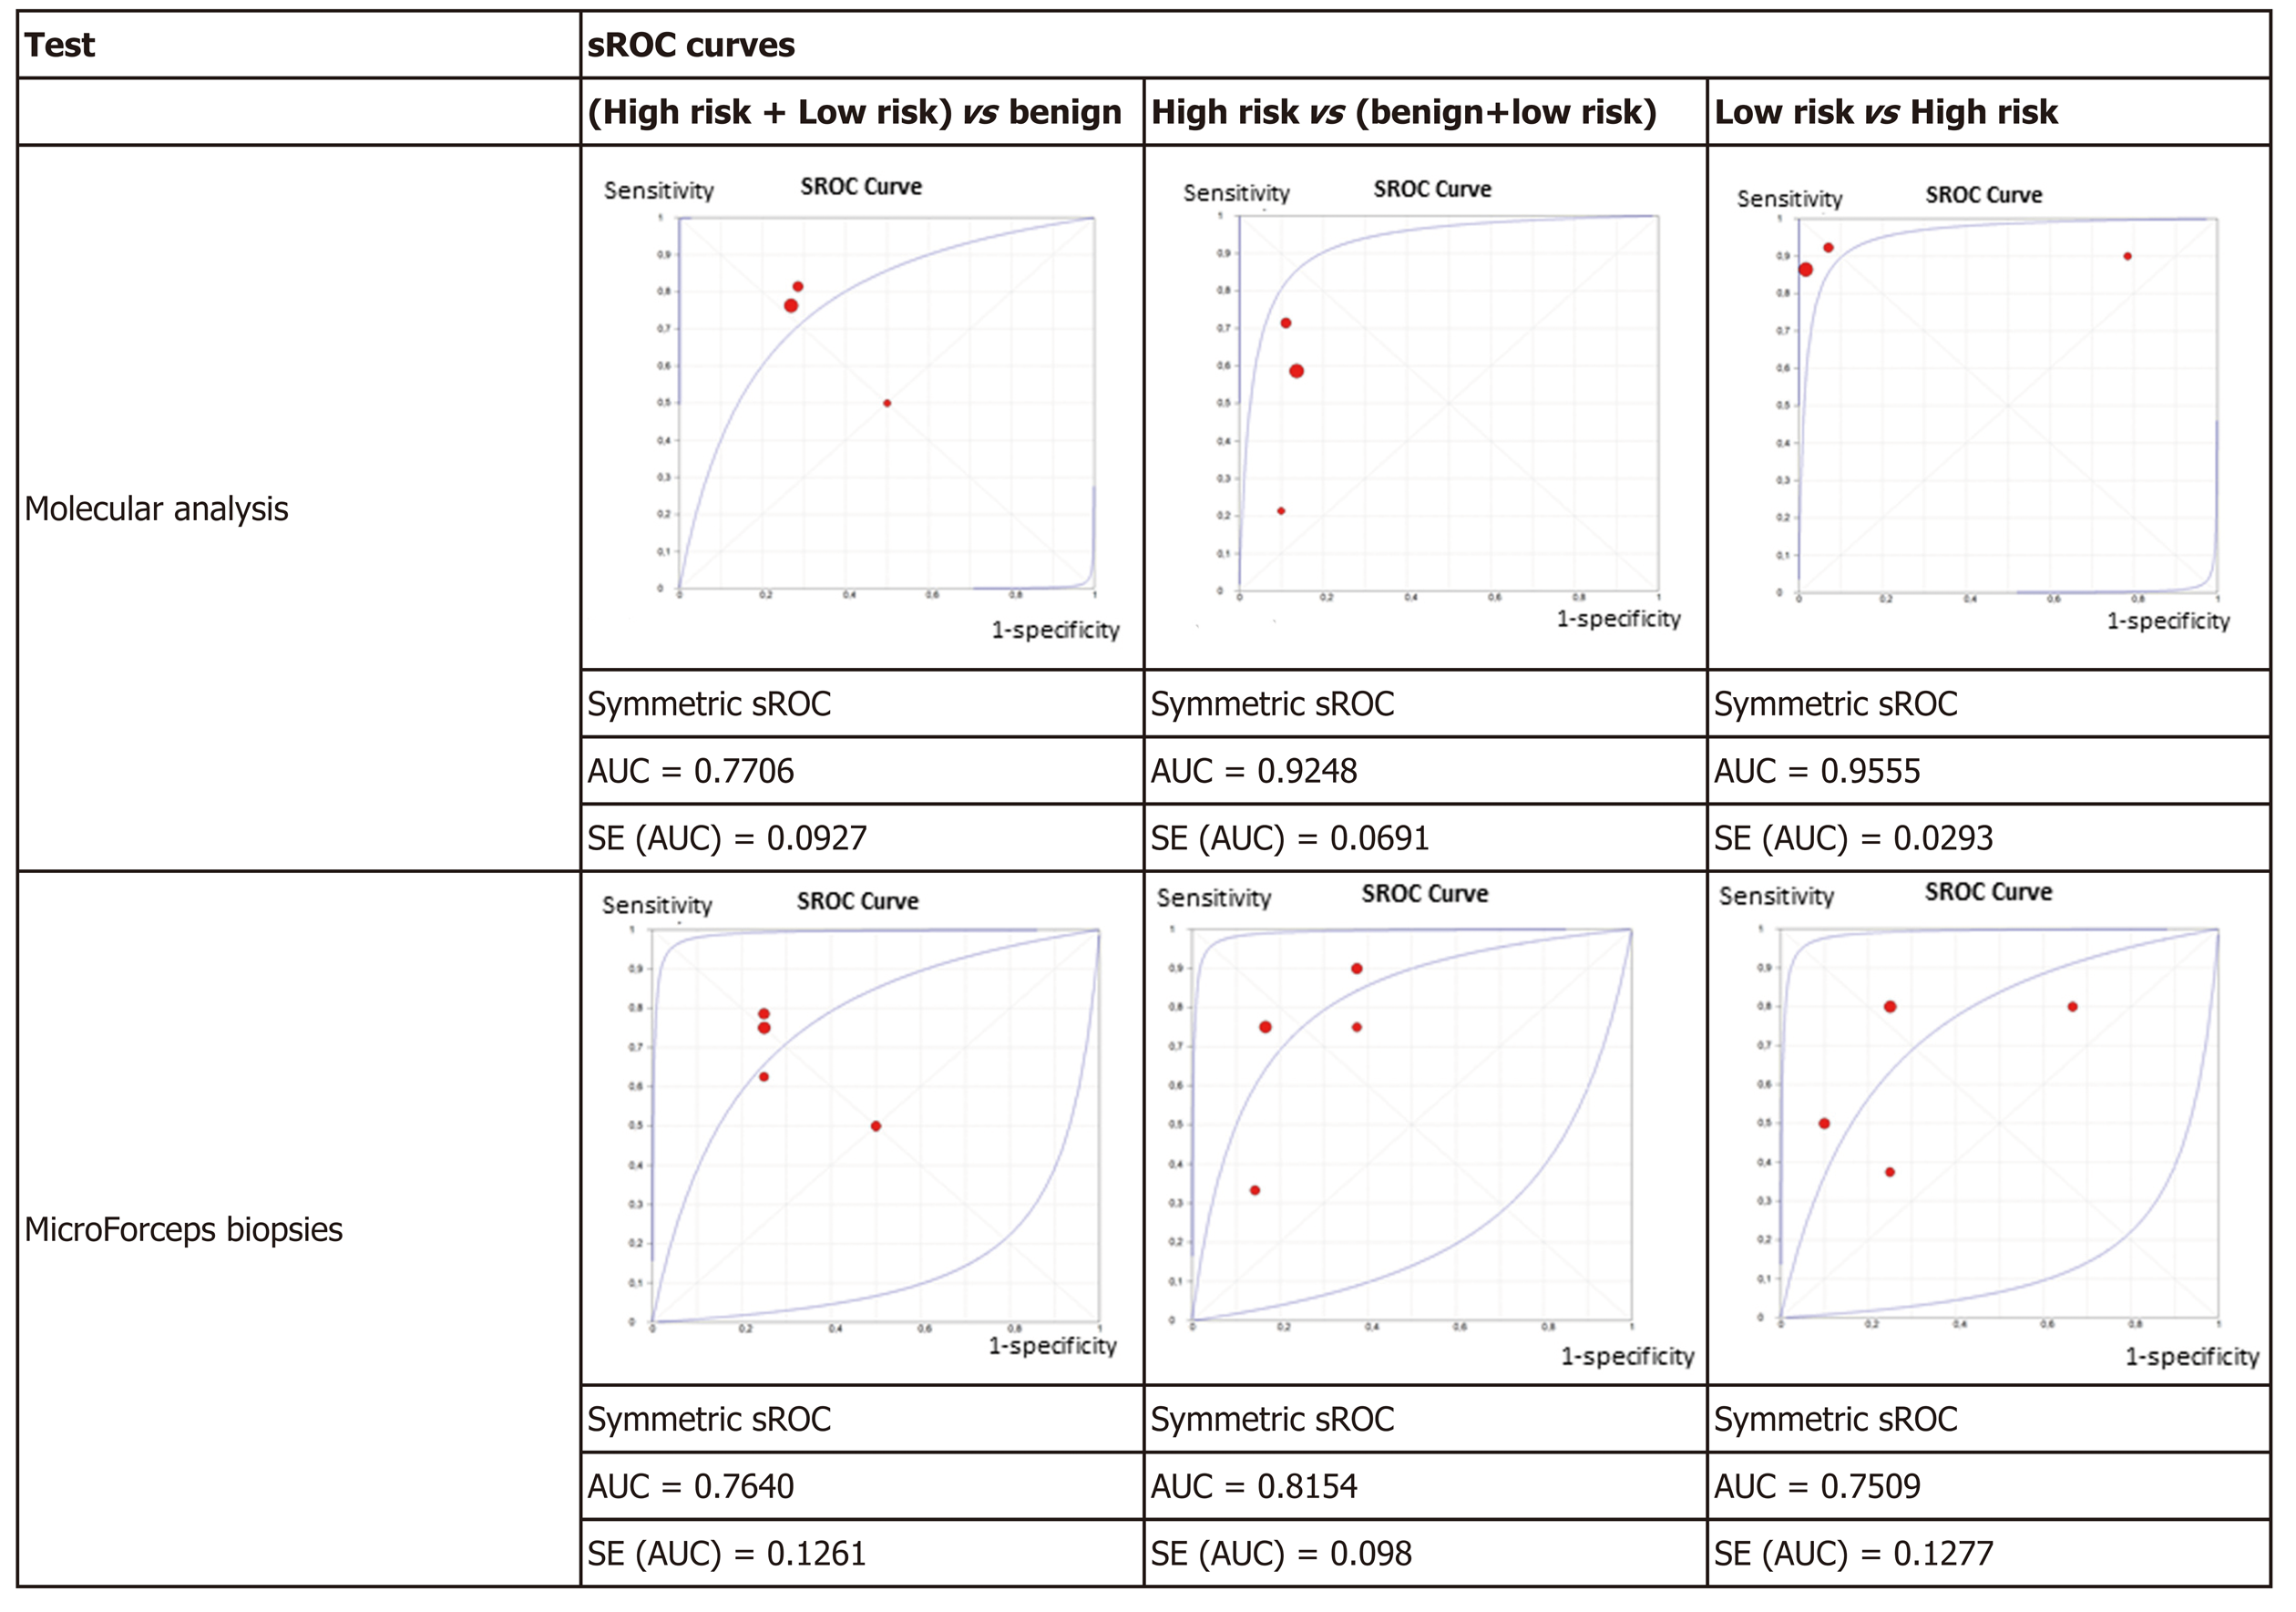
Figure 4 Summary receiver operating characteristics plots.
ROC: Receiver operating characteristic curve; AUC: Area under the curve; SE: Standard error.
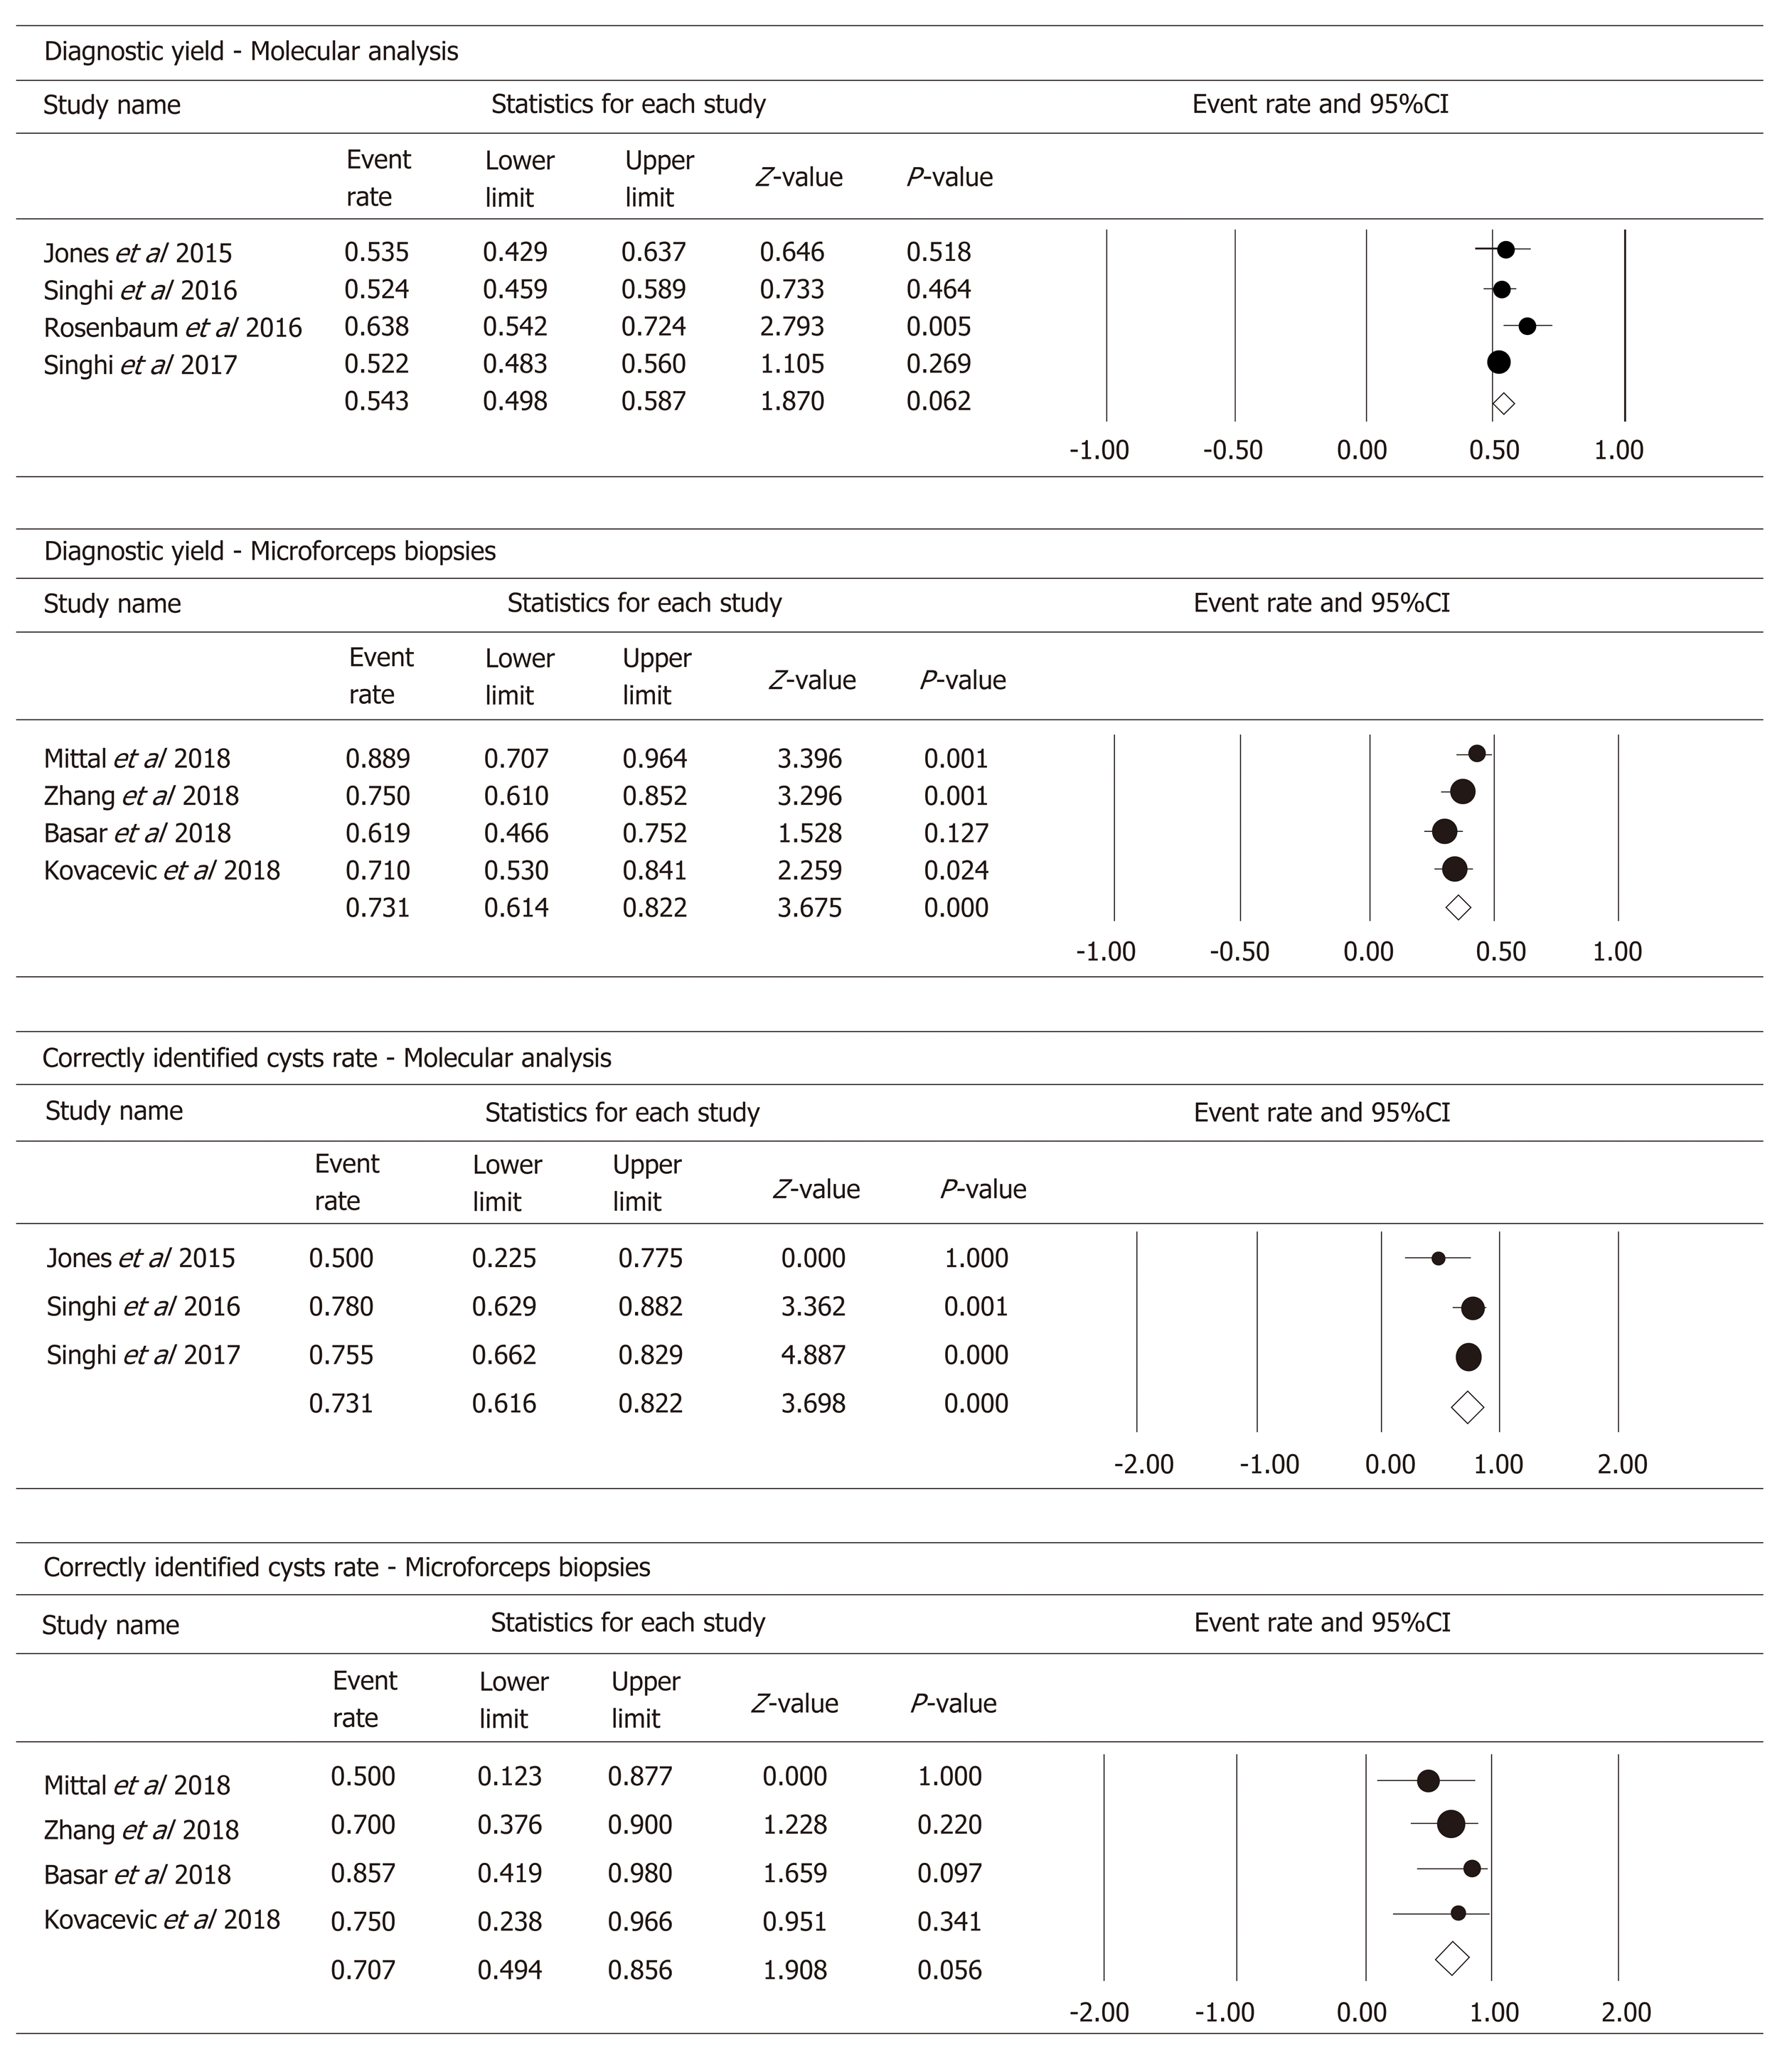
Figure 5 Forest plots of molecular analysis and microforceps biopsies on the secondary outcomes of this meta-analysis.
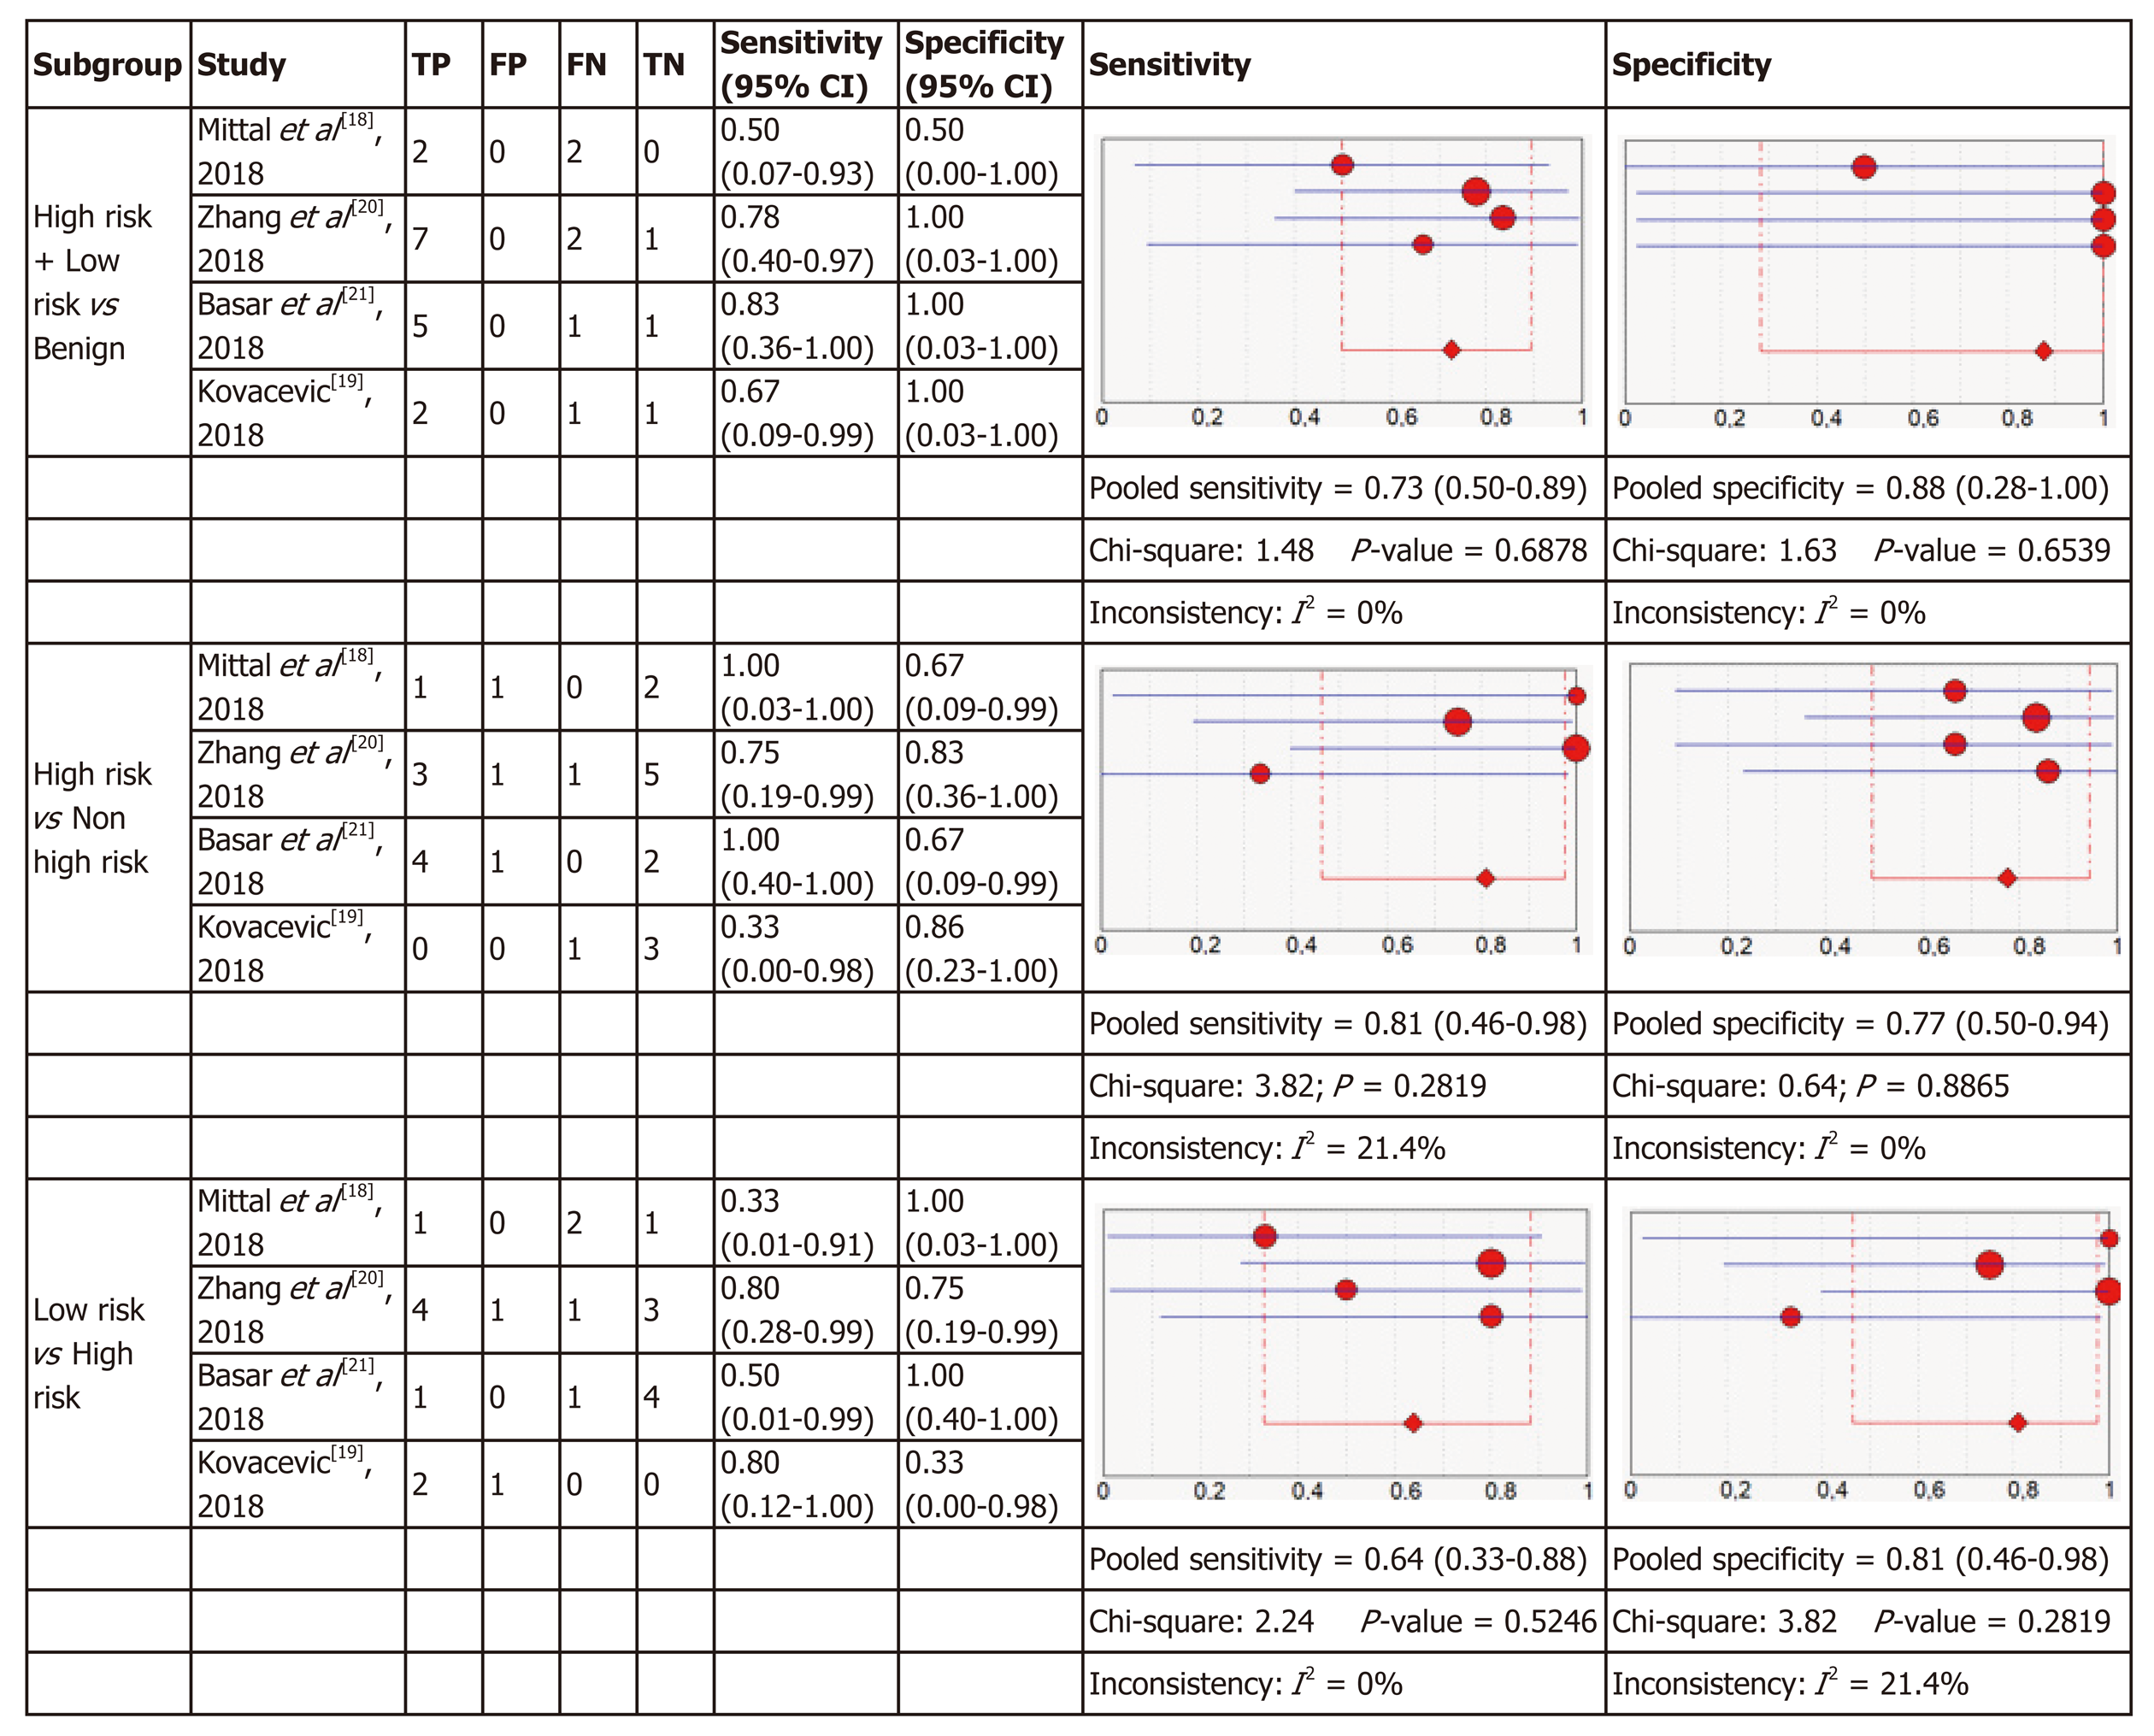
Figure 6 Forest plots of the included studies for microforceps biopsies.
In parentheses are the 95% confidence intervals (CI) of the sensitivity and specificity. The figure shows the estimated sensitivity and specificity of the study (red circle) and its 95%CI (blue horizontal line). The area of the circle reflects the weight that the study contributes to the meta-analysis.
- Citation: Faias S, Pereira L, Luís Â, Chaves P, Cravo M. Genetic testing vs microforceps biopsy in pancreatic cysts: Systematic review and meta-analysis. World J Gastroenterol 2019; 25(26): 3450-3467
- URL: https://www.wjgnet.com/1007-9327/full/v25/i26/3450.htm
- DOI: https://dx.doi.org/10.3748/wjg.v25.i26.3450


