Copyright
©The Author(s) 2019.
World J Gastroenterol. Jun 28, 2019; 25(24): 3030-3043
Published online Jun 28, 2019. doi: 10.3748/wjg.v25.i24.3030
Published online Jun 28, 2019. doi: 10.3748/wjg.v25.i24.3030
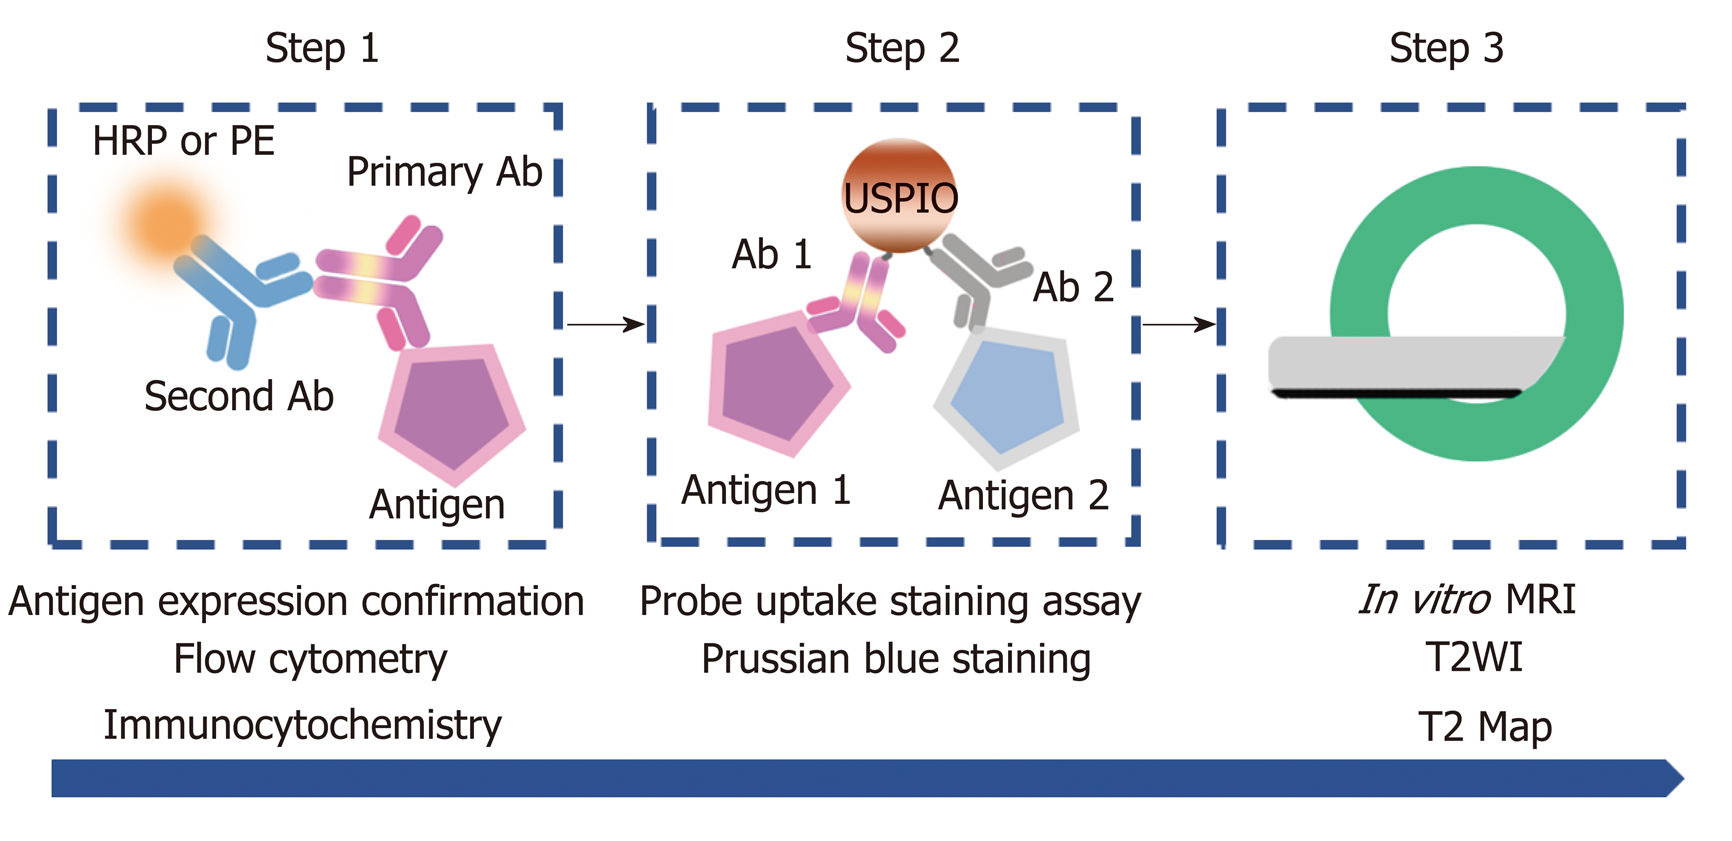
Figure 1 Flow of cell-based experiments.
First, AFP and GPC3 antigen expression on Hepa1-6/GPC3 cells was confirmed by flow cytometry and immunocytochemistry (step 1). Next, the cellular uptake of USPIO probes was investigated by performing Prussian blue-staining assays for iron (step 2). Finally, in vitro MRI was performed, including T2-weighted imaging (T2WI) and T2 Map imaging (step 3). HRP: Horseradish peroxidase; PE: Phycoerythrin; Ab: Antibody; USPIO: Ultra-small superparamagnetic iron oxide; MRI: Magnetic resonance imaging; T2WI: T2-weighted imaging.
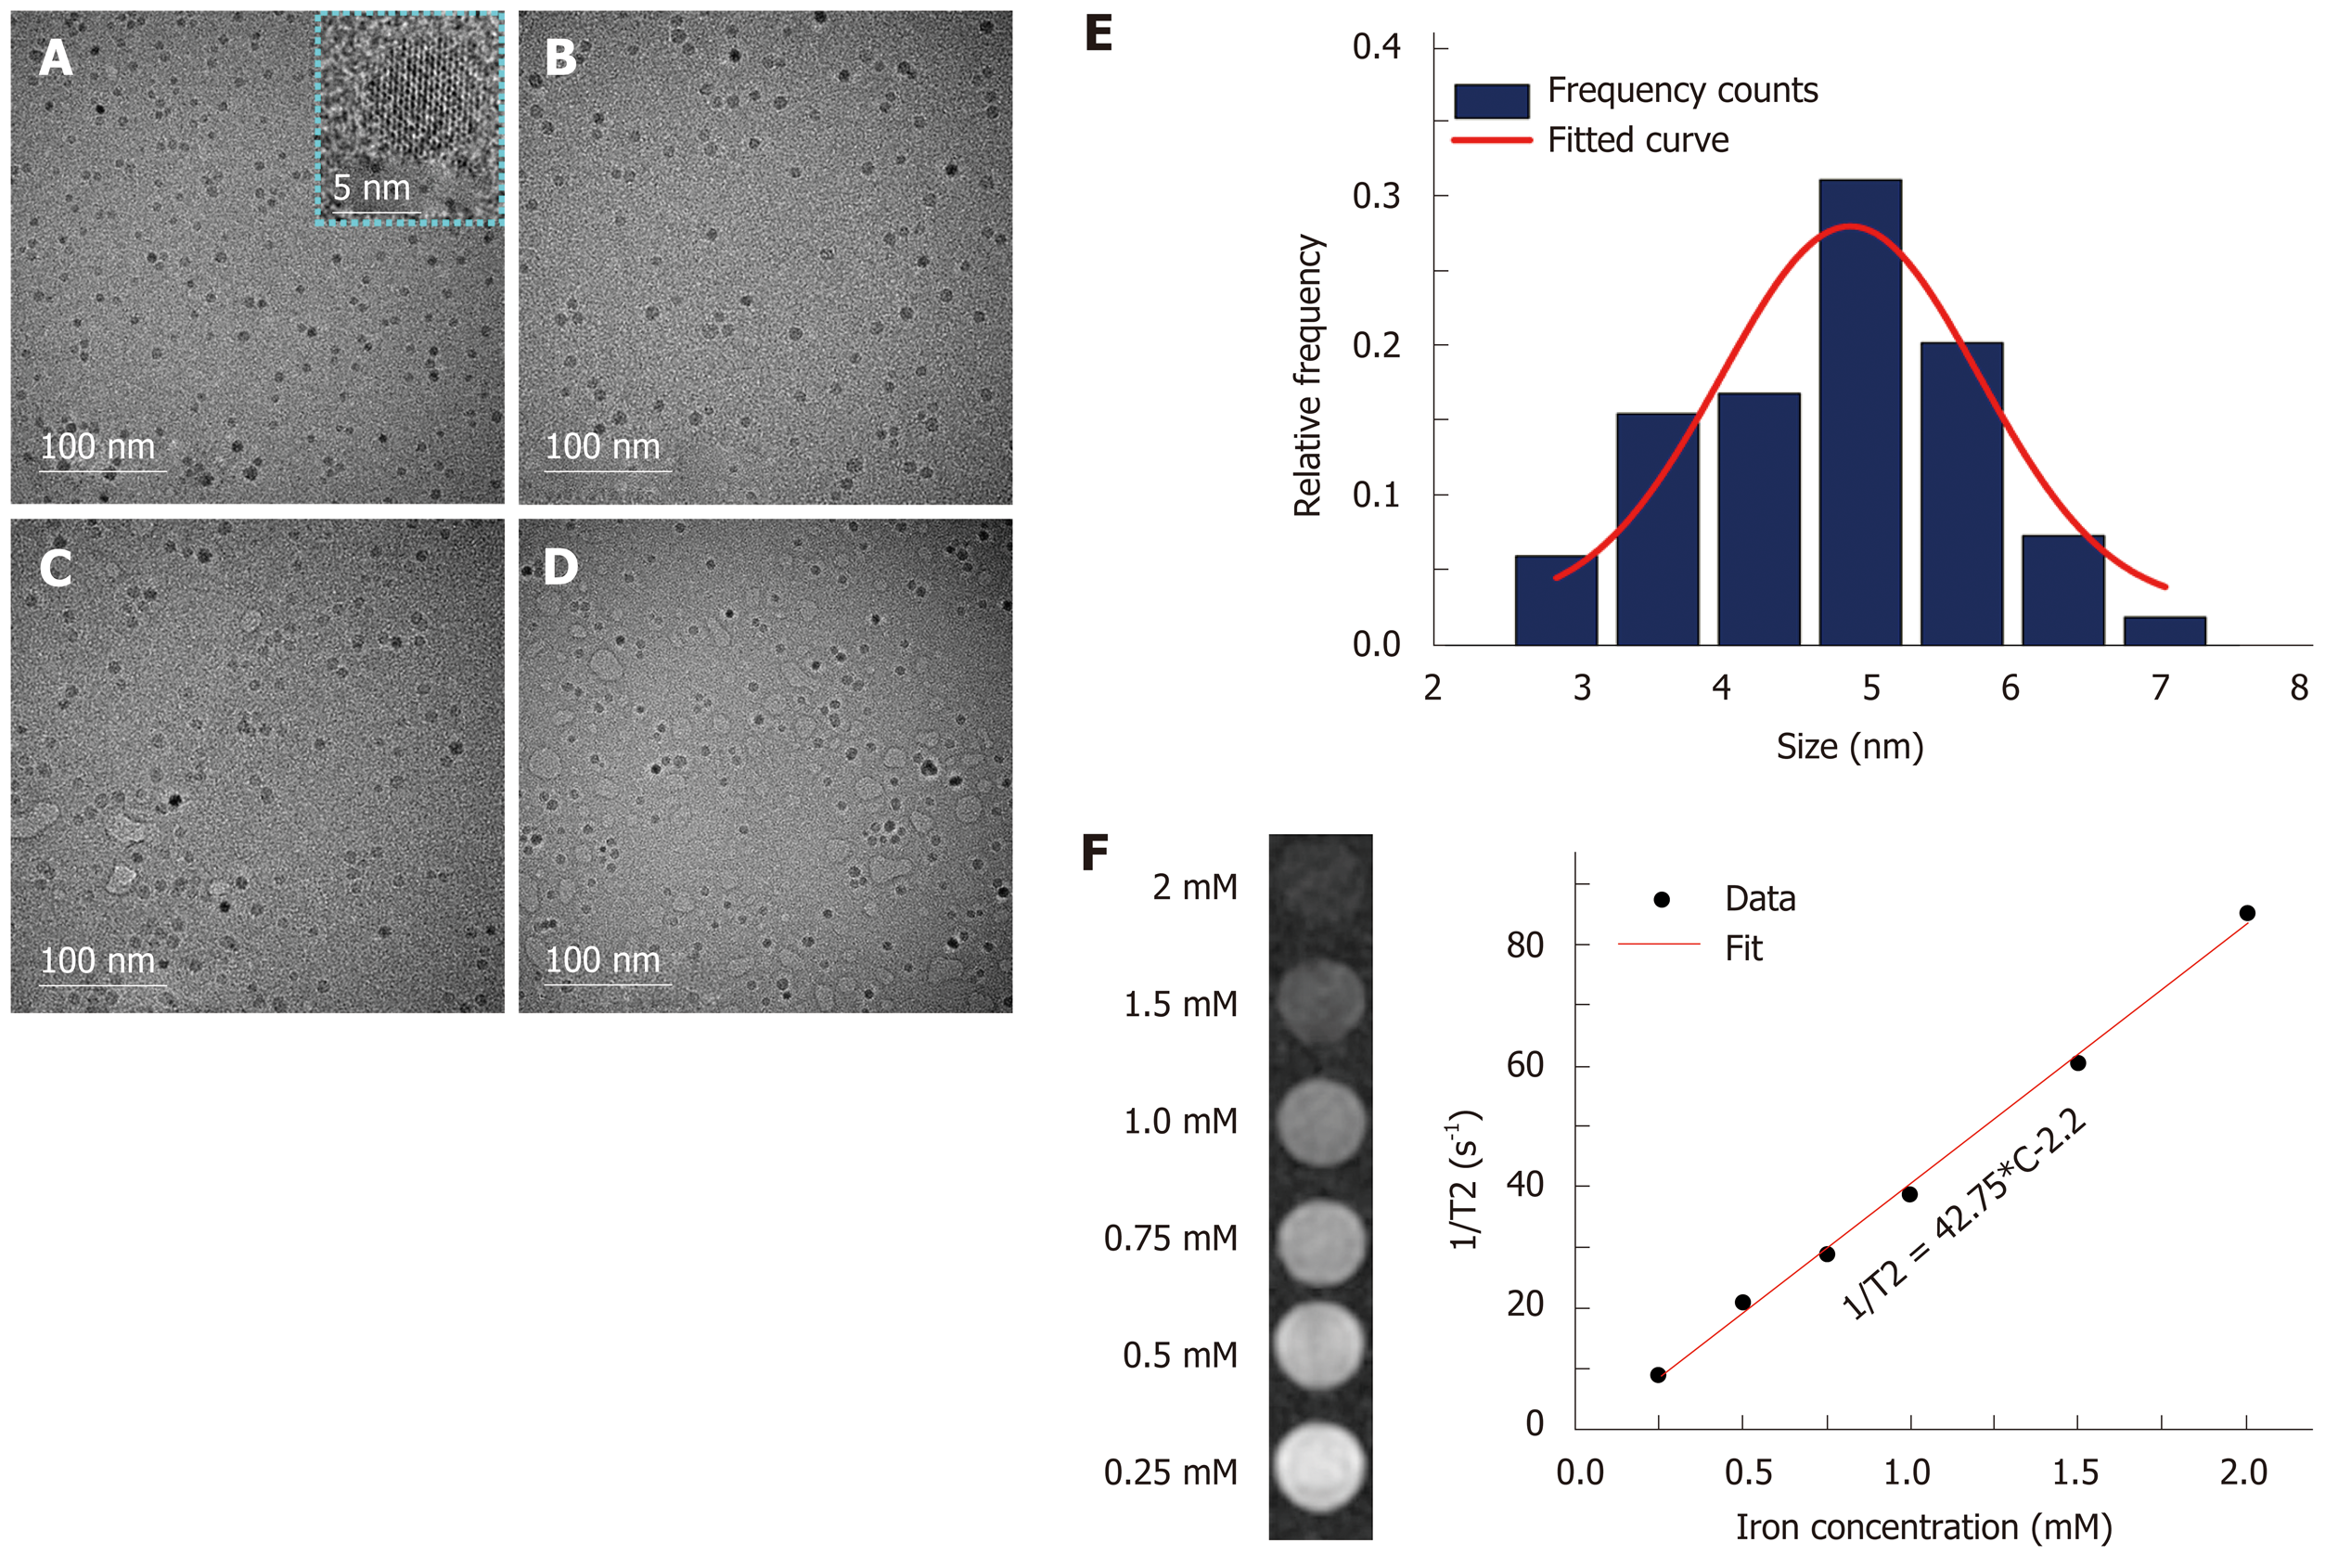
Figure 2 Physical characterization of ultra-small superparamagnetic iron oxide probes by transmission electron microscopy and magnetic resonance imaging.
A-D: Transmission electron microscopy (TEM) images of ultra-small superparamagnetic iron oxide (USPIO) probes of U, UA, UG, and UAG, respectively. E: The core size distribution of USPIO with a mean diameter of 4.88 nm and a standard deviation of 0.16 nm (n = 147), as determined from the TEM images. F: T2-weighted magnetic resonance images of a series of water solutions containing different concentrations of USPIO as indicated by iron concentration (left) and linear regression fitting of the transversal relaxation rate (1/T2) data vs different iron concentrations for extracting the transverse relaxivity r2 (right). UAG: Anti-AFP–USPIO–anti-GPC3; UA: Anti-AFP–USPIO; UG: Anti-GPC3–USPIO; U: Unlabeled (non-targeted) USPIO.
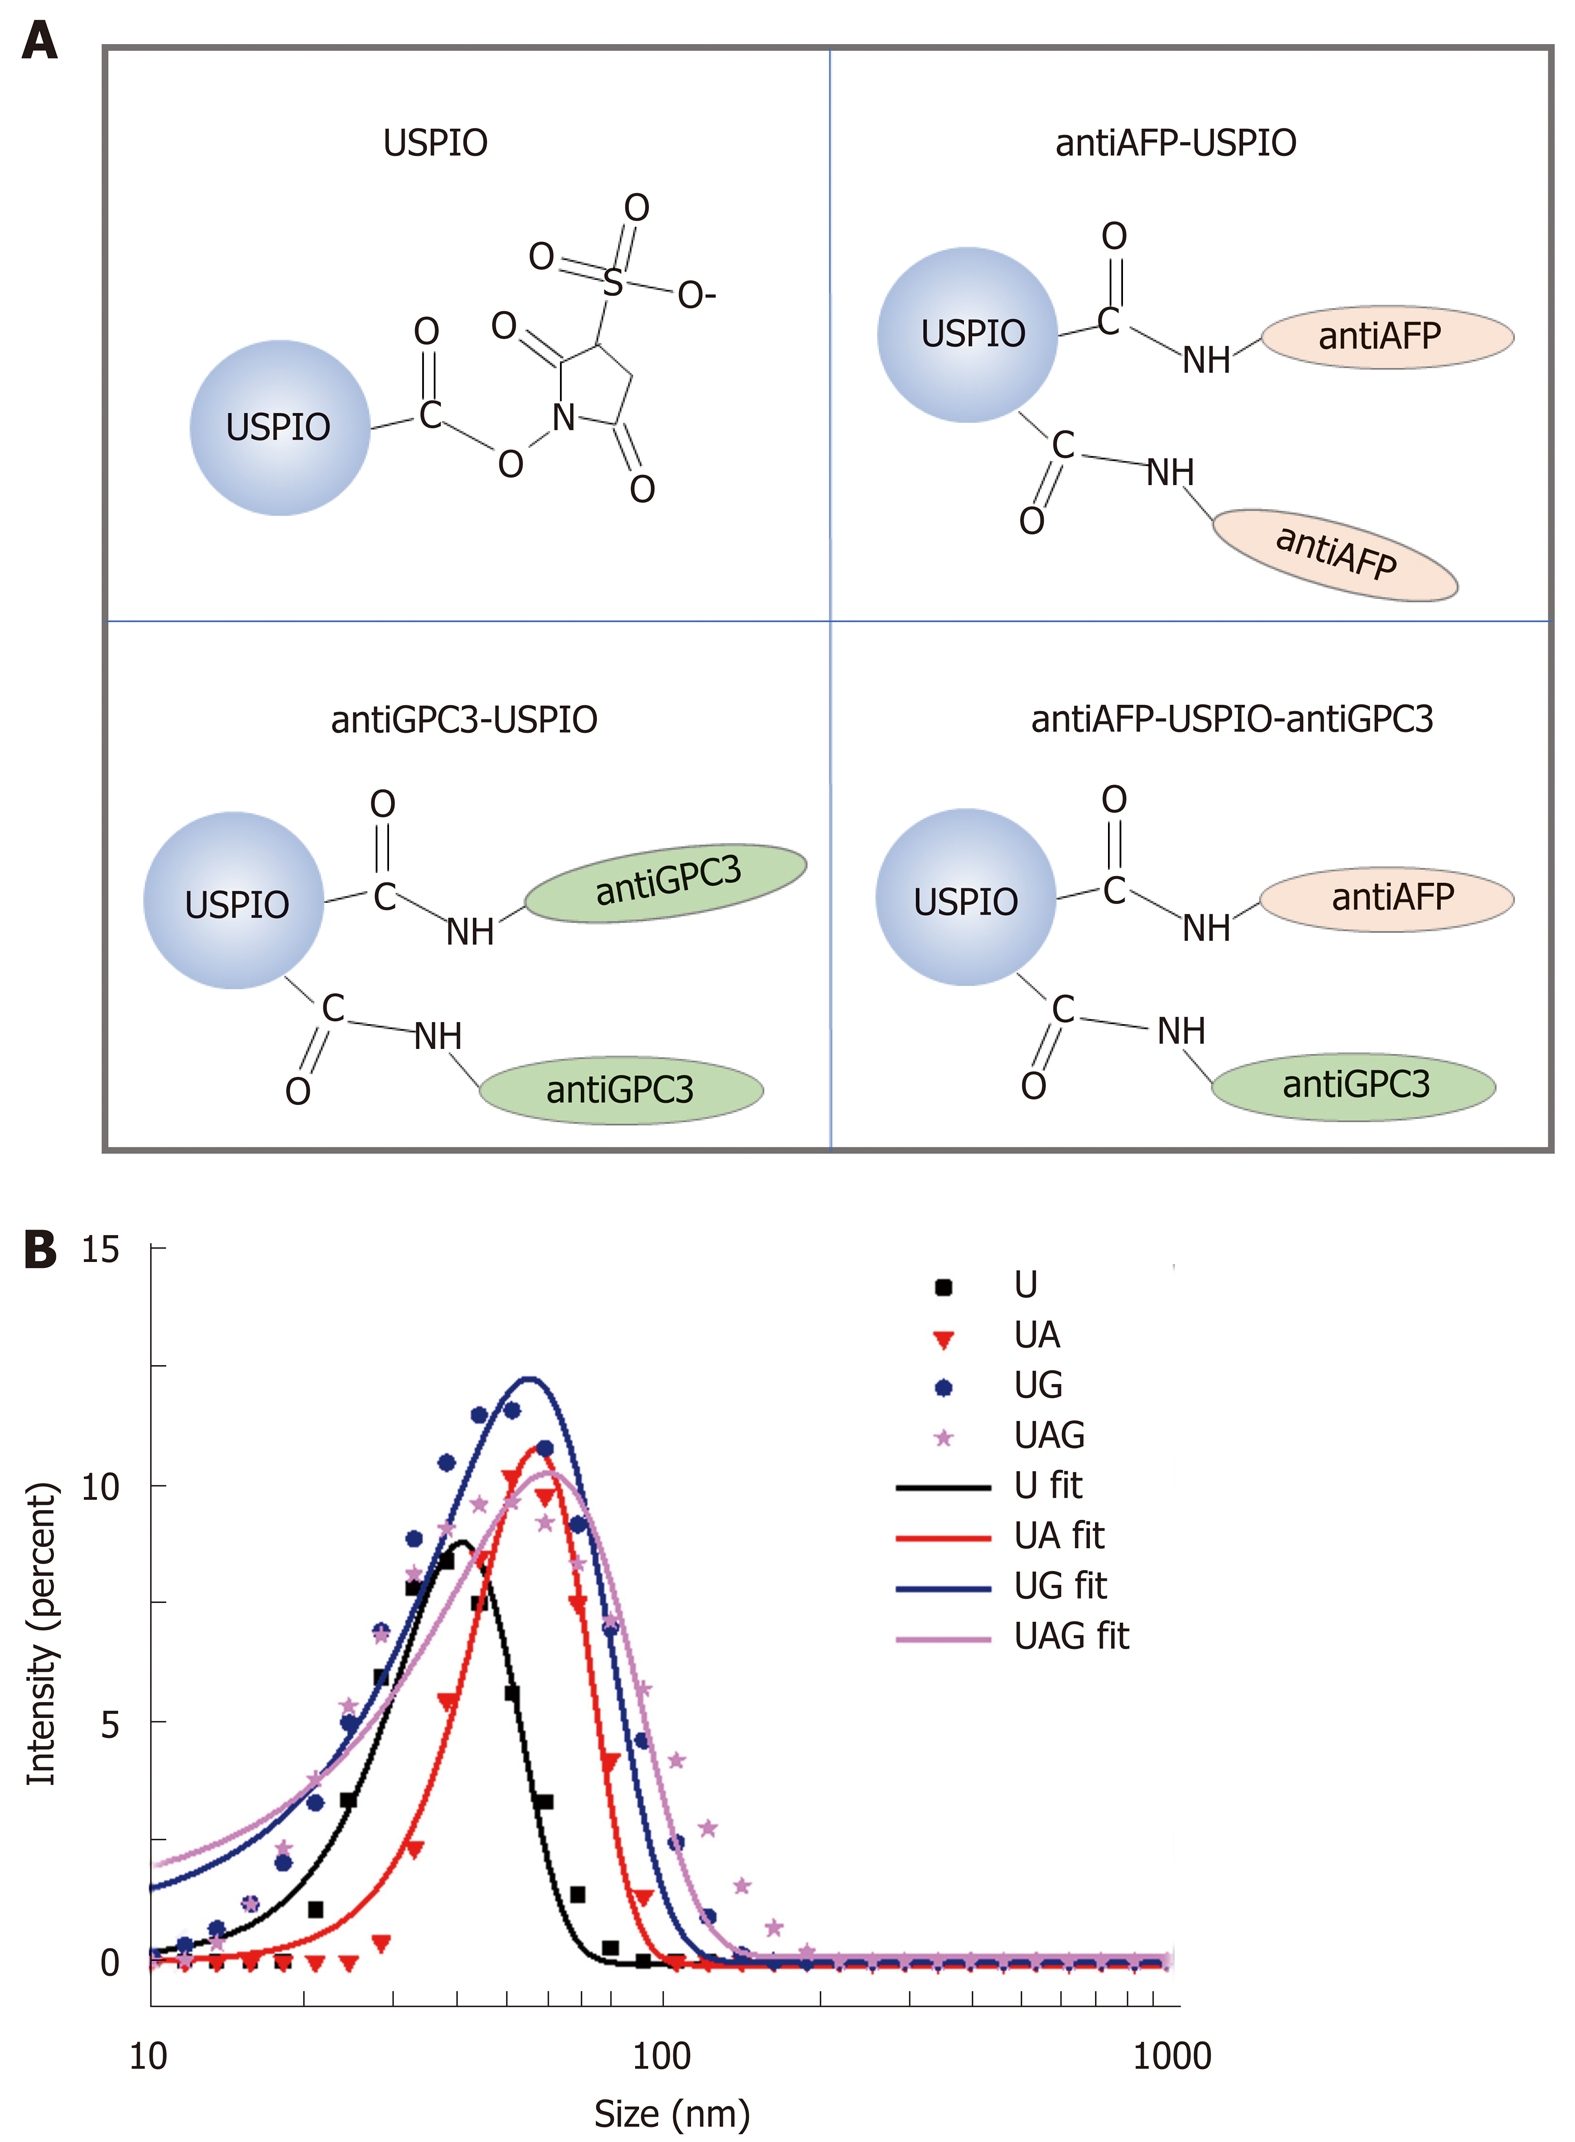
Figure 3 Hydrodynamic size distribution of antibody-conjugated ultra-small superparamagnetic iron oxides.
A: Schematic illustration of the conjugation between antibodies (anti-AFP and anti-GPC3) and USPIO-NHS ester to form single or double antibody-conjugated USPIO probes. B: Hydrodynamic size distribution of USPIO (U), anti-AFP–USPIO (UA), anti-GPC3–USPIO (UG), and anti-AFP–USPIO–anti-GPC3 (UAG). USPIO: Ultra-small superparamagnetic iron oxide; AFP: Alpha-fetoprotein; GPC3: Glypican-3; NHS ester: Succinimidyl ester.
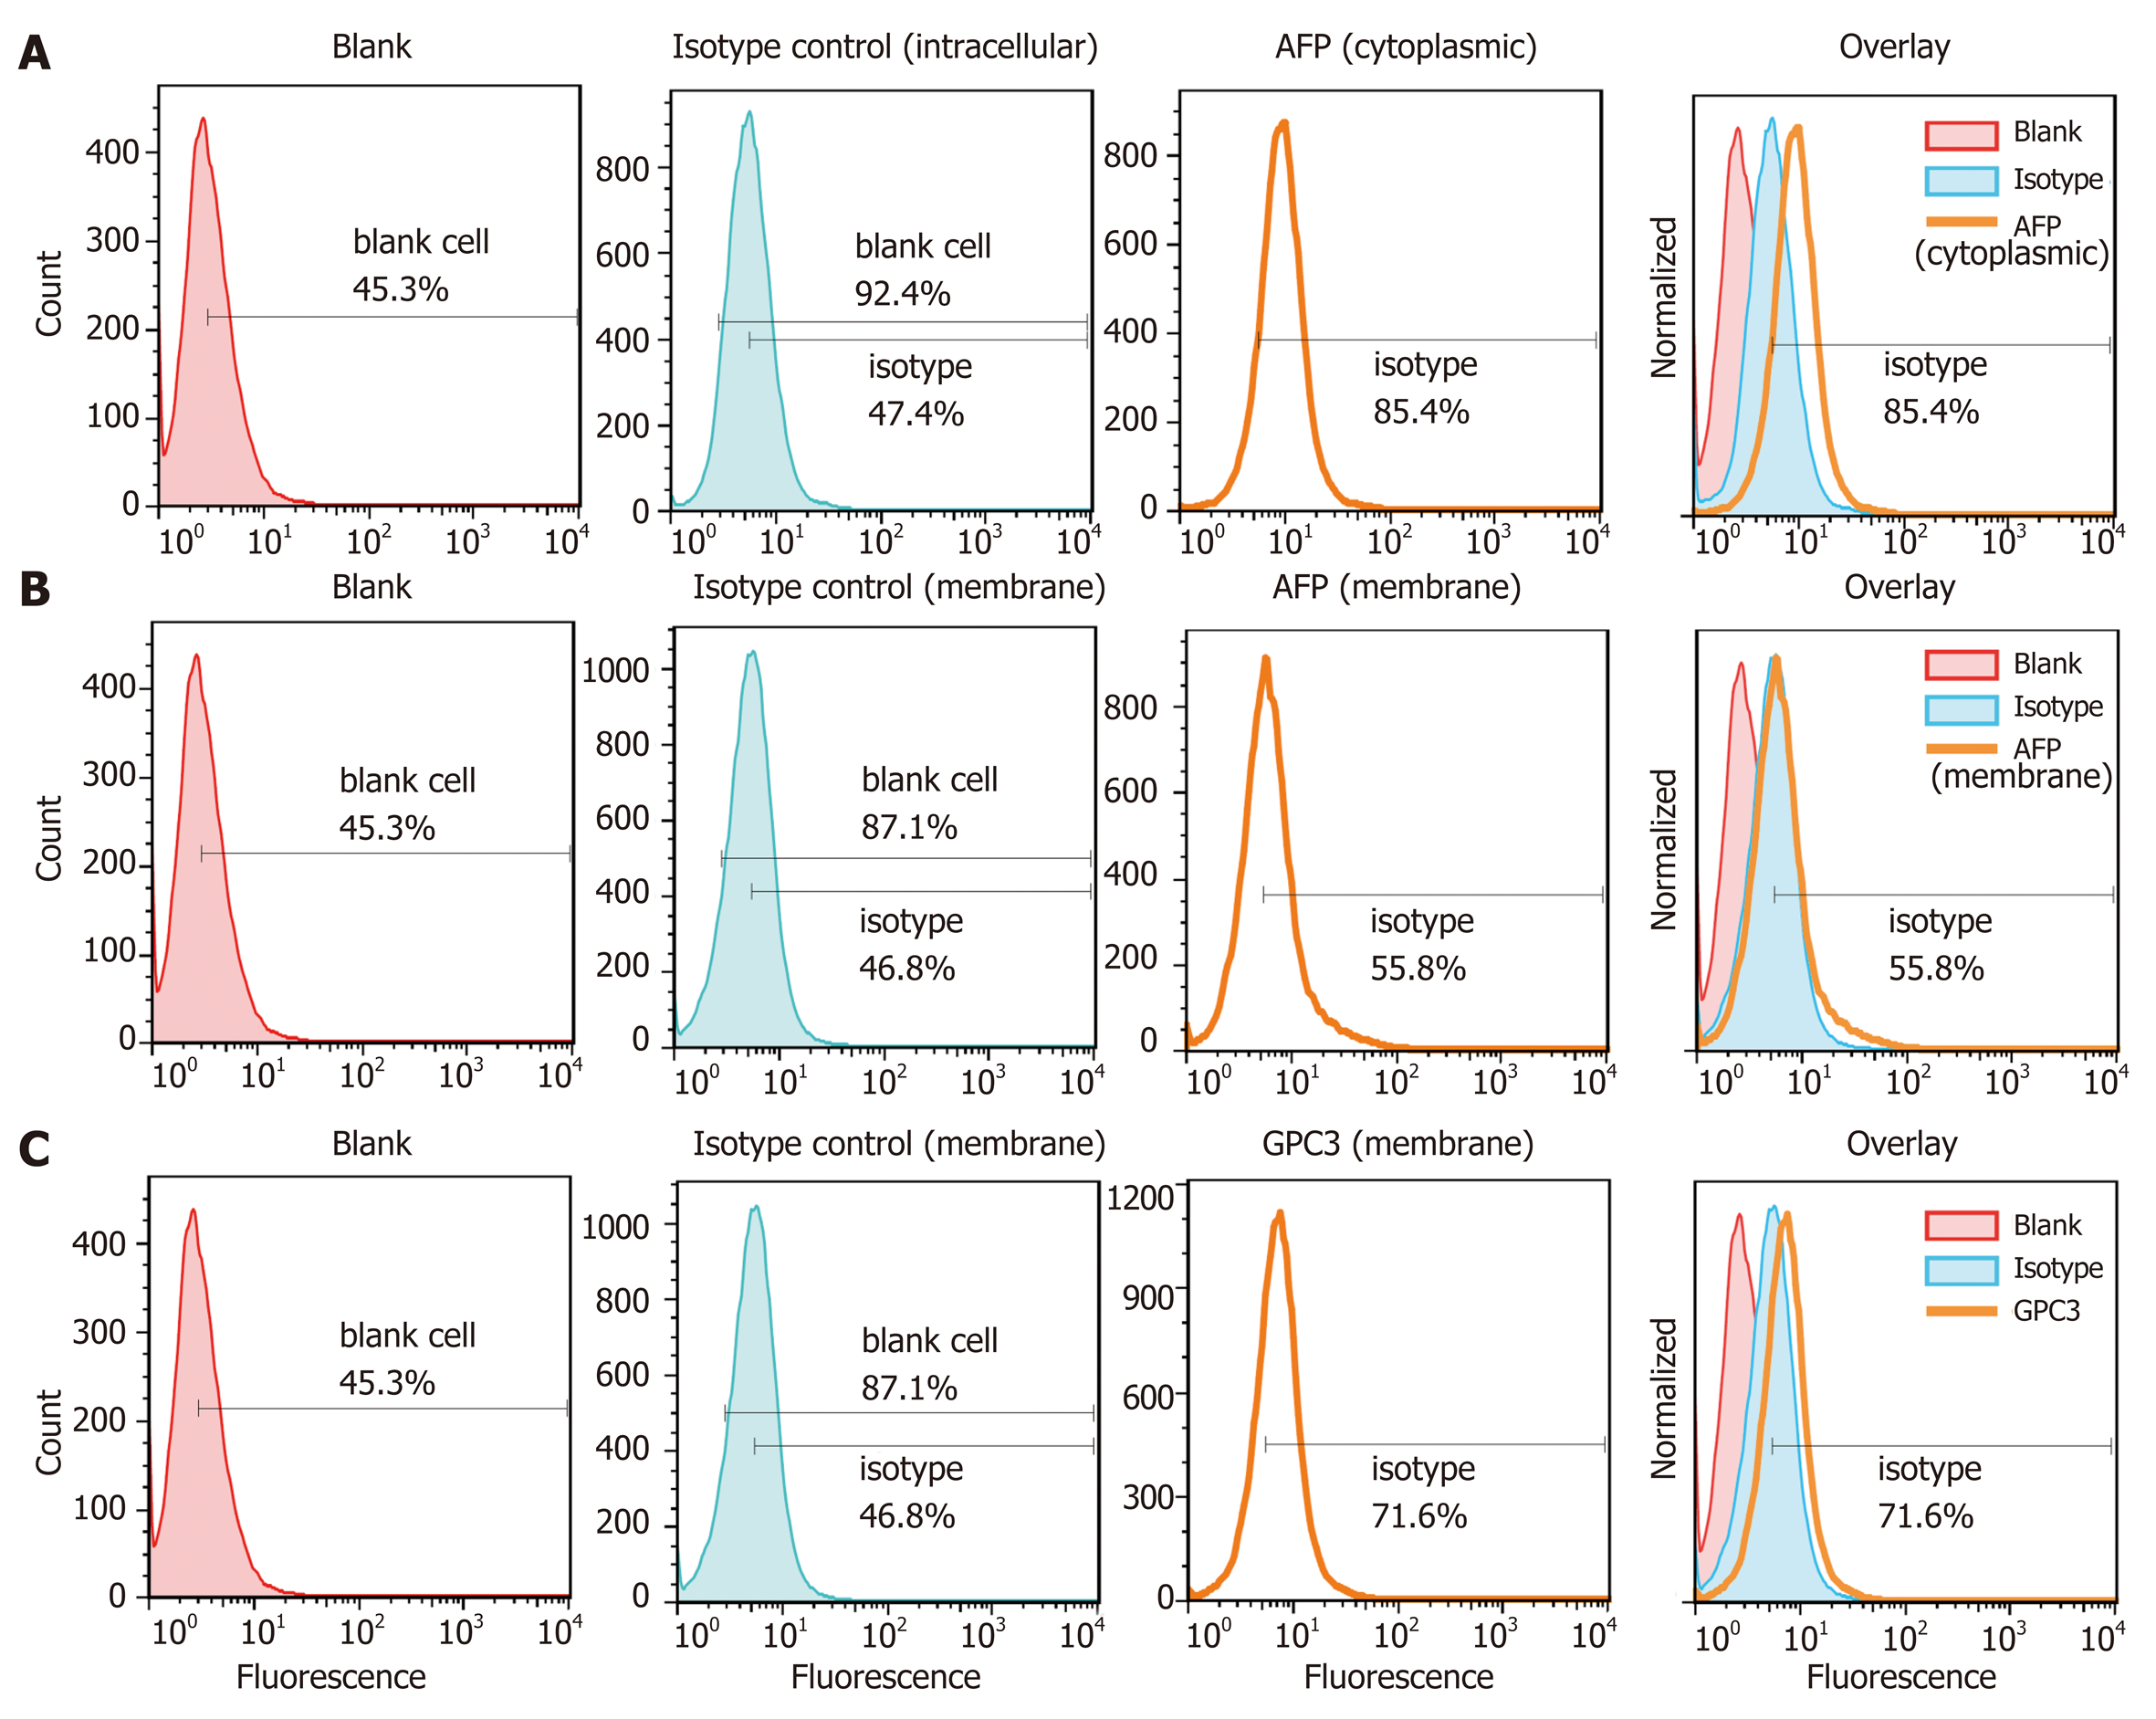
Figure 4 Detection of alpha-fetoprotein and glypican-3 antigen expression in Hepa1-6/GPC3 cells by flow cytometry.
Flow cytometry data showed significantly higher alpha-fetoprotein expression in the cytoplasm (A) than in the membrane (B), compared with blank cell and IgG isotype controls. C: The positive shift of fluorescence distribution compared with isotype control illustrated higher membrane expression of the glypican-3 antigen. AFP: Alpha-fetoprotein; GPC3: Glypican-3.
Figure 5 Cellular immunocytochemistry results.
From left to right: Horseradish peroxidase-based immunological staining with IgG isotype control, anti-alpha-fetoprotein antibody, and anti-glypican-3 antibody.
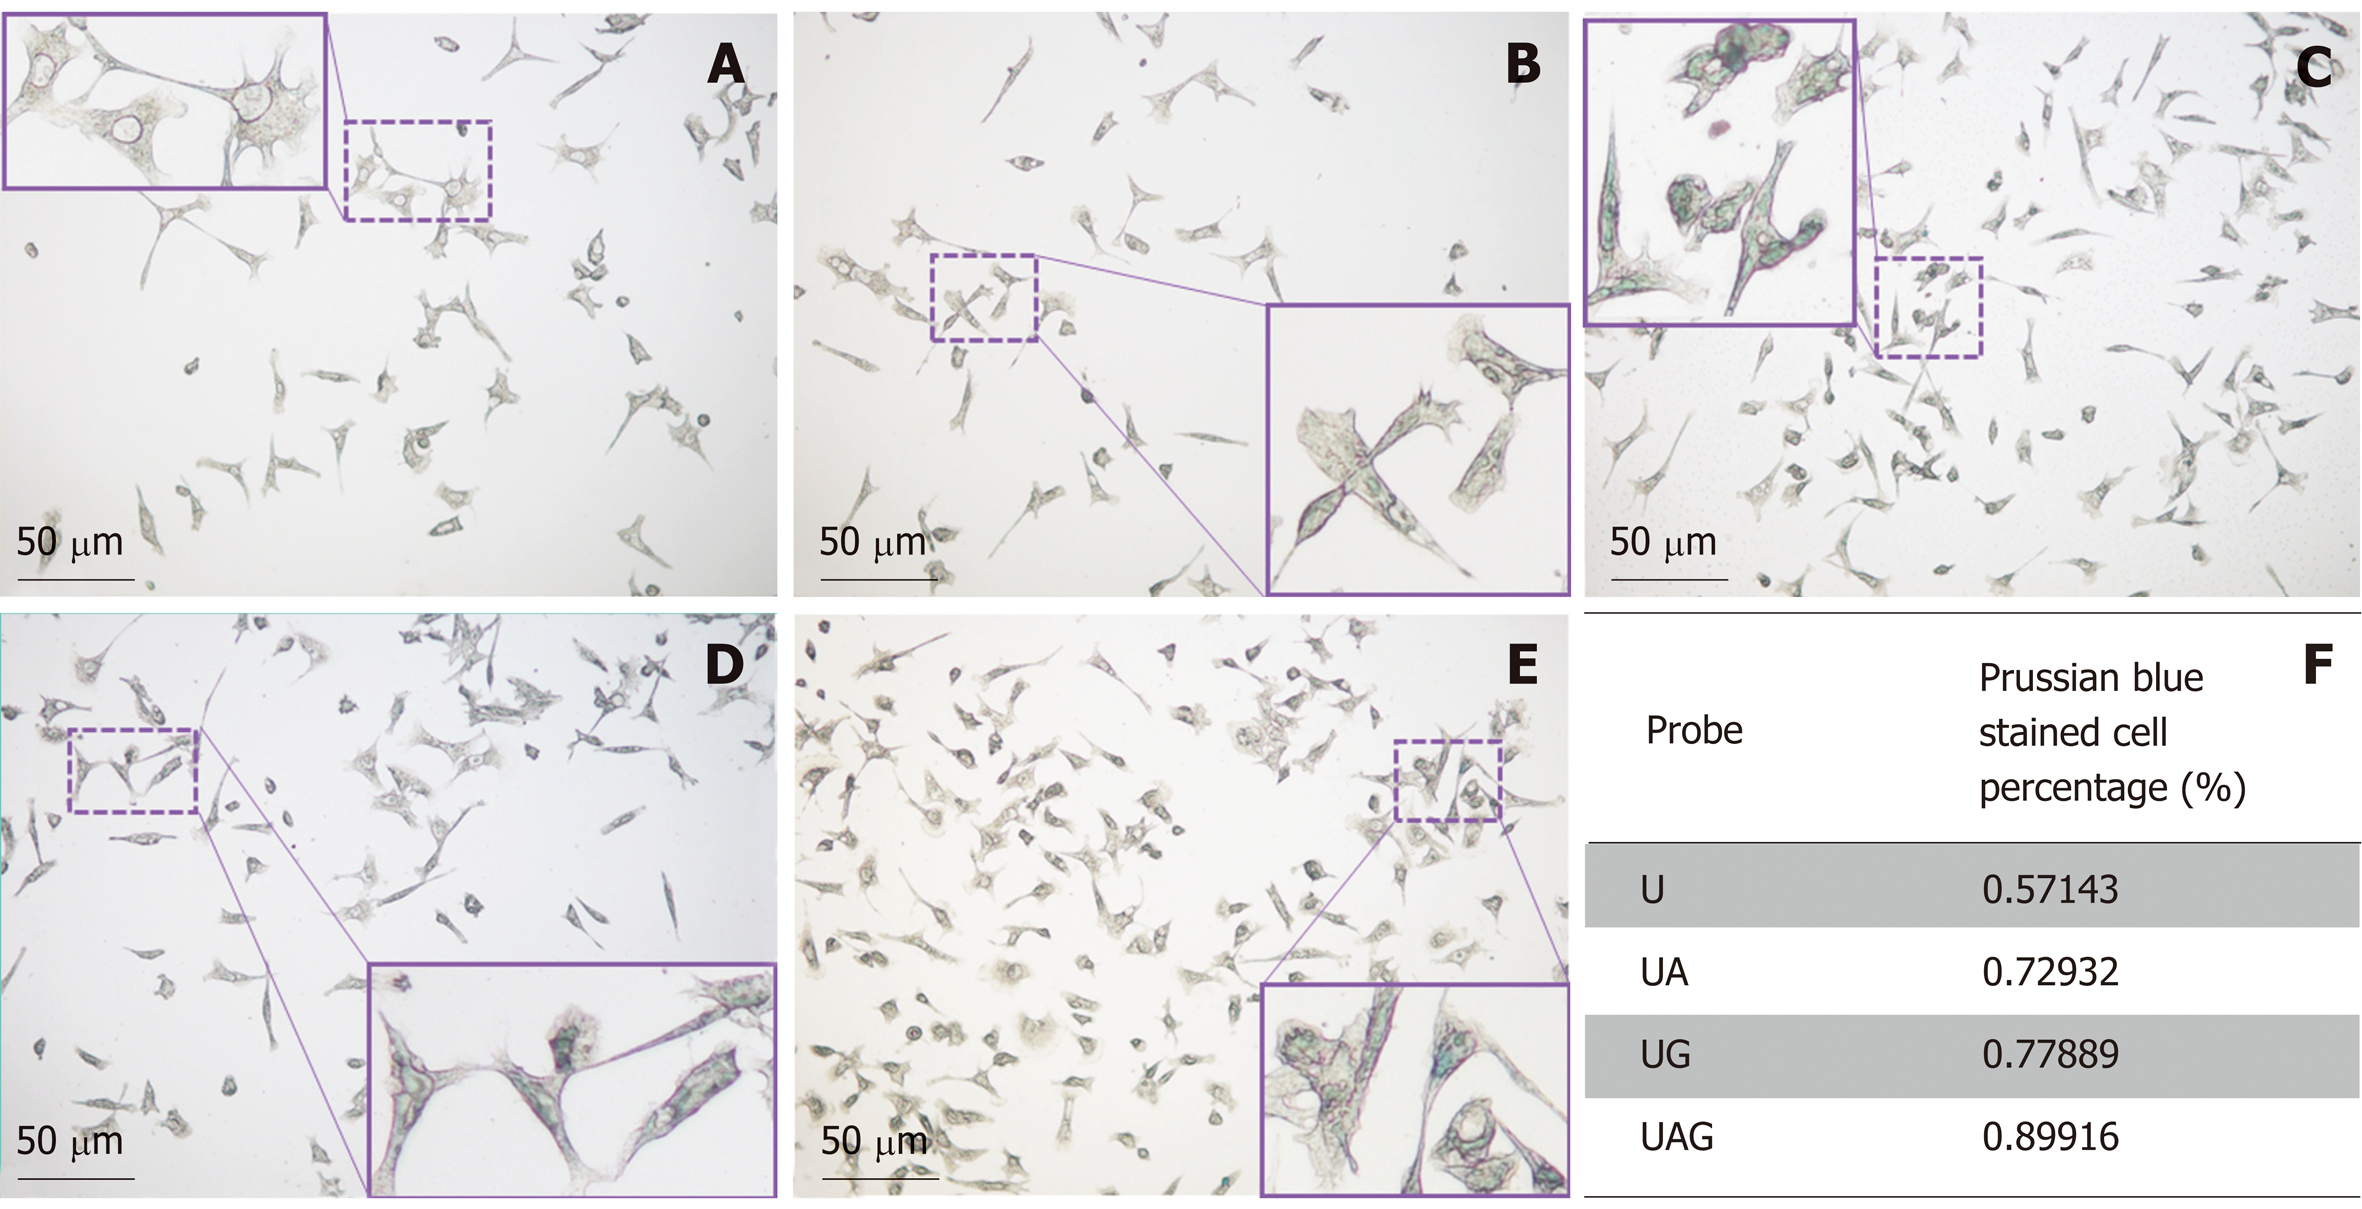
Figure 6 Prussian blue staining of Hepa1-6/GPC3 cells treated with four kinds of ultra-small superparamagnetic iron oxide probes.
Prussian blue-staining images of blank Hepa1-6/GPC3 cells (A) and Hepa1-6/GPC3 cells treated with 50 µg Fe/mL of (B) USPIO (U), (C) anti-AFP–USPIO (UA), (D) anti-GPC3–USPIO (UG), or (E) anti-AFP–USPIO–anti-GPC3 (UAG). (F) Quantitation of the percentages of blue stained cells. The total counted cell number for the U, UA, UG, and UAG groups was 84, 133, 199, and 119, respectively. USPIO: Ultra-small superparamagnetic iron oxide; AFP: Alpha-fetoprotein; GPC3: Glypican-3; UAG: Anti-AFP–USPIO–anti-GPC3; UA: Anti-AFP–USPIO; UG: Anti-GPC3–USPIO; U: Unlabeled (non-targeted) USPIO.
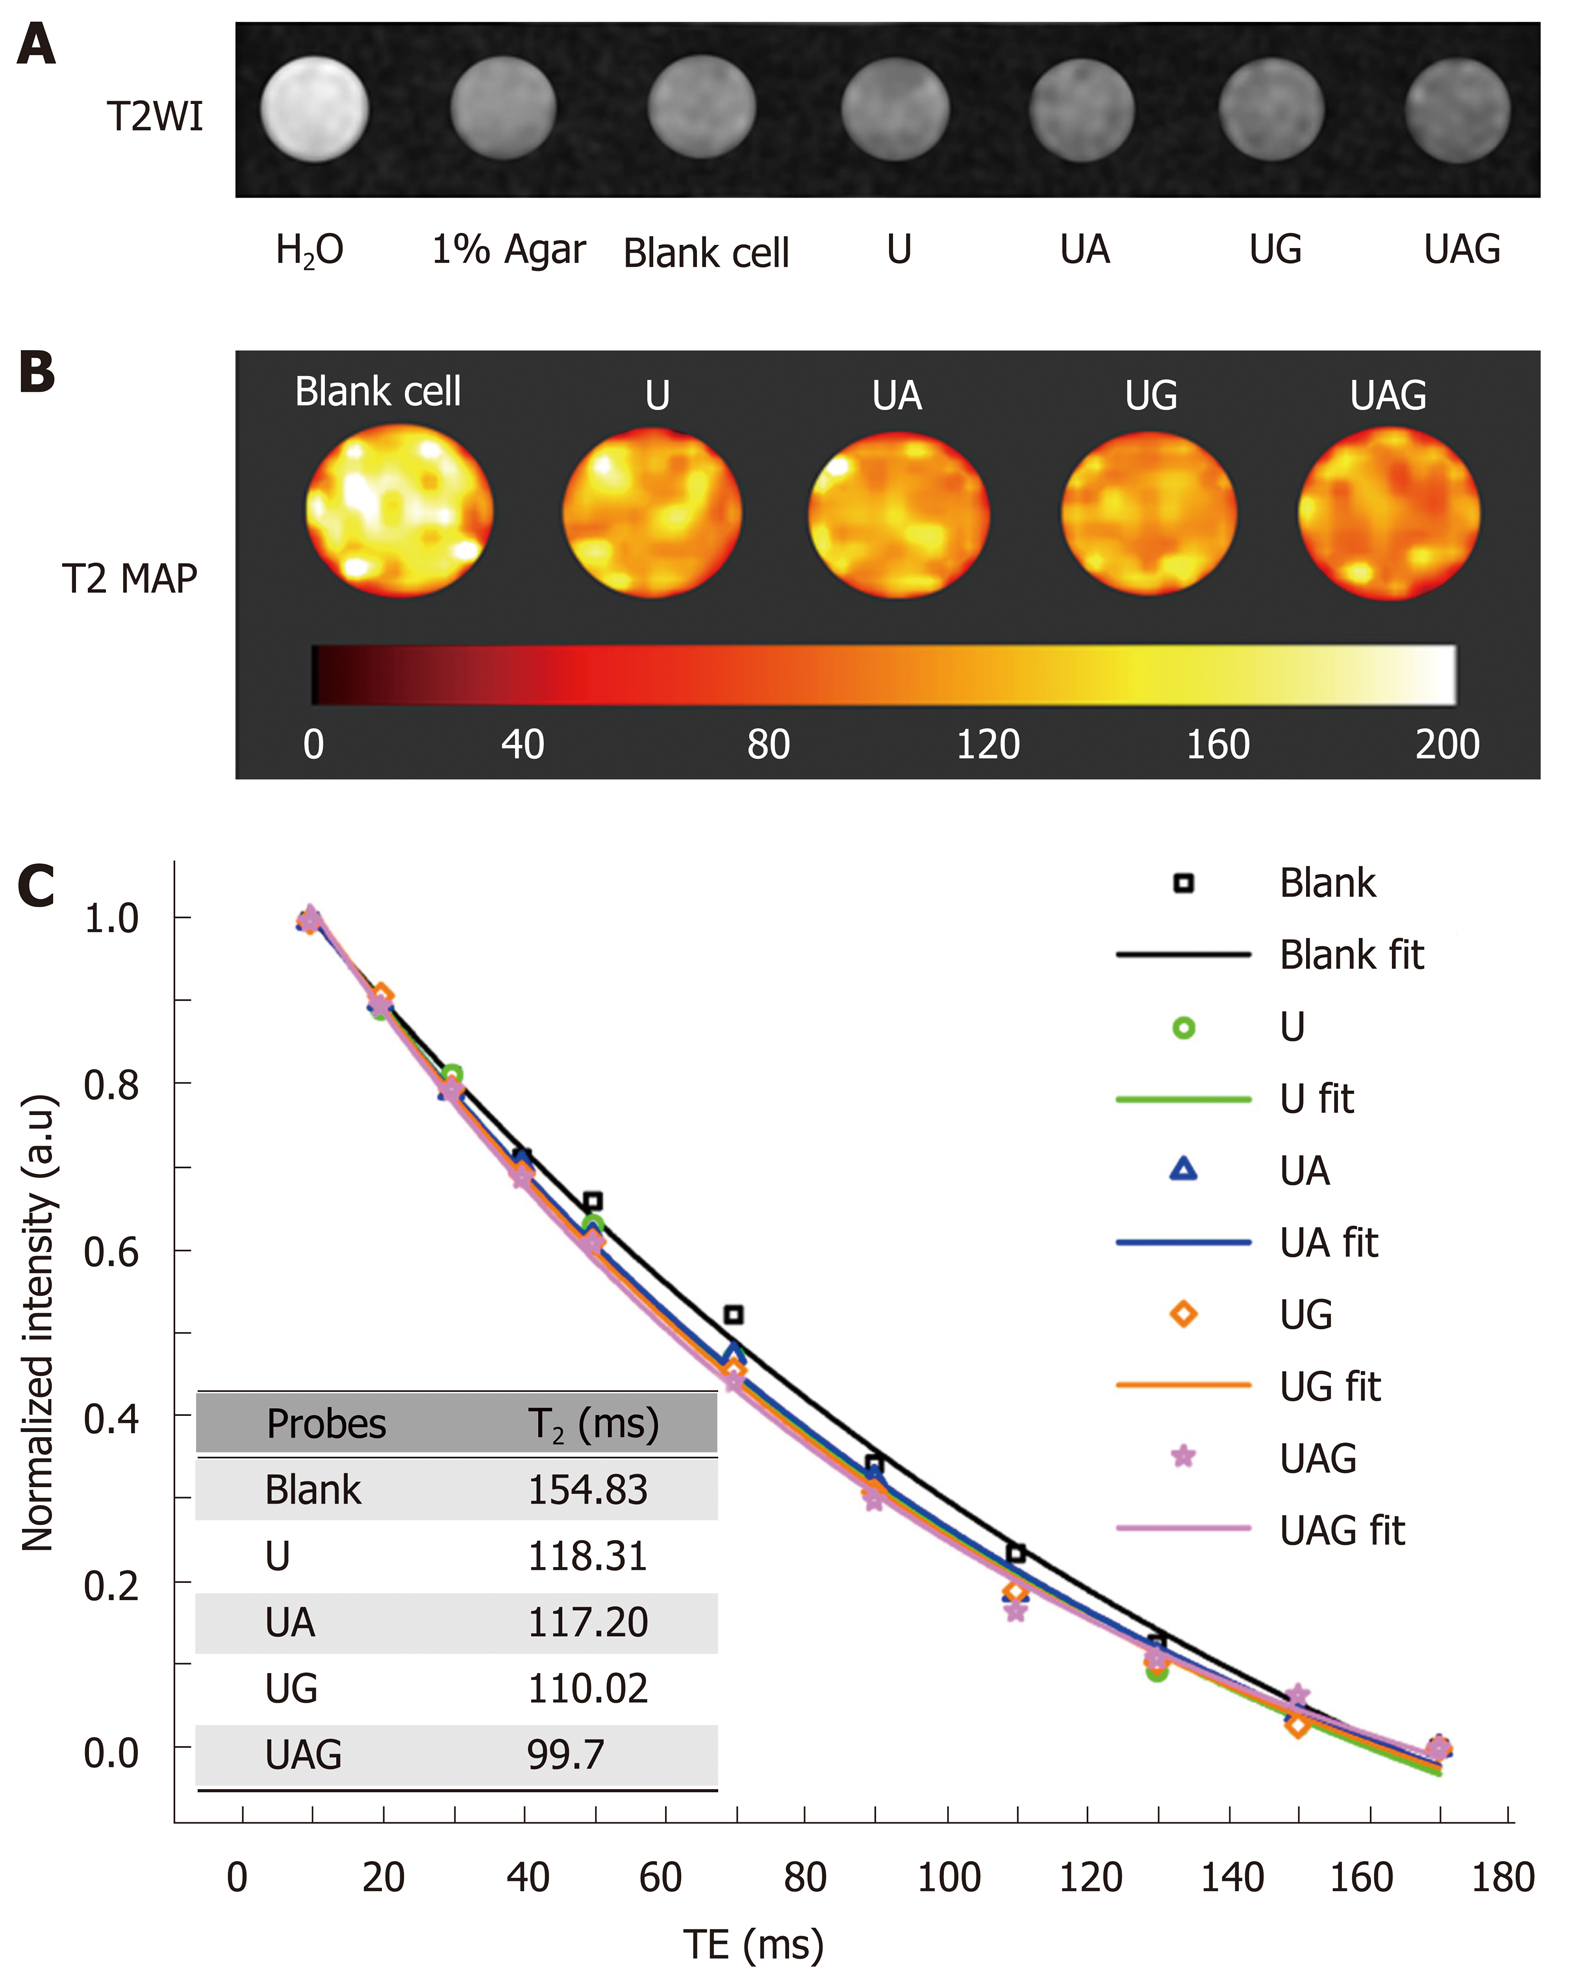
Figure 7 In vitro magnetic resonance imaging results demonstrating the binding efficiency and imaging properties of different ultra-small superparamagnetic iron oxide probes.
A: T2WI of different samples contained in a 96-well plate. From left to right: H2O, 1% agar, blank Hepa1-6/GPC3 cells, and hepa1-6/GPC3 cells treated with 100 µg Fe/mL USPIO (U), anti-AFP–USPIO (UA), anti-GPC3–USPIO (anti-GPC3–USPIO), or anti-AFP–USPIO–anti-GPC3 (UAG). B: Pseudocolor T2 map of cell samples treated with U, UA, UG, and UAG, respectively, compared with blank cells. T2 values are illustrated with a color bar. C: Signal intensities of cells after different probe treatments under different TE and exponential fits for the T2 values. Inset: The fitted T2 relaxation time for cells treated with different USPIO probes (blank control, U, UA, UG, or UAG). USPIO: Ultra-small superparamagnetic iron oxide; AFP: Alpha-fetoprotein; GPC3: Glypican-3; UAG: Anti-AFP–USPIO–anti-GPC3; UA: Anti-AFP–USPIO; UG: Anti-GPC3–USPIO; U: Unlabeled (non-targeted) USPIO; T2WI: T2-weighted imaging.
- Citation: Ma XH, Wang S, Liu SY, Chen K, Wu ZY, Li DF, Mi YT, Hu LB, Chen ZW, Zhao XM. Development and in vitro study of a bi-specific magnetic resonance imaging molecular probe for hepatocellular carcinoma. World J Gastroenterol 2019; 25(24): 3030-3043
- URL: https://www.wjgnet.com/1007-9327/full/v25/i24/3030.htm
- DOI: https://dx.doi.org/10.3748/wjg.v25.i24.3030


