Copyright
©The Author(s) 2019.
World J Gastroenterol. Jun 14, 2019; 25(22): 2799-2808
Published online Jun 14, 2019. doi: 10.3748/wjg.v25.i22.2799
Published online Jun 14, 2019. doi: 10.3748/wjg.v25.i22.2799
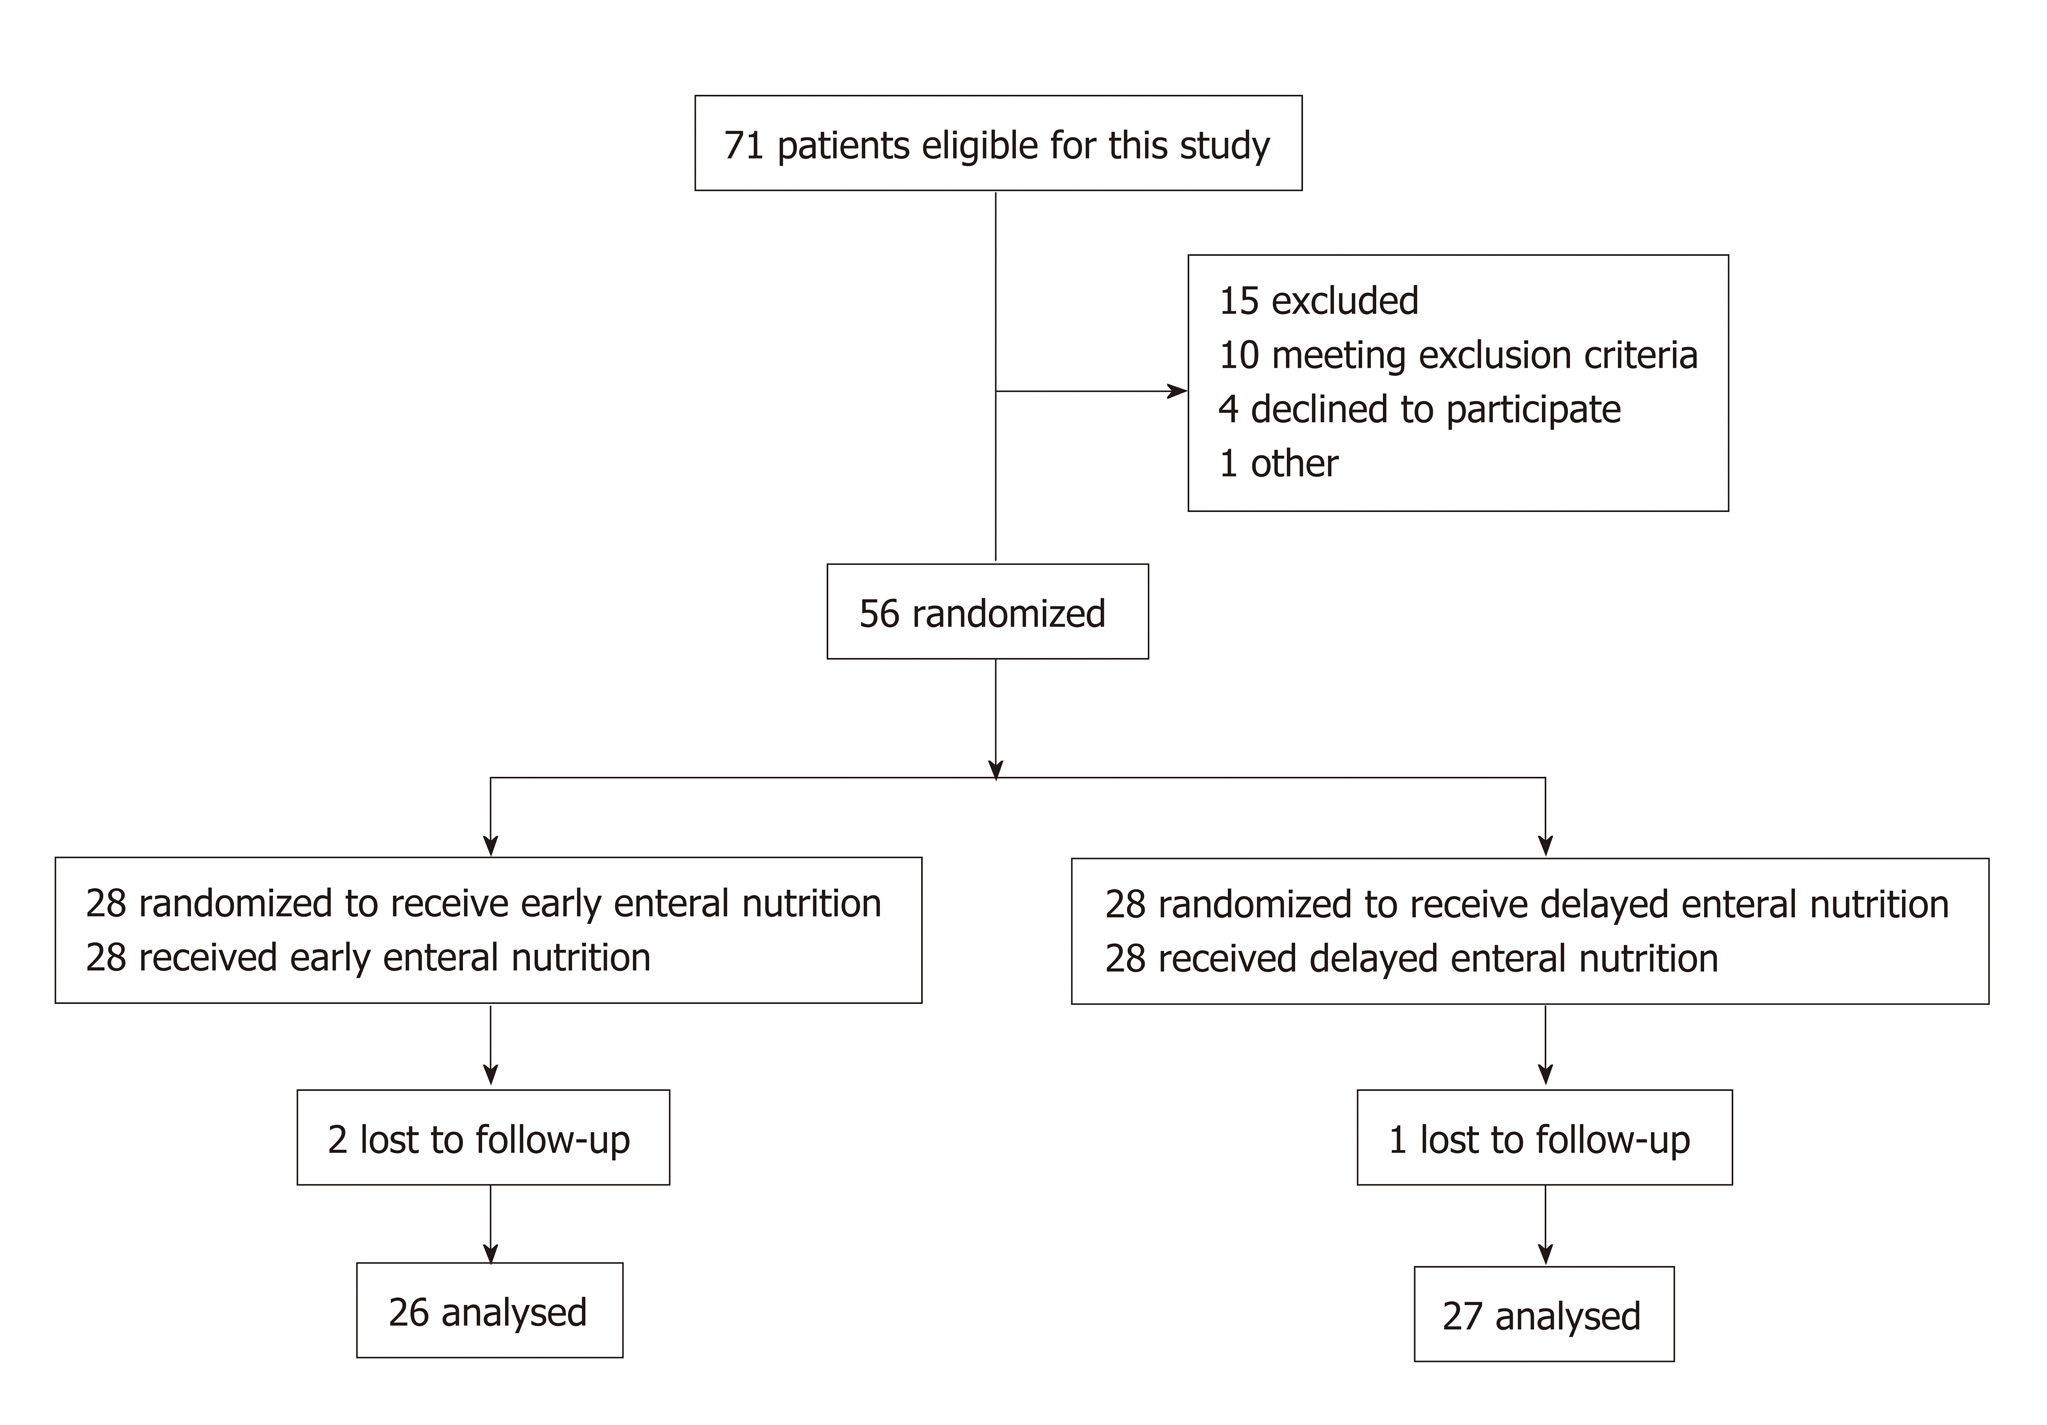
Figure 1 Flow diagram of the participants.
Figure 2 Difference in the Th17 and Treg lymphocyte percentages and the Th17/Treg cell ratios between the early enteral nutrition and delayed enteral nutrition groups.
A: Difference in the Th17 lymphocyte percentages between the early enteral nutrition (EEN) and delayed enteral nutrition (DEN) groups; B: Difference in the Treg lymphocyte percentages between the EEN and DEN groups; C: Differences in the Th17/Treg cell ratios between the EEN and DEN groups. aP < 0.05. EEN: Early enteral nutrition; DEN: Delayed enteral nutrition.
Figure 3 Difference in the serum IL-17 and IL-23 levels and the IL-23/IL-17 ratios between the early enteral nutrition and delayed enteral nutrition groups.
A: Difference in the serum IL-17 levels between the early enteral nutrition (EEN) and delayed enteral nutrition (DEN) groups; B: Difference in the serum IL-23 levels between the EEN and DEN groups; C: Difference in the IL-23/IL-17 ratios between the EEN and DEN groups. aP < 0.05. EEN: Early enteral nutrition; DEN: Delayed enteral nutrition.
Figure 4 Difference in the serum IL-6 and IL-10 levels between the early enteral nutrition and delayed enteral nutrition groups.
A: Difference in the serum IL-6 levels between the early enteral nutrition (EEN) and delayed enteral nutrition (DEN) groups; B: Difference in the serum IL-10 levels between the EEN and DEN groups. aP < 0.05. EEN: Early enteral nutrition; DEN: Delayed enteral nutrition.
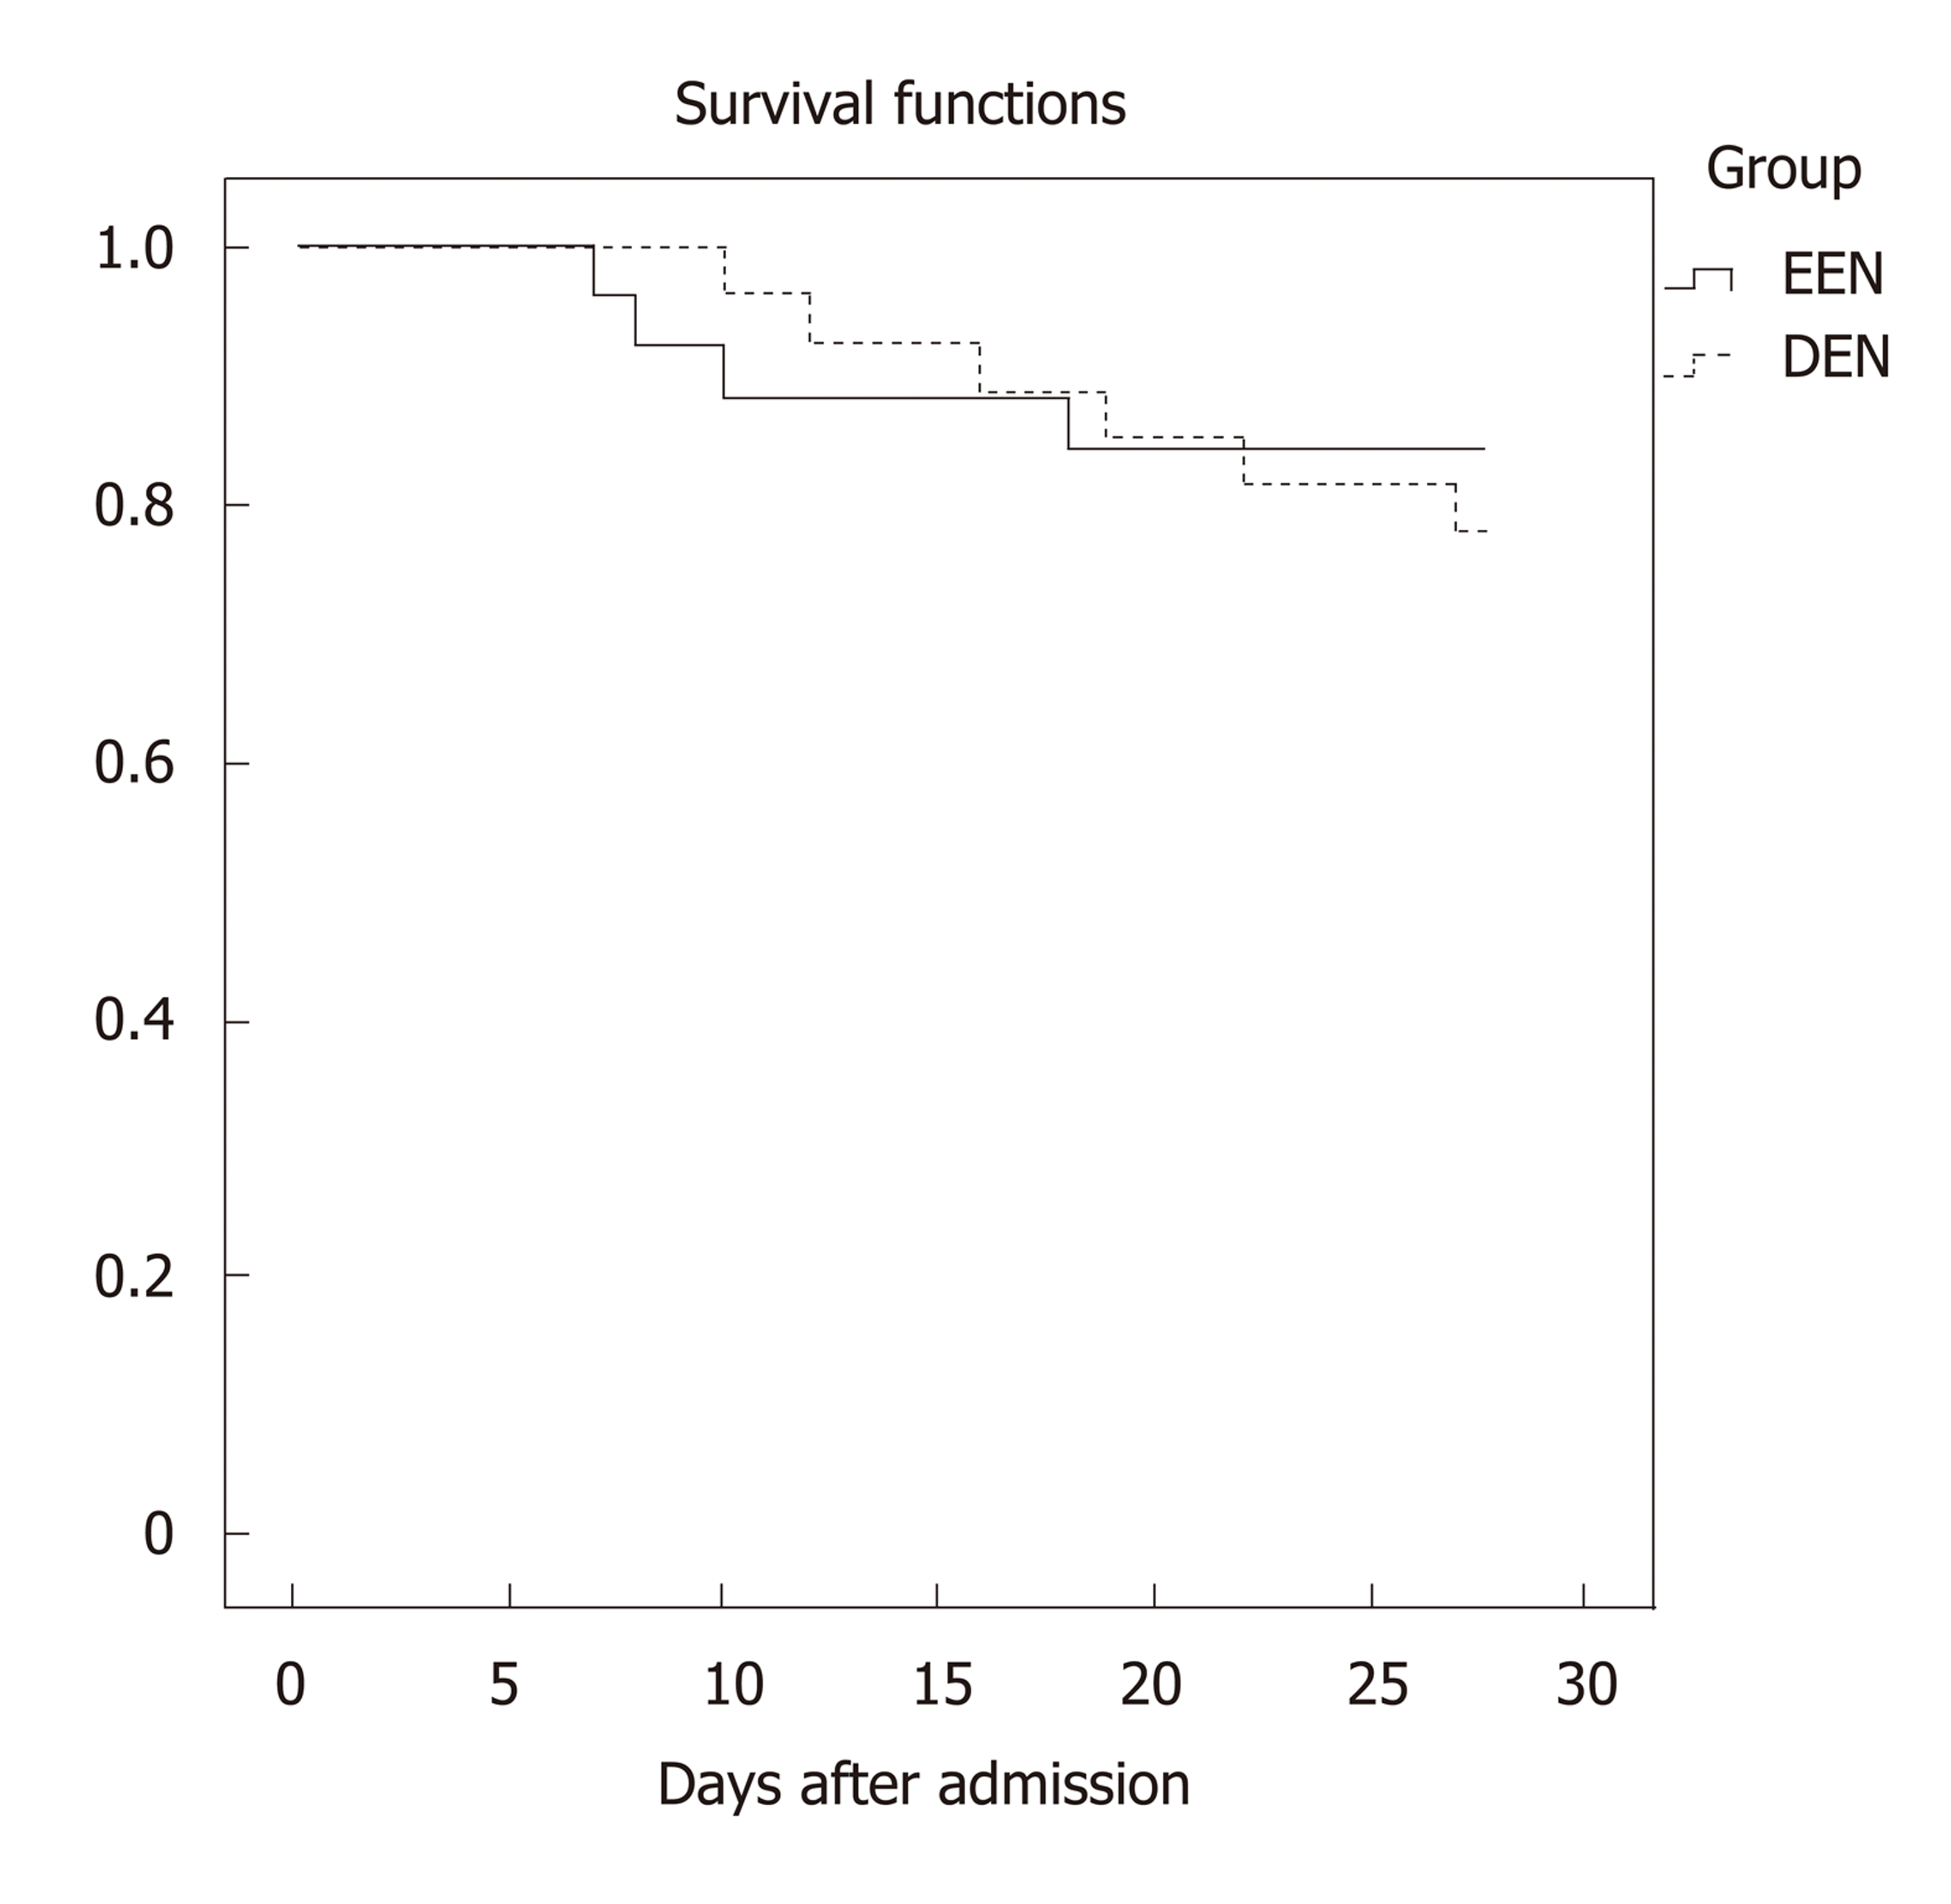
Figure 5 Survival curves for up to 28 days after admission between the early enteral nutrition and delayed enteral nutrition groups (P = 0.
728). EEN: Early enteral nutrition; DEN: Delayed enteral nutrition.
- Citation: Sun JK, Zhang WH, Chen WX, Wang X, Mu XW. Effects of early enteral nutrition on Th17/Treg cells and IL-23/IL-17 in septic patients. World J Gastroenterol 2019; 25(22): 2799-2808
- URL: https://www.wjgnet.com/1007-9327/full/v25/i22/2799.htm
- DOI: https://dx.doi.org/10.3748/wjg.v25.i22.2799


