Copyright
©The Author(s) 2019.
World J Gastroenterol. May 28, 2019; 25(20): 2402-2415
Published online May 28, 2019. doi: 10.3748/wjg.v25.i20.2402
Published online May 28, 2019. doi: 10.3748/wjg.v25.i20.2402
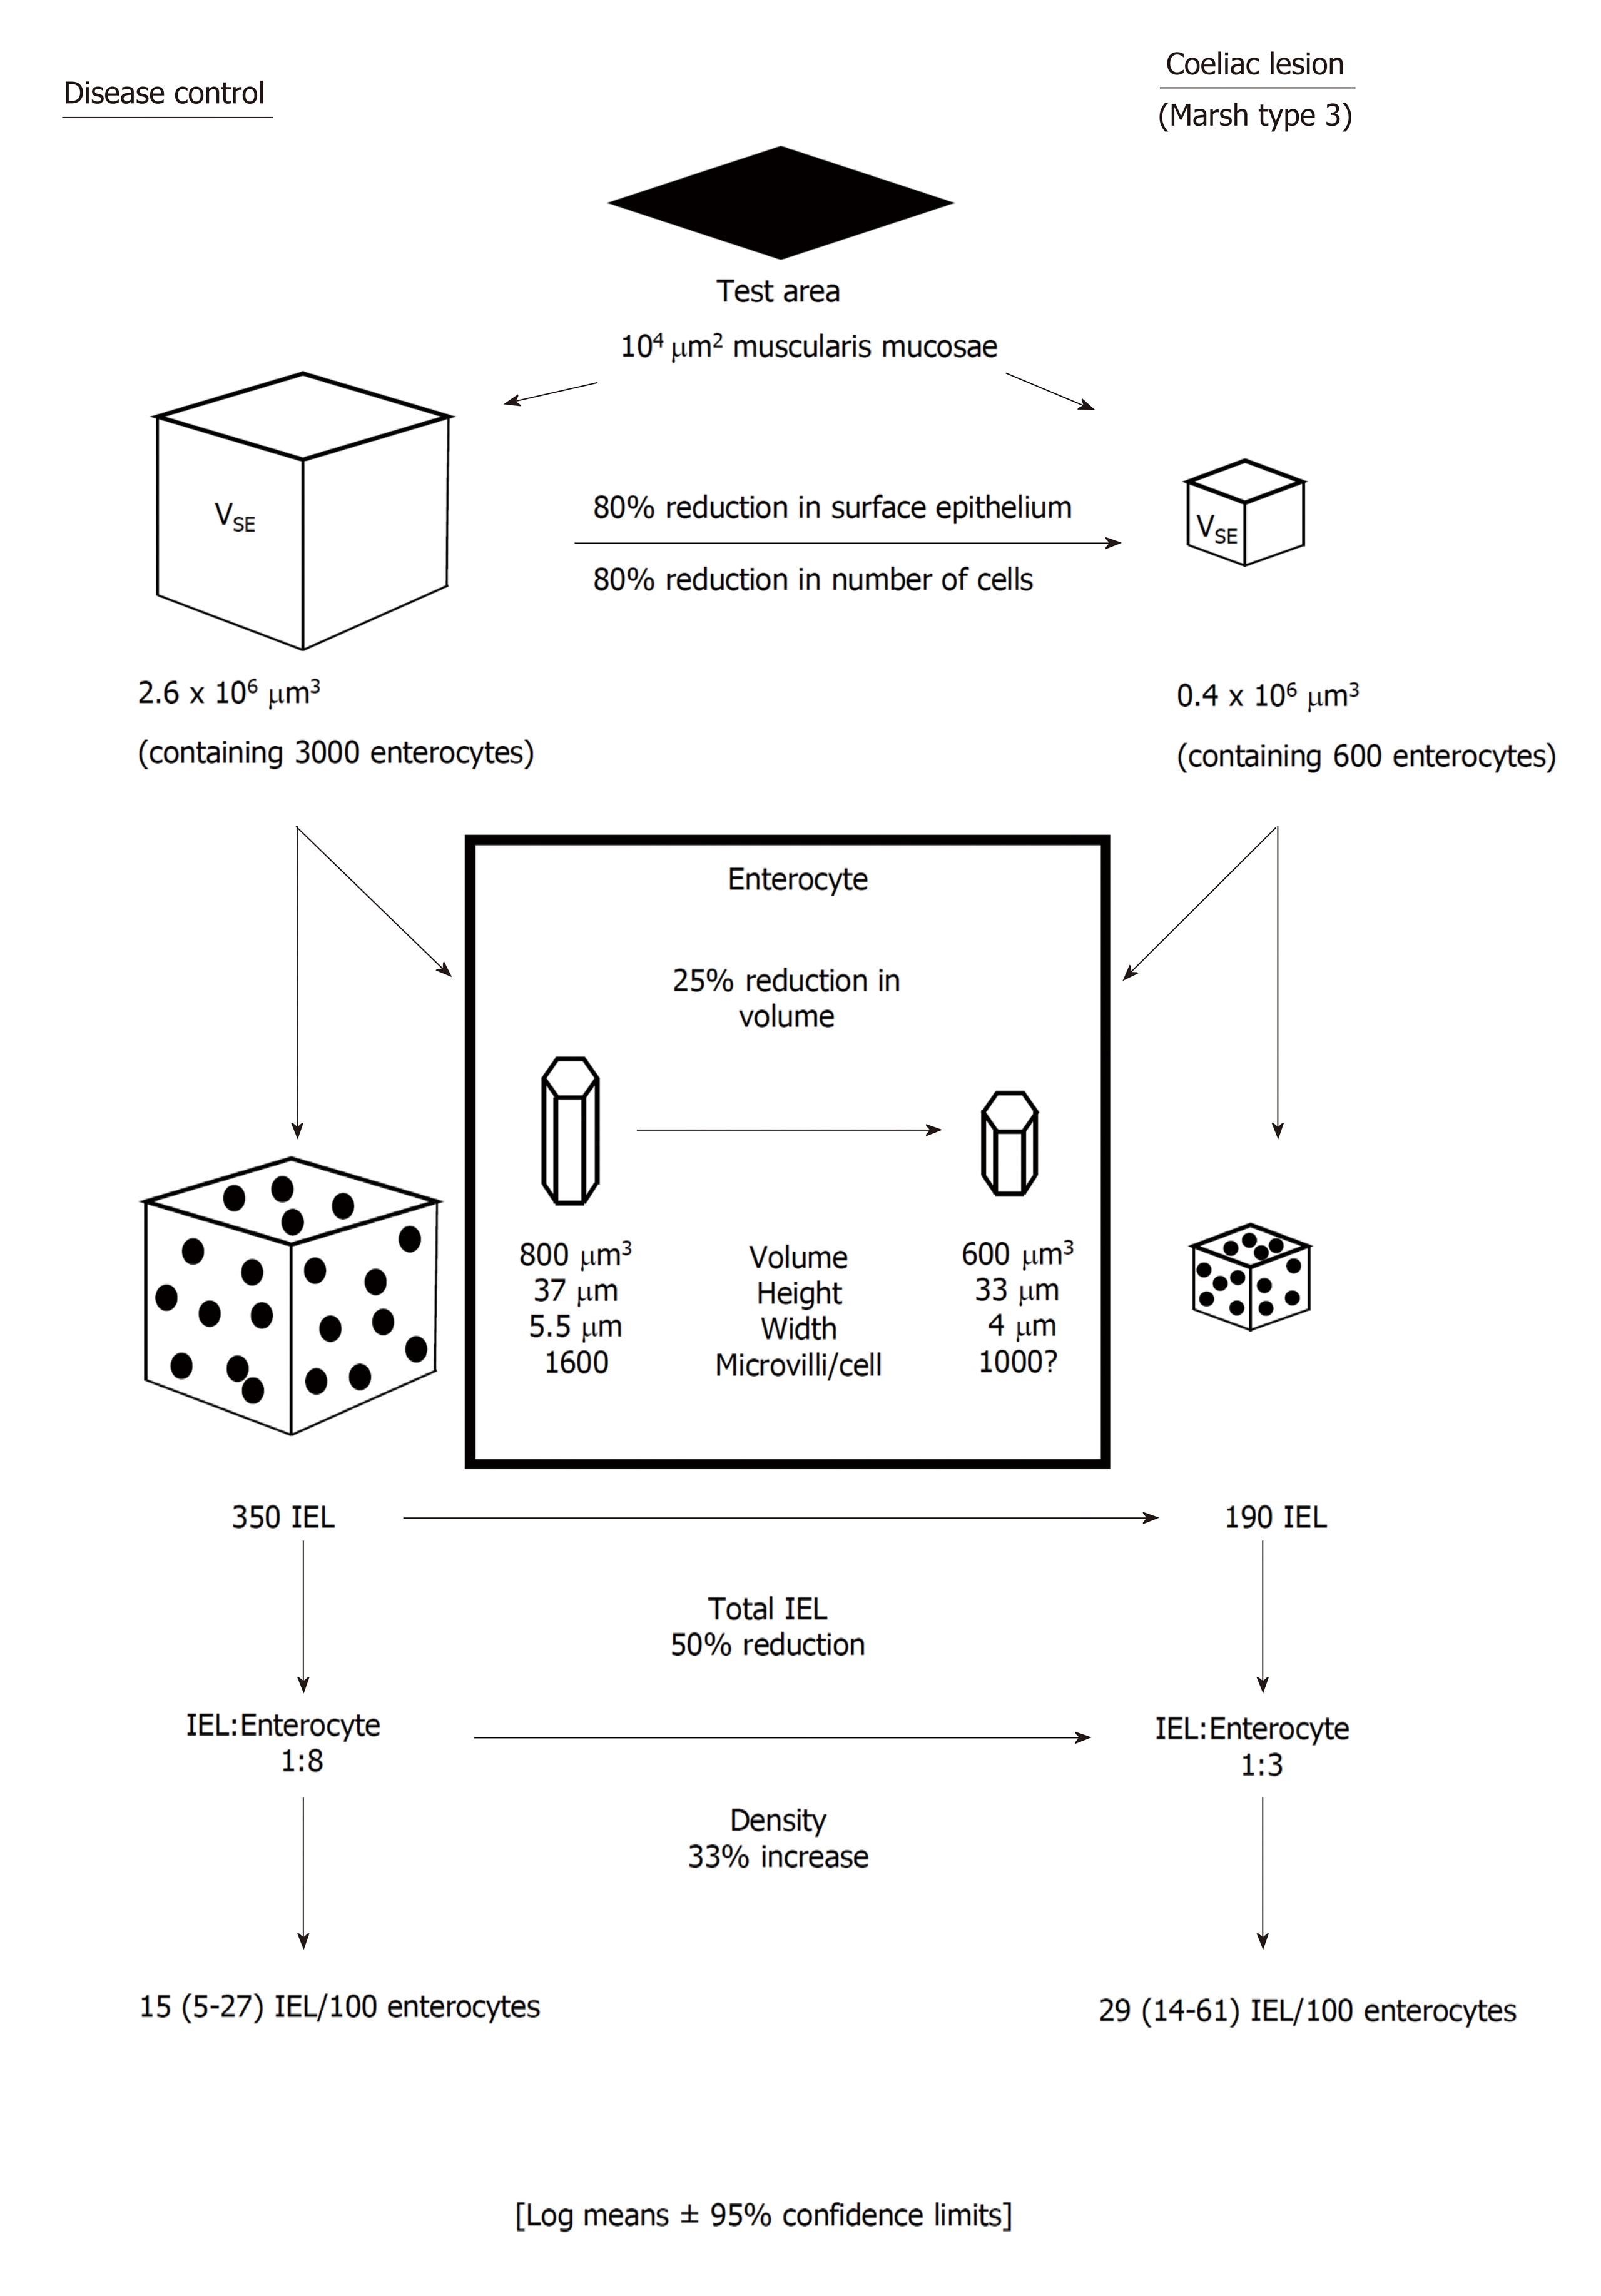
Figure 1 Defining the mucosa: from 2-D to 3-D.
This diagram briefly outlines the utility of computer-aided morphometric analysis of intestinal mucosa. Data are always dependent on an invariable reference (muscularis mucosae). Observations are also controlled with the use of "effective section thickness" and "quotients of accumulated means". IEL: Intraepithelial lymphocyte.
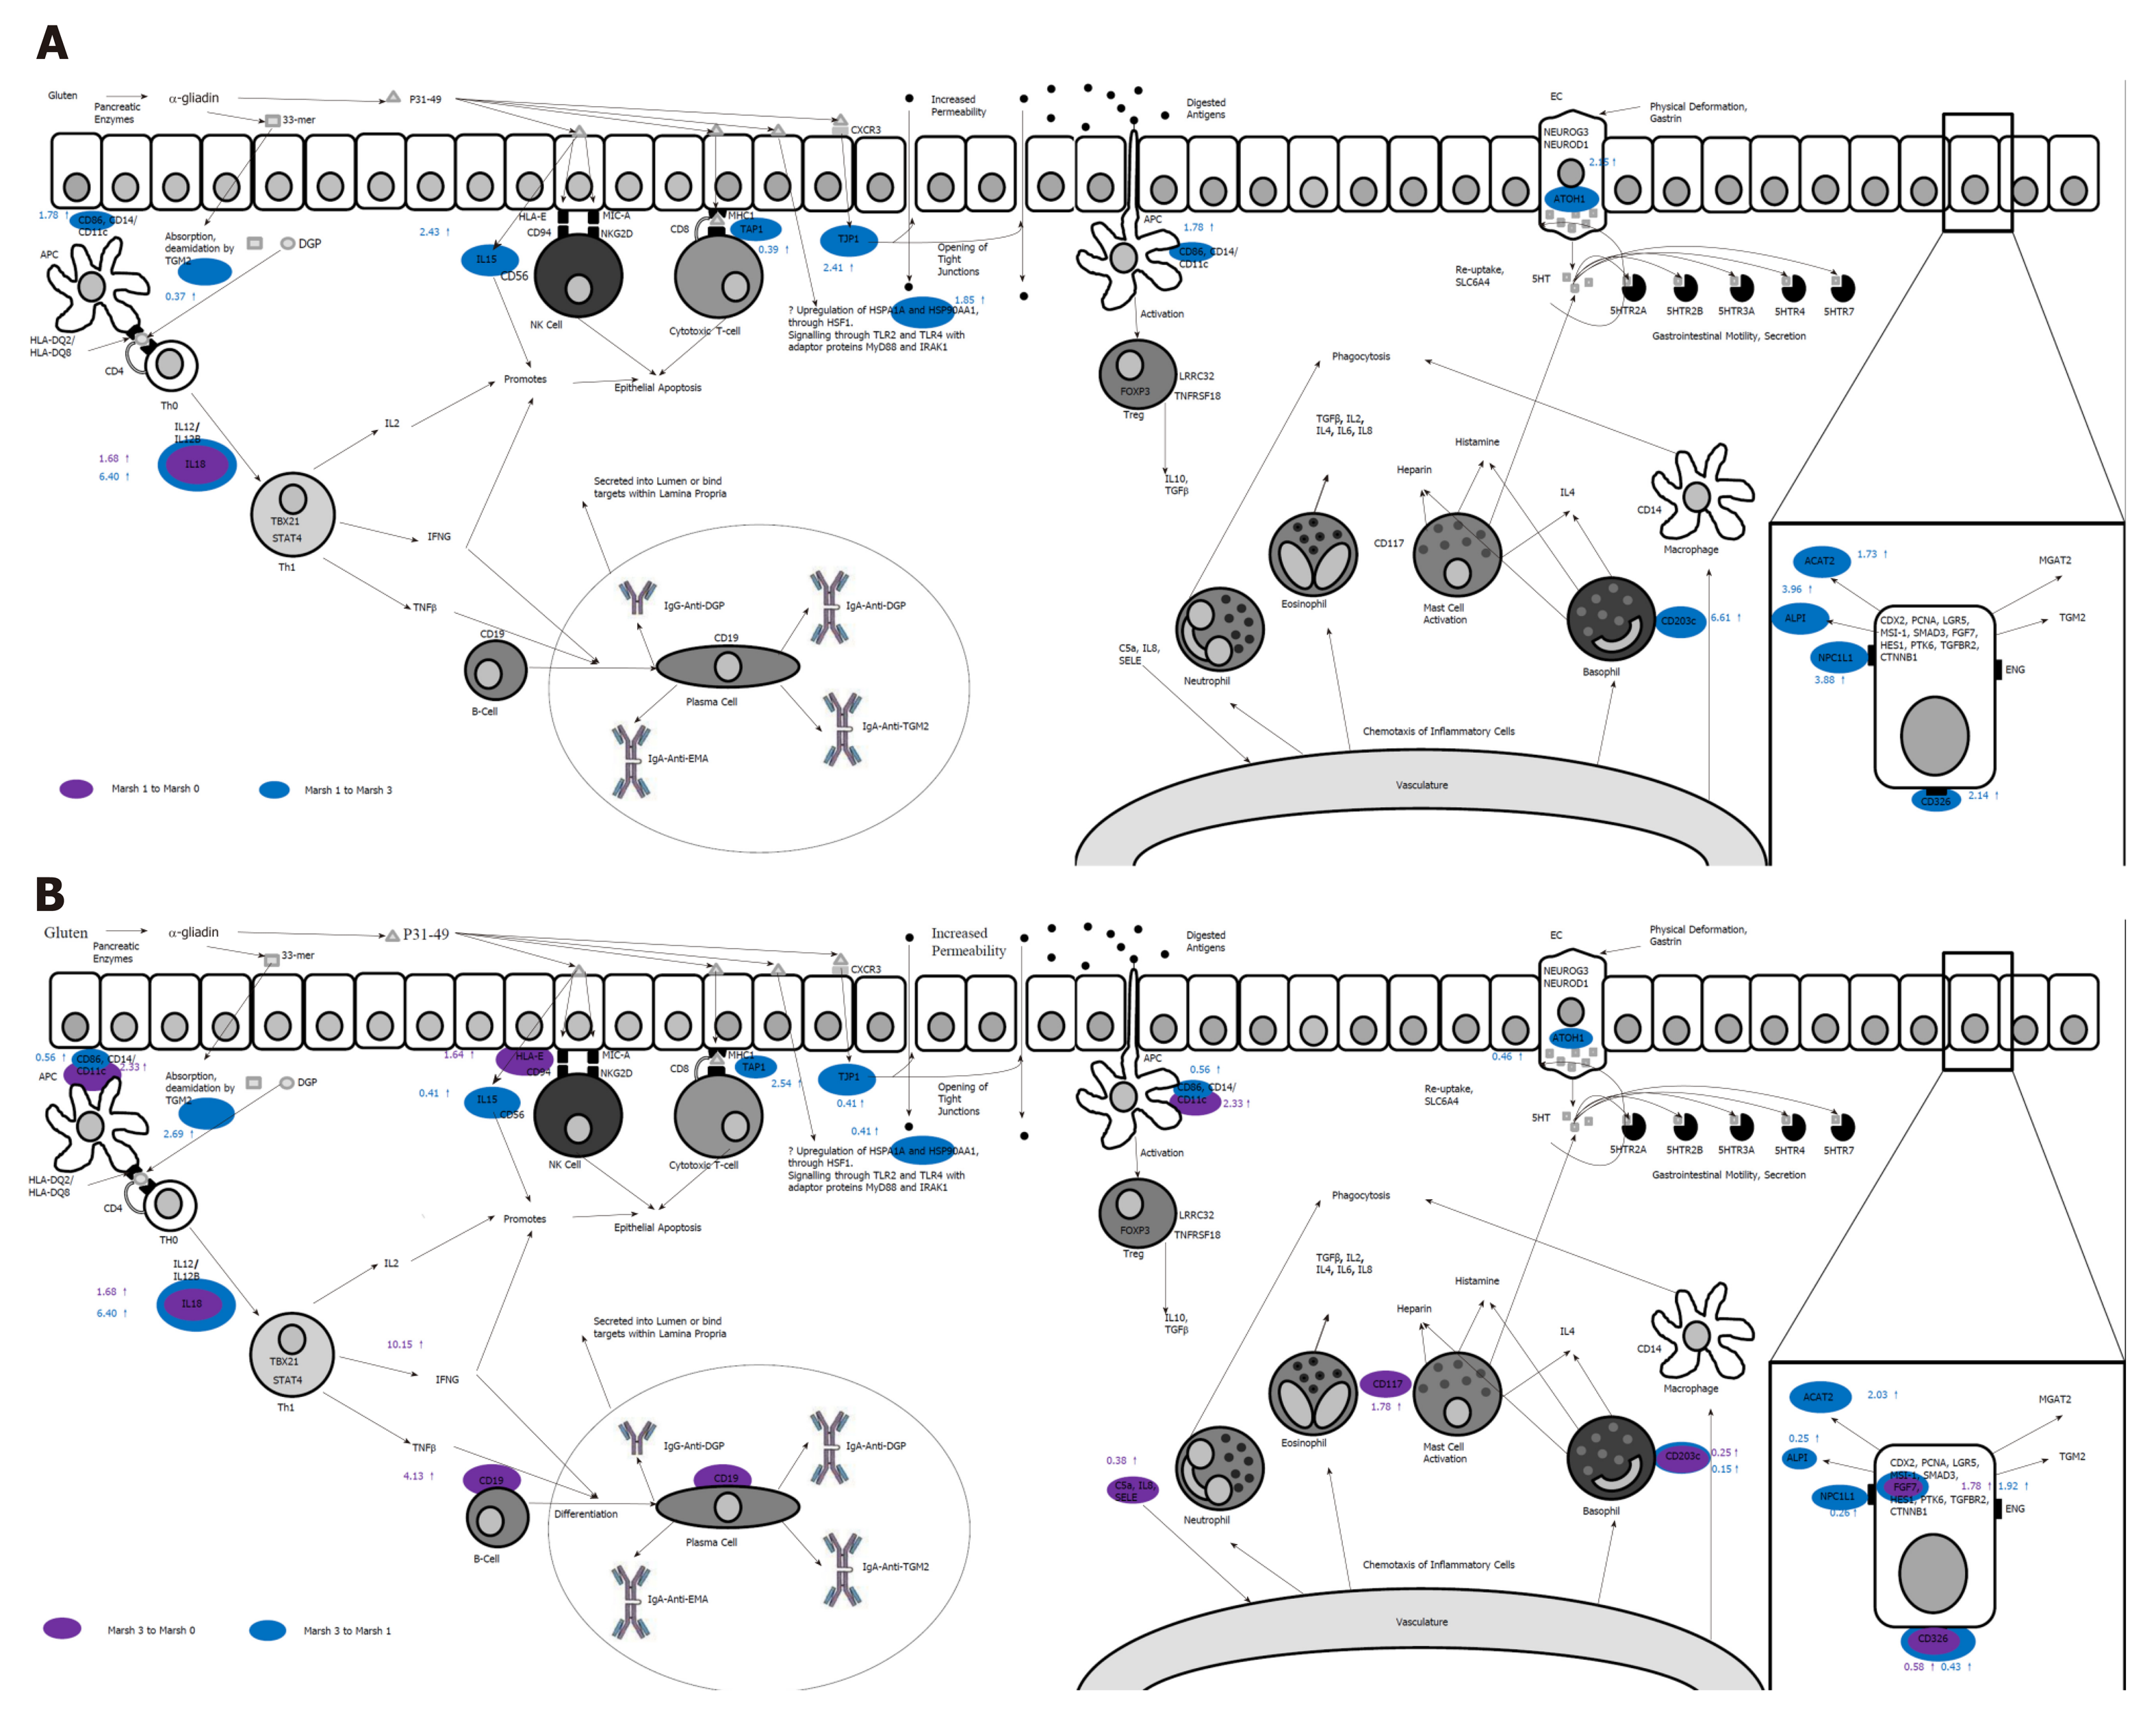
Figure 2 Comparative gene expression signatures of Marsh type 1 and Marsh type 3 coeliac mucosa.
This diagram shows the changes which occur in mRNA expression of key proteins involved in the immunopathology of coeliac disease. In Marsh type 1 mucosa (A), it can be seen that the expression of innate immune markers is activated first when compared to Marsh 0 and Marsh 3 tissue (purple and blue respectively), with an influx of basophils (CD203c), increased expression of IL18 and IL15, as well as increased expression of heat shock protein (HSPA1A). In Marsh type 3 mucosa (B), an adaptive immune response predominates with a Th1 immune reaction, with increased expression of IFNG and CD19 (B-cells). Numbers indicate fold-change gene expression between groups (i.e., Marsh type 1 compared to Marsh type 0), adapted from work presented in[60].
- Citation: Charlesworth RP, Marsh MN. From 2-dimensional to 3-dimensional: Overcoming dilemmas in intestinal mucosal interpretation. World J Gastroenterol 2019; 25(20): 2402-2415
- URL: https://www.wjgnet.com/1007-9327/full/v25/i20/2402.htm
- DOI: https://dx.doi.org/10.3748/wjg.v25.i20.2402


