Copyright
©The Author(s) 2019.
World J Gastroenterol. Jan 14, 2019; 25(2): 233-244
Published online Jan 14, 2019. doi: 10.3748/wjg.v25.i2.233
Published online Jan 14, 2019. doi: 10.3748/wjg.v25.i2.233
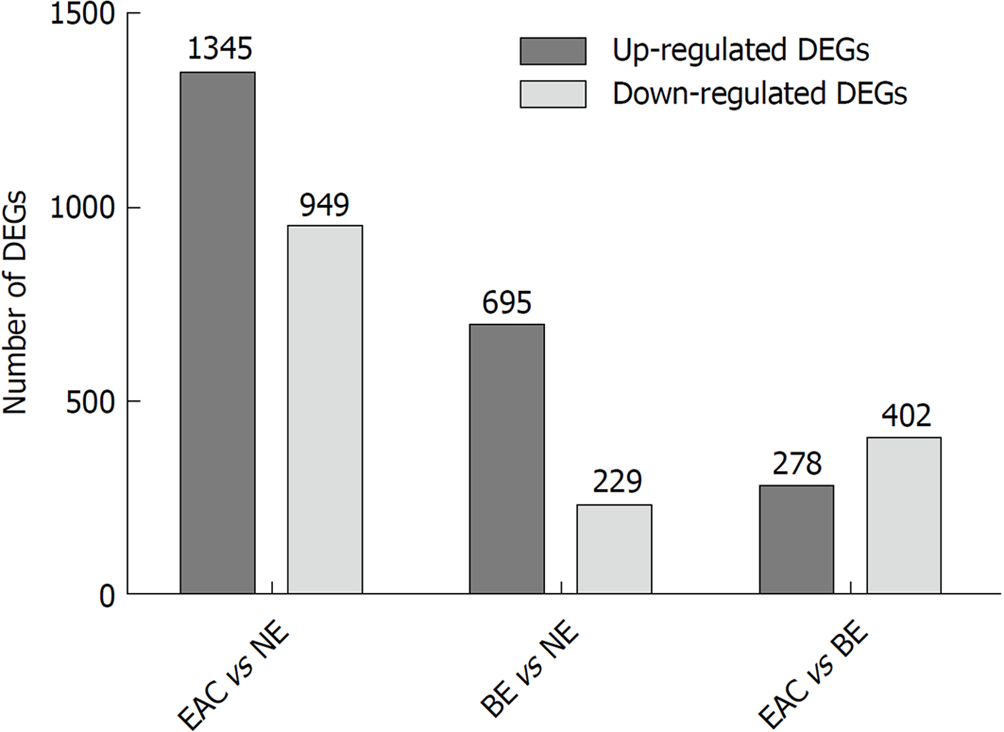
Figure 1 The numbers of differentially expressed genes in different comparison groups (esophageal adenocarcinoma vs normal esophagus, Barrett's esophagus vs normal esophagus, and esophageal adenocarcinoma vs Barrett's esophagus) in the GSE1420 dataset.
The GSE1420 dataset consists of three different groups [normal esophagus (NE), Barrett's esophagus (BE), and esophageal adenocarcinoma (EAC)]. The differentially expressed genes (DEGs) in different comparison groups (EAC vs NE, BE vs NE, and EAC vs BE) were identified using the R/Bioconductor software (|FC| > 1.5, P-values < 0.05), and the numbers of DEGs in different comparison groups were summarized.
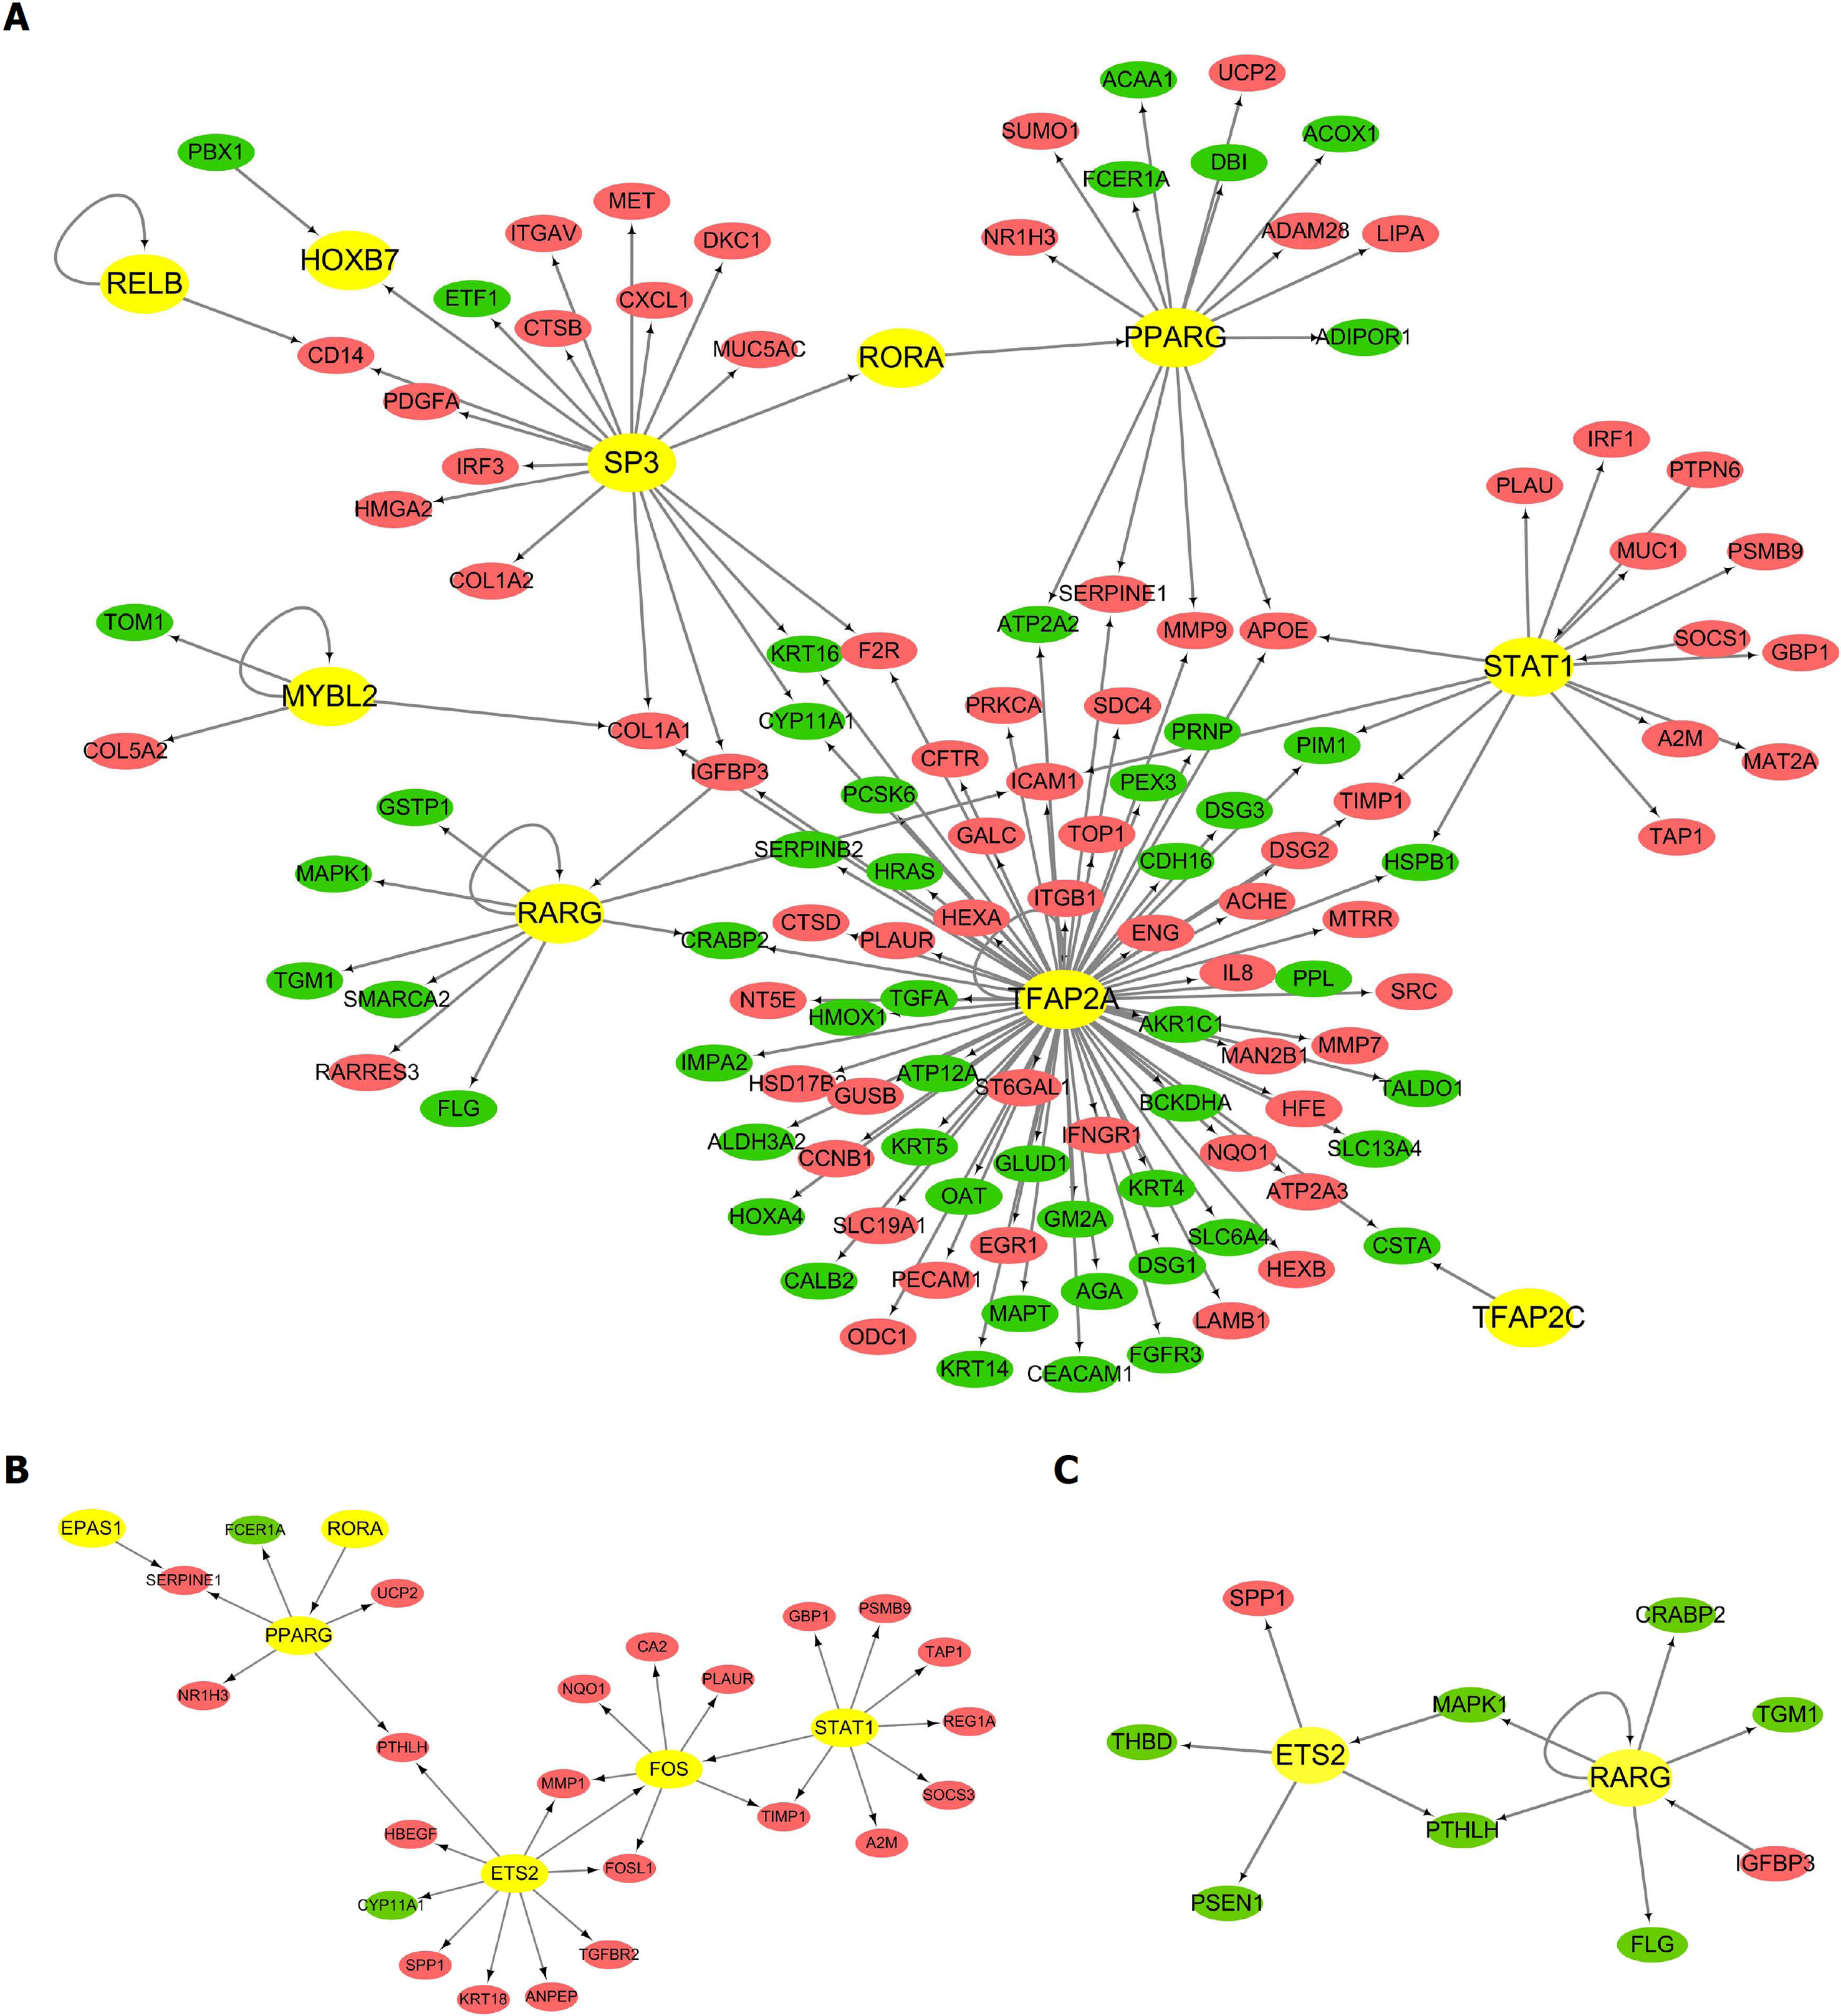
Figure 2 The trans-regulatory networks of differentially expressed transcription factors and their regulatory differentially expressed genes.
Circles represent the differentially expressed genes (DEGs) (red for up-regulated DEGs and green for down-regulated DEGs) regulated by the predicted transcription factor (TFs) (yellow for TFs). The direction of arrows is from the predicted TFs to their target DEGs. A: The trans-regulatory network of differentially expressed TFs and their regulatory DEGs in the comparison group of esophageal adenocarcinoma (EAC) vs normal esophagus (NE); B: The trans-regulatory network of differentially expressed TFs and their regulatory DEGs in the comparison group of Barrett's esophagus (BE) vs NE; C: The trans-regulatory network of differentially expressed TFs and their regulatory DEGs in the comparison group of EAC vs BE.
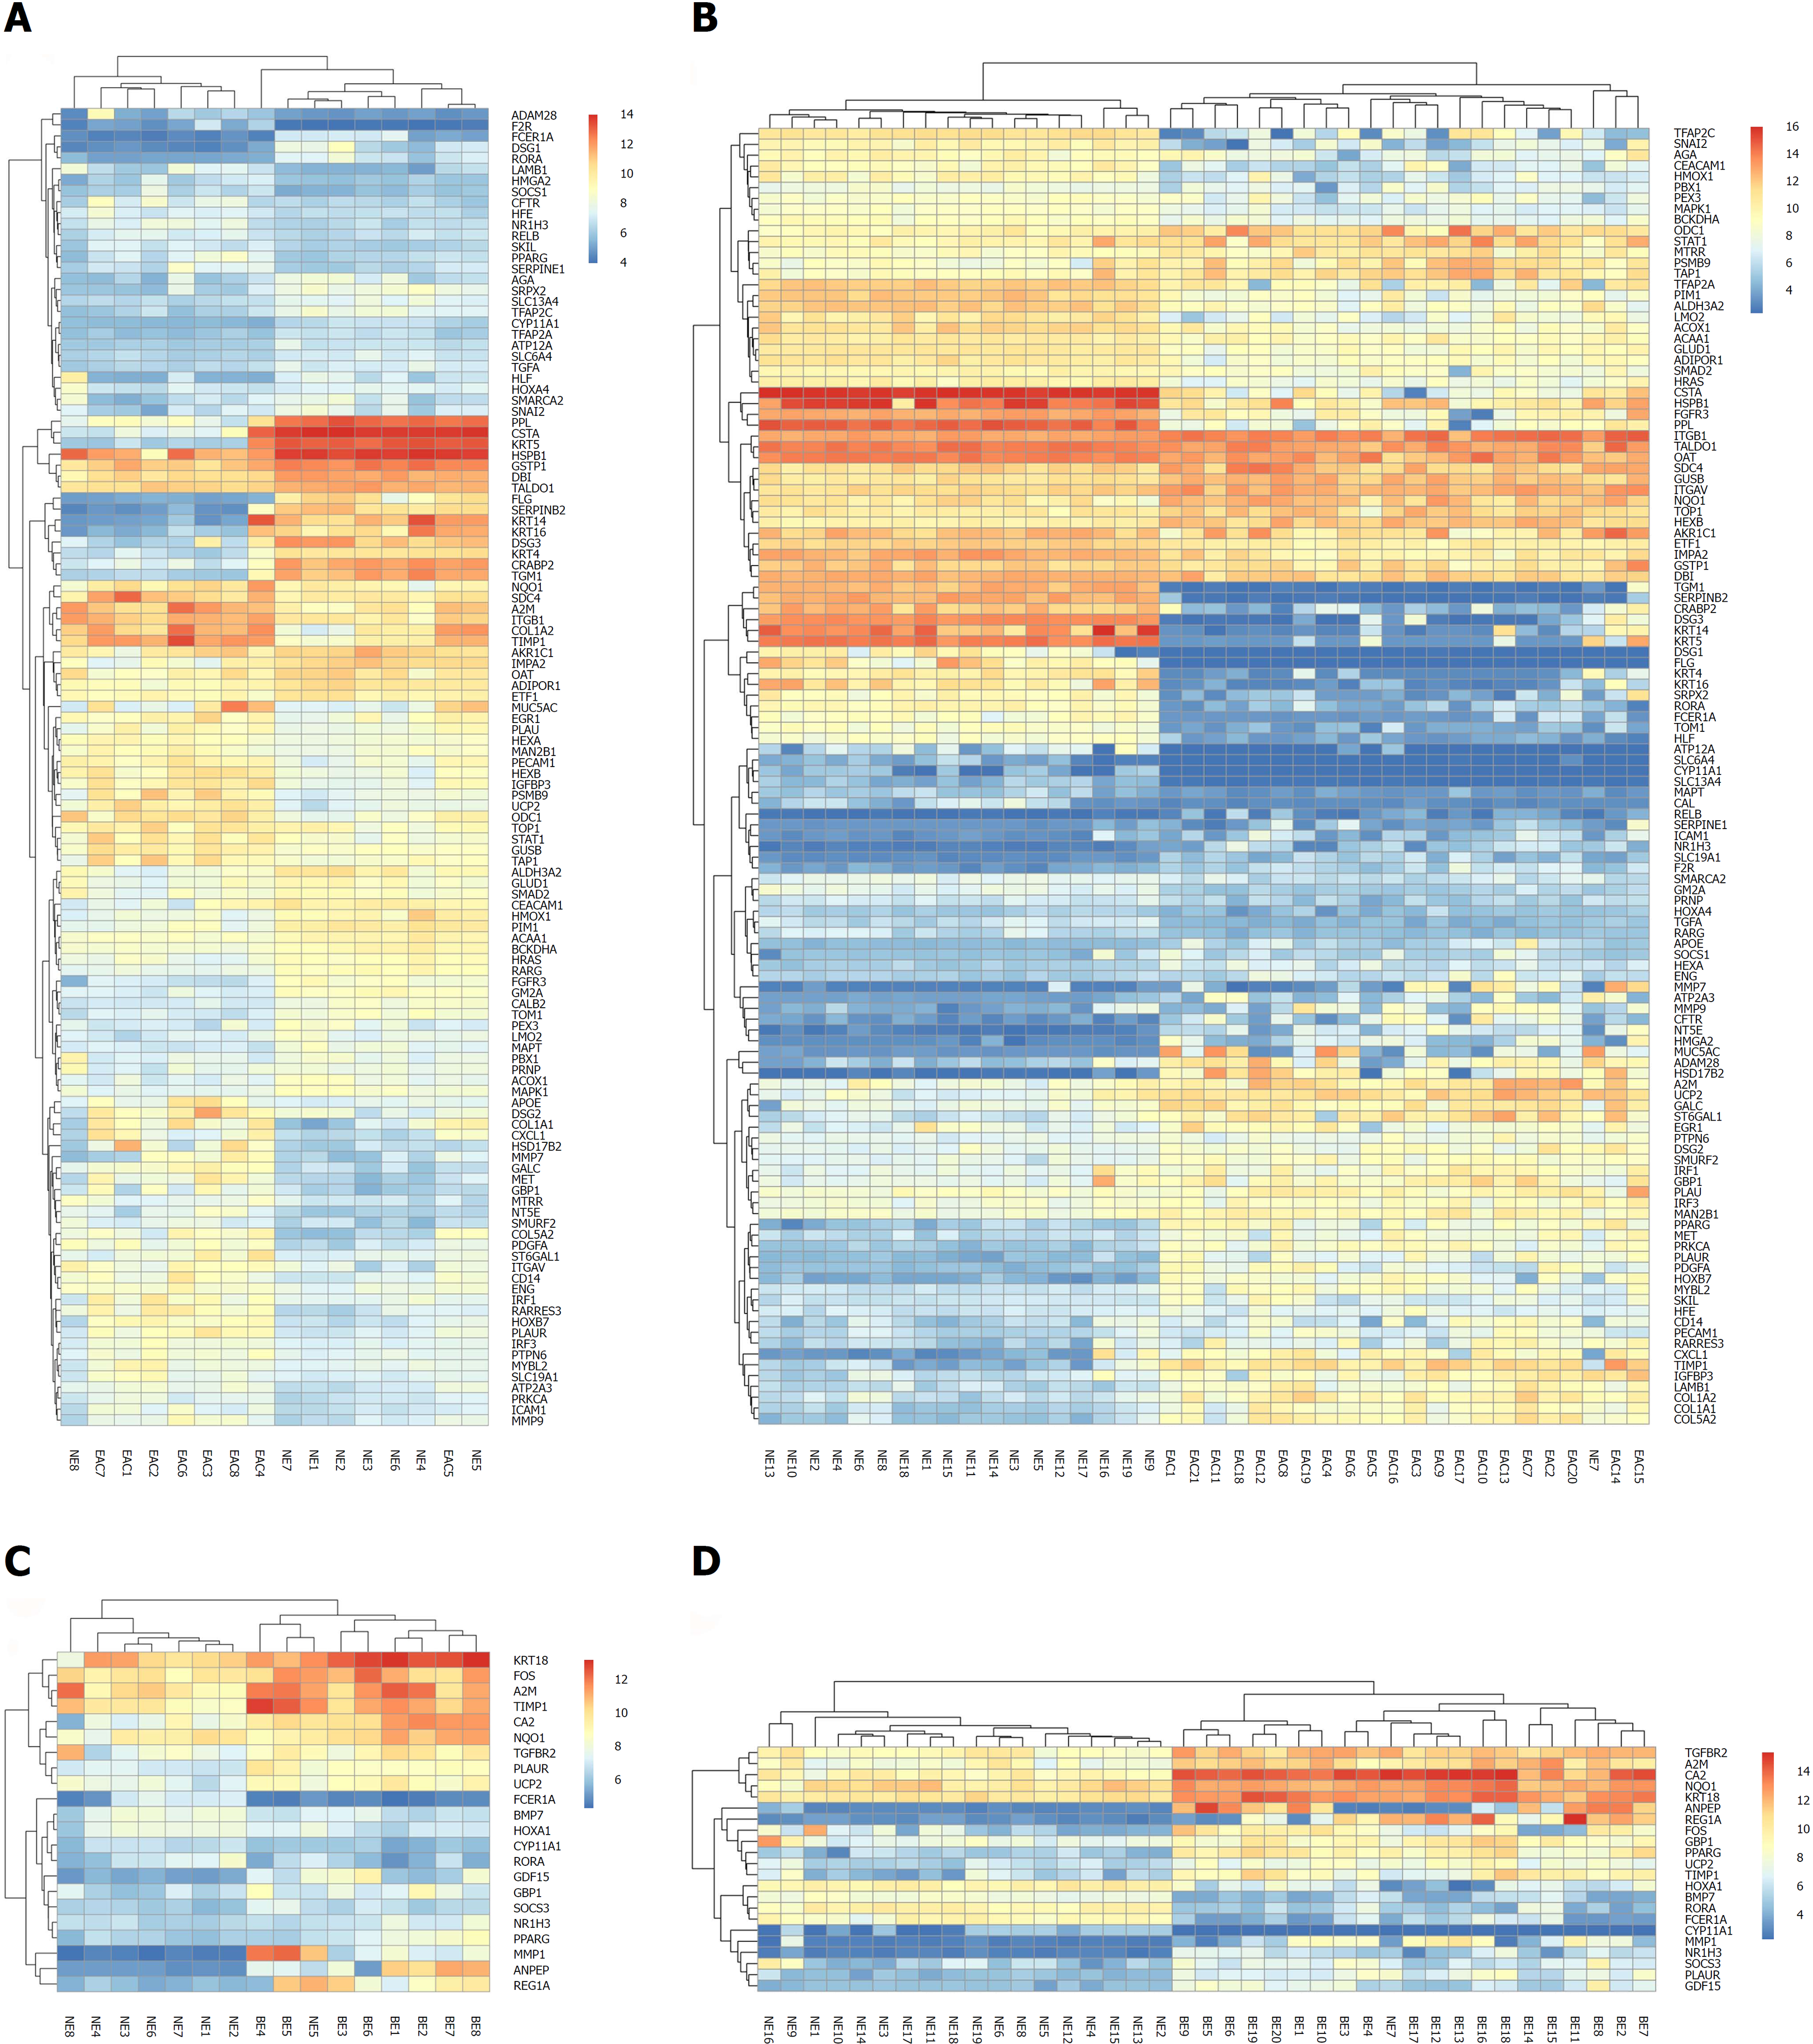
Figure 3 Bi-cluster analysis of the differentially expressed genes in the trans-regulatory networks existing in both the GSE1420 and GSE26886 datasets.
Each row represents one of the differentially expressed genes (DEGs) in the trans-regulatory networks, and each column represents a tissue sample from the two datasets (GSE1420 and GSE26886). The column “normal esophagus (NE)” represents normal esophagus tissue, the column “Barrett's esophagus (BE)” represents Barrett's esophagus tissue, and the column “esophageal adenocarcinoma (EAC)” represents tissue from esophageal adenocarcinoma. The heat map was constructed using each DEG expression value in every tissue sample. A: The heat map for the comparison group of EAC vs. NE in the GSE1420 dataset; B: The heat map for the comparison group of EAC vs NE in the GSE26886 dataset; C: The heat map for the comparison group of BE vs NE in the GSE1420 dataset; D: The heat map for the comparison group of BE vs NE in the GSE26886 dataset.
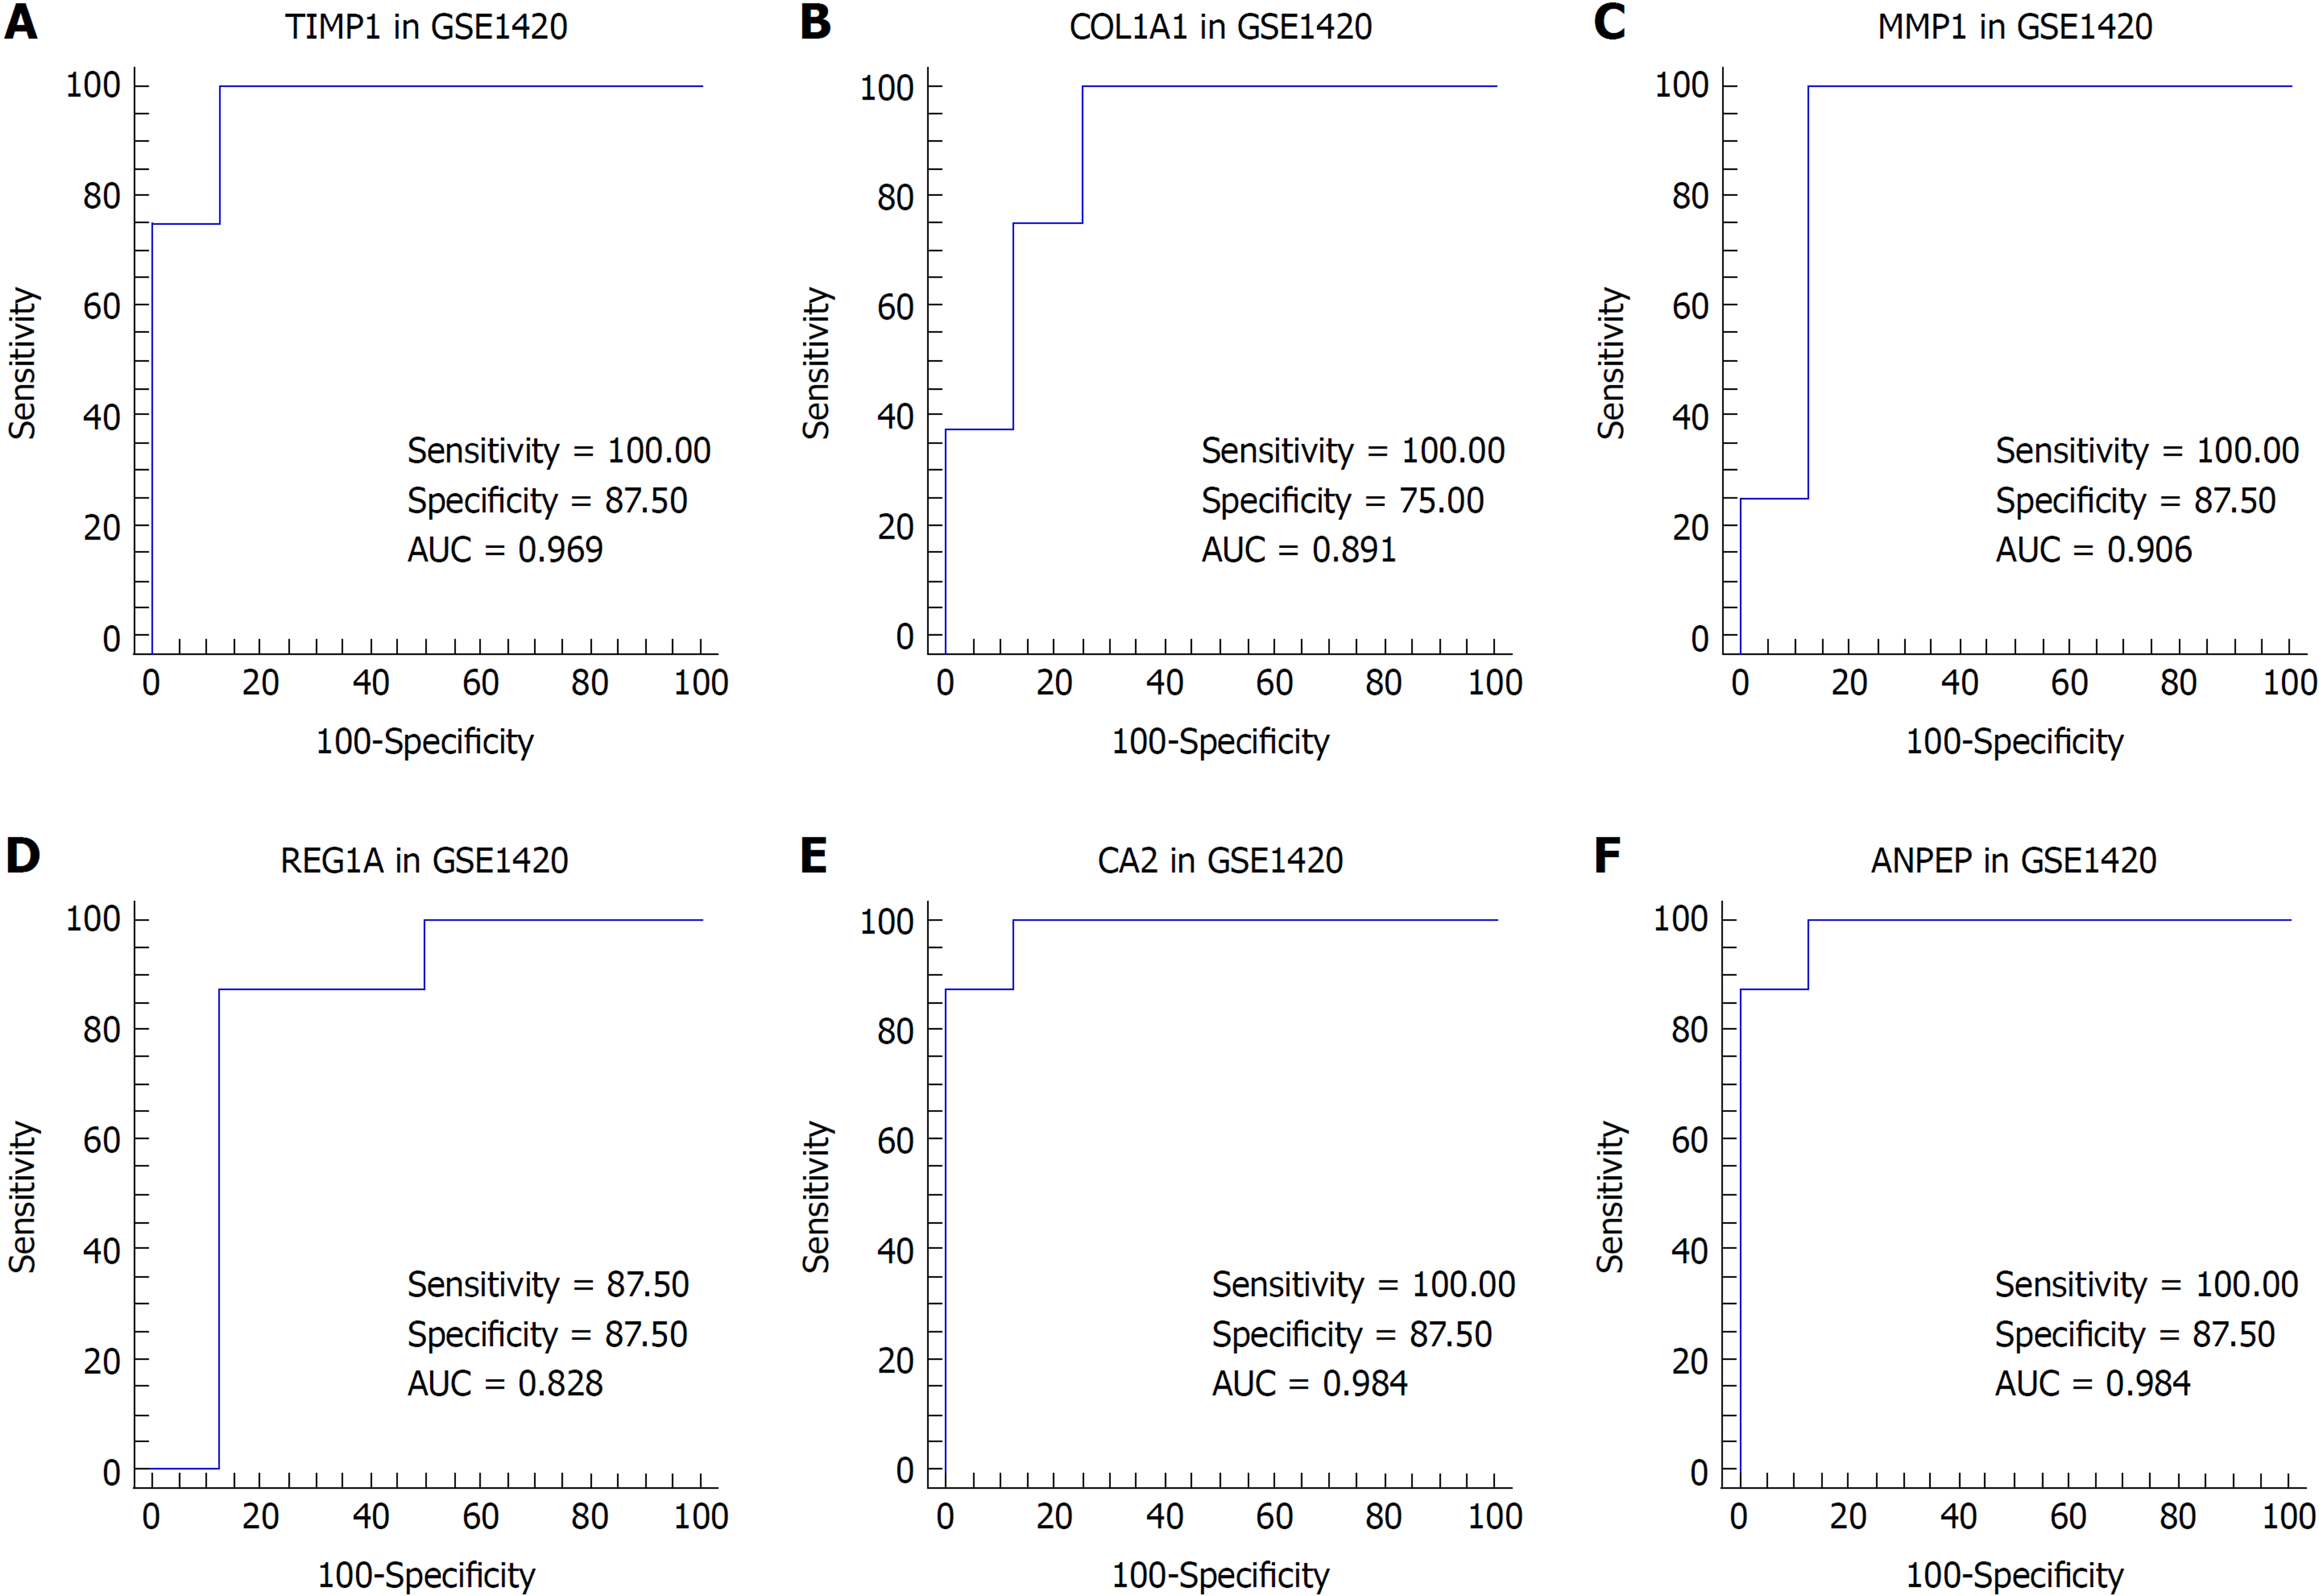
Figure 4 Receiver operating characteristic curve analysis for tissue discrimination between esophageal adenocarcinoma vs normal esophagus and Barrett's esophagus vs normal esophagus in the GSE1420 dataset.
A: Receiver operating characteristic (ROC) curve of TIMP1; B: ROC curve of COL1A1; C: ROC curve of MMP1; D: ROC curve of REG1A; E: ROC curve of CA2; F: ROC curve of ANPEP.
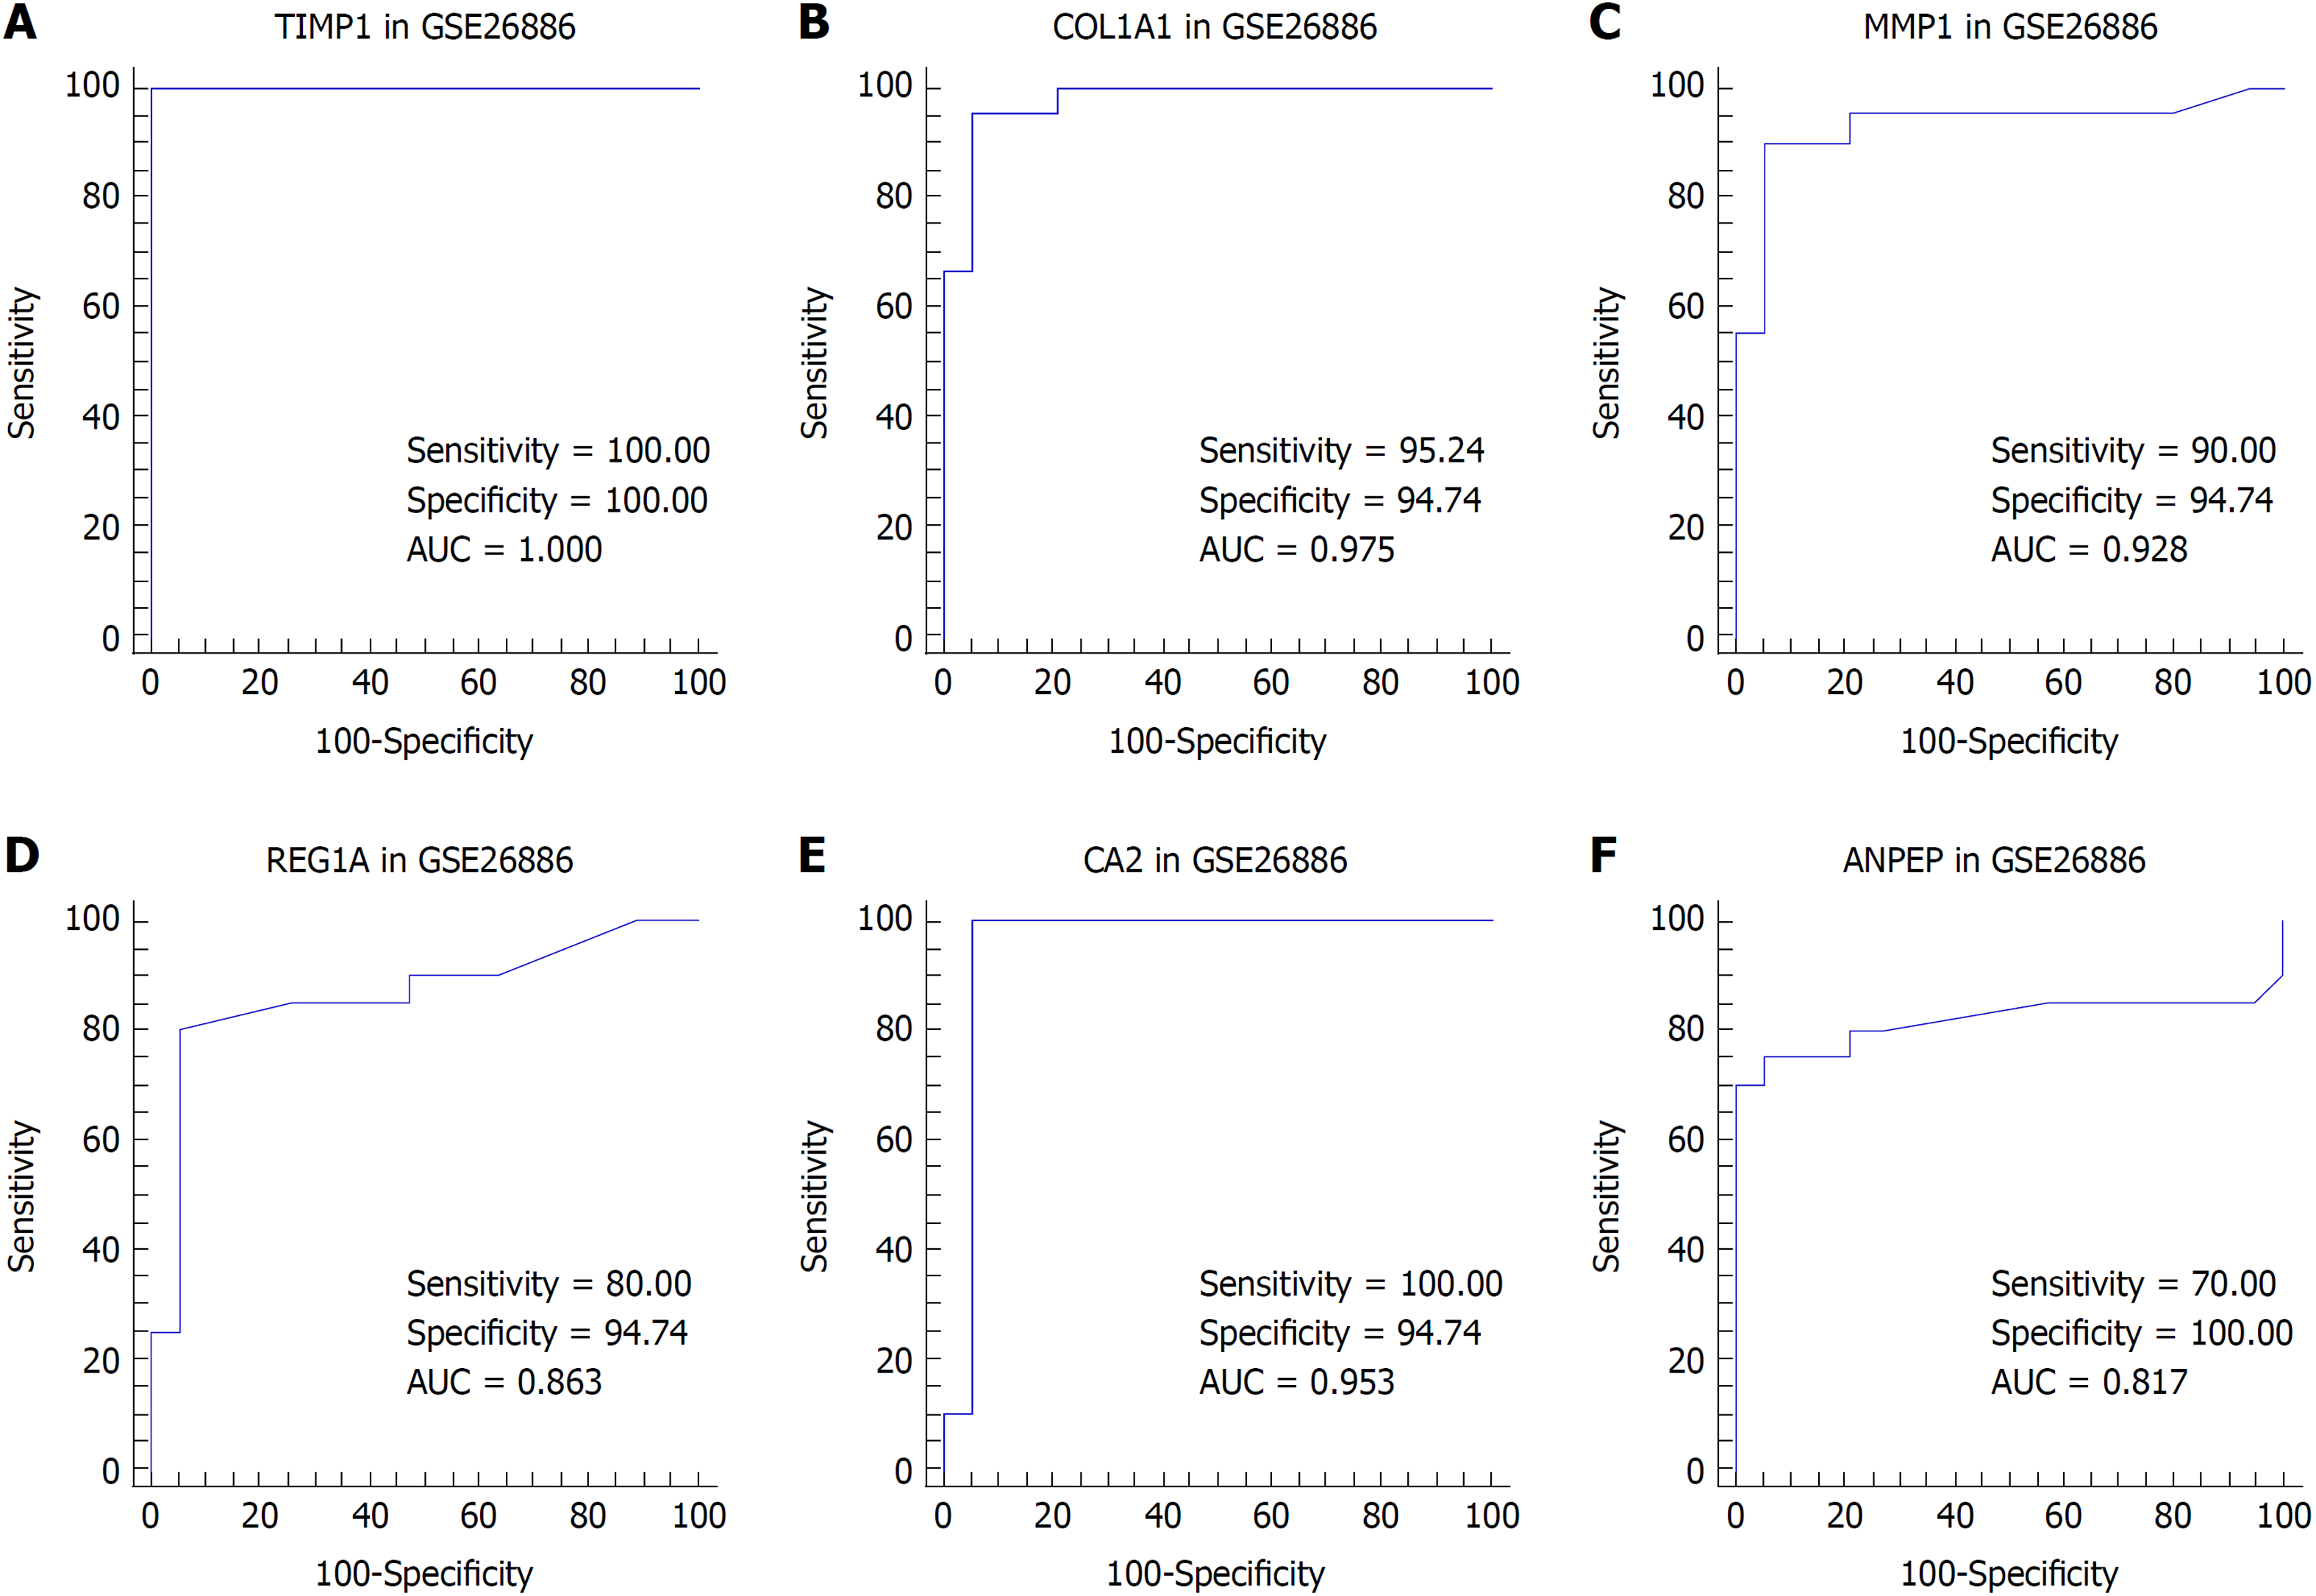
Figure 5 Receiver operating characteristic analysis for tissue discrimination between esophageal adenocarcinoma vs normal esophagus and Barrett's esophagus vs normal esophagus in the GSE26886 dataset.
A: Receiver operating characteristic (ROC) curve of TIMP1; B: ROC curve of COL1A1; C: ROC curve of MMP1; D: ROC curve of REG1A; E: ROC curve of CA2; F: ROC curve of ANPEP.
- Citation: Lv J, Guo L, Wang JH, Yan YZ, Zhang J, Wang YY, Yu Y, Huang YF, Zhao HP. Biomarker identification and trans-regulatory network analyses in esophageal adenocarcinoma and Barrett’s esophagus. World J Gastroenterol 2019; 25(2): 233-244
- URL: https://www.wjgnet.com/1007-9327/full/v25/i2/233.htm
- DOI: https://dx.doi.org/10.3748/wjg.v25.i2.233


