Copyright
©The Author(s) 2019.
World J Gastroenterol. May 21, 2019; 25(19): 2383-2401
Published online May 21, 2019. doi: 10.3748/wjg.v25.i19.2383
Published online May 21, 2019. doi: 10.3748/wjg.v25.i19.2383
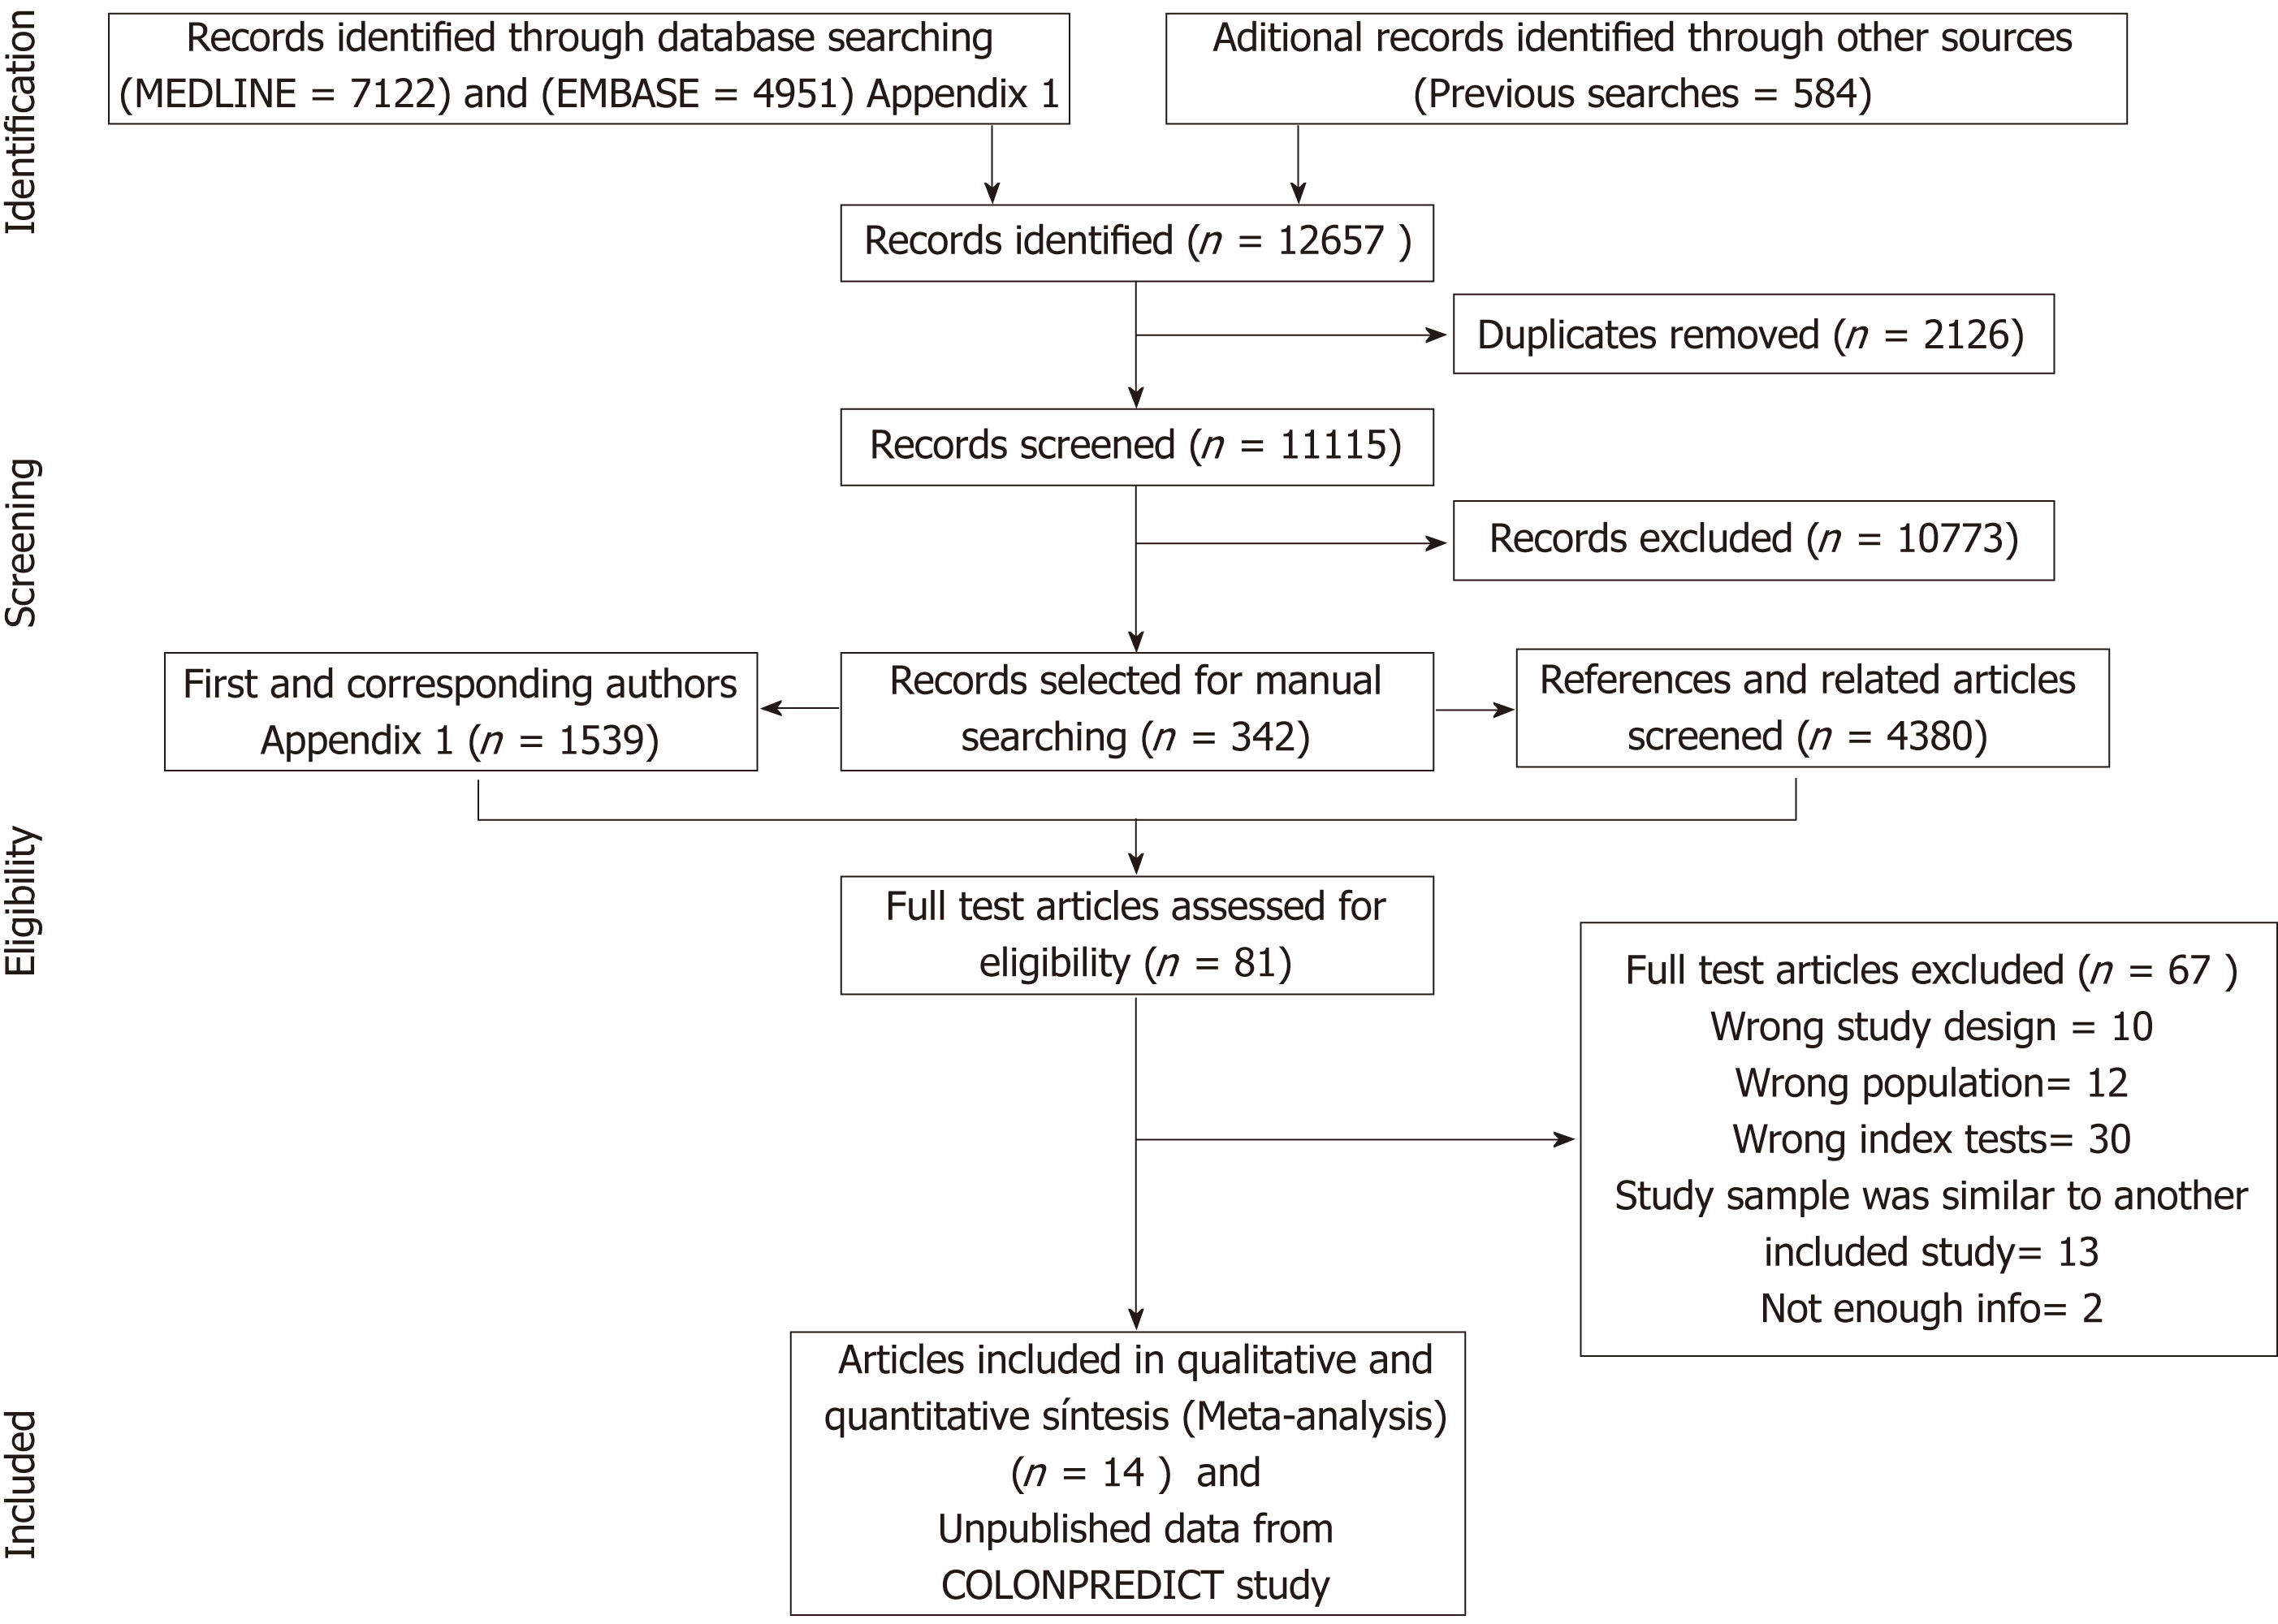
Figure 1 Summary of evidence search and selection.
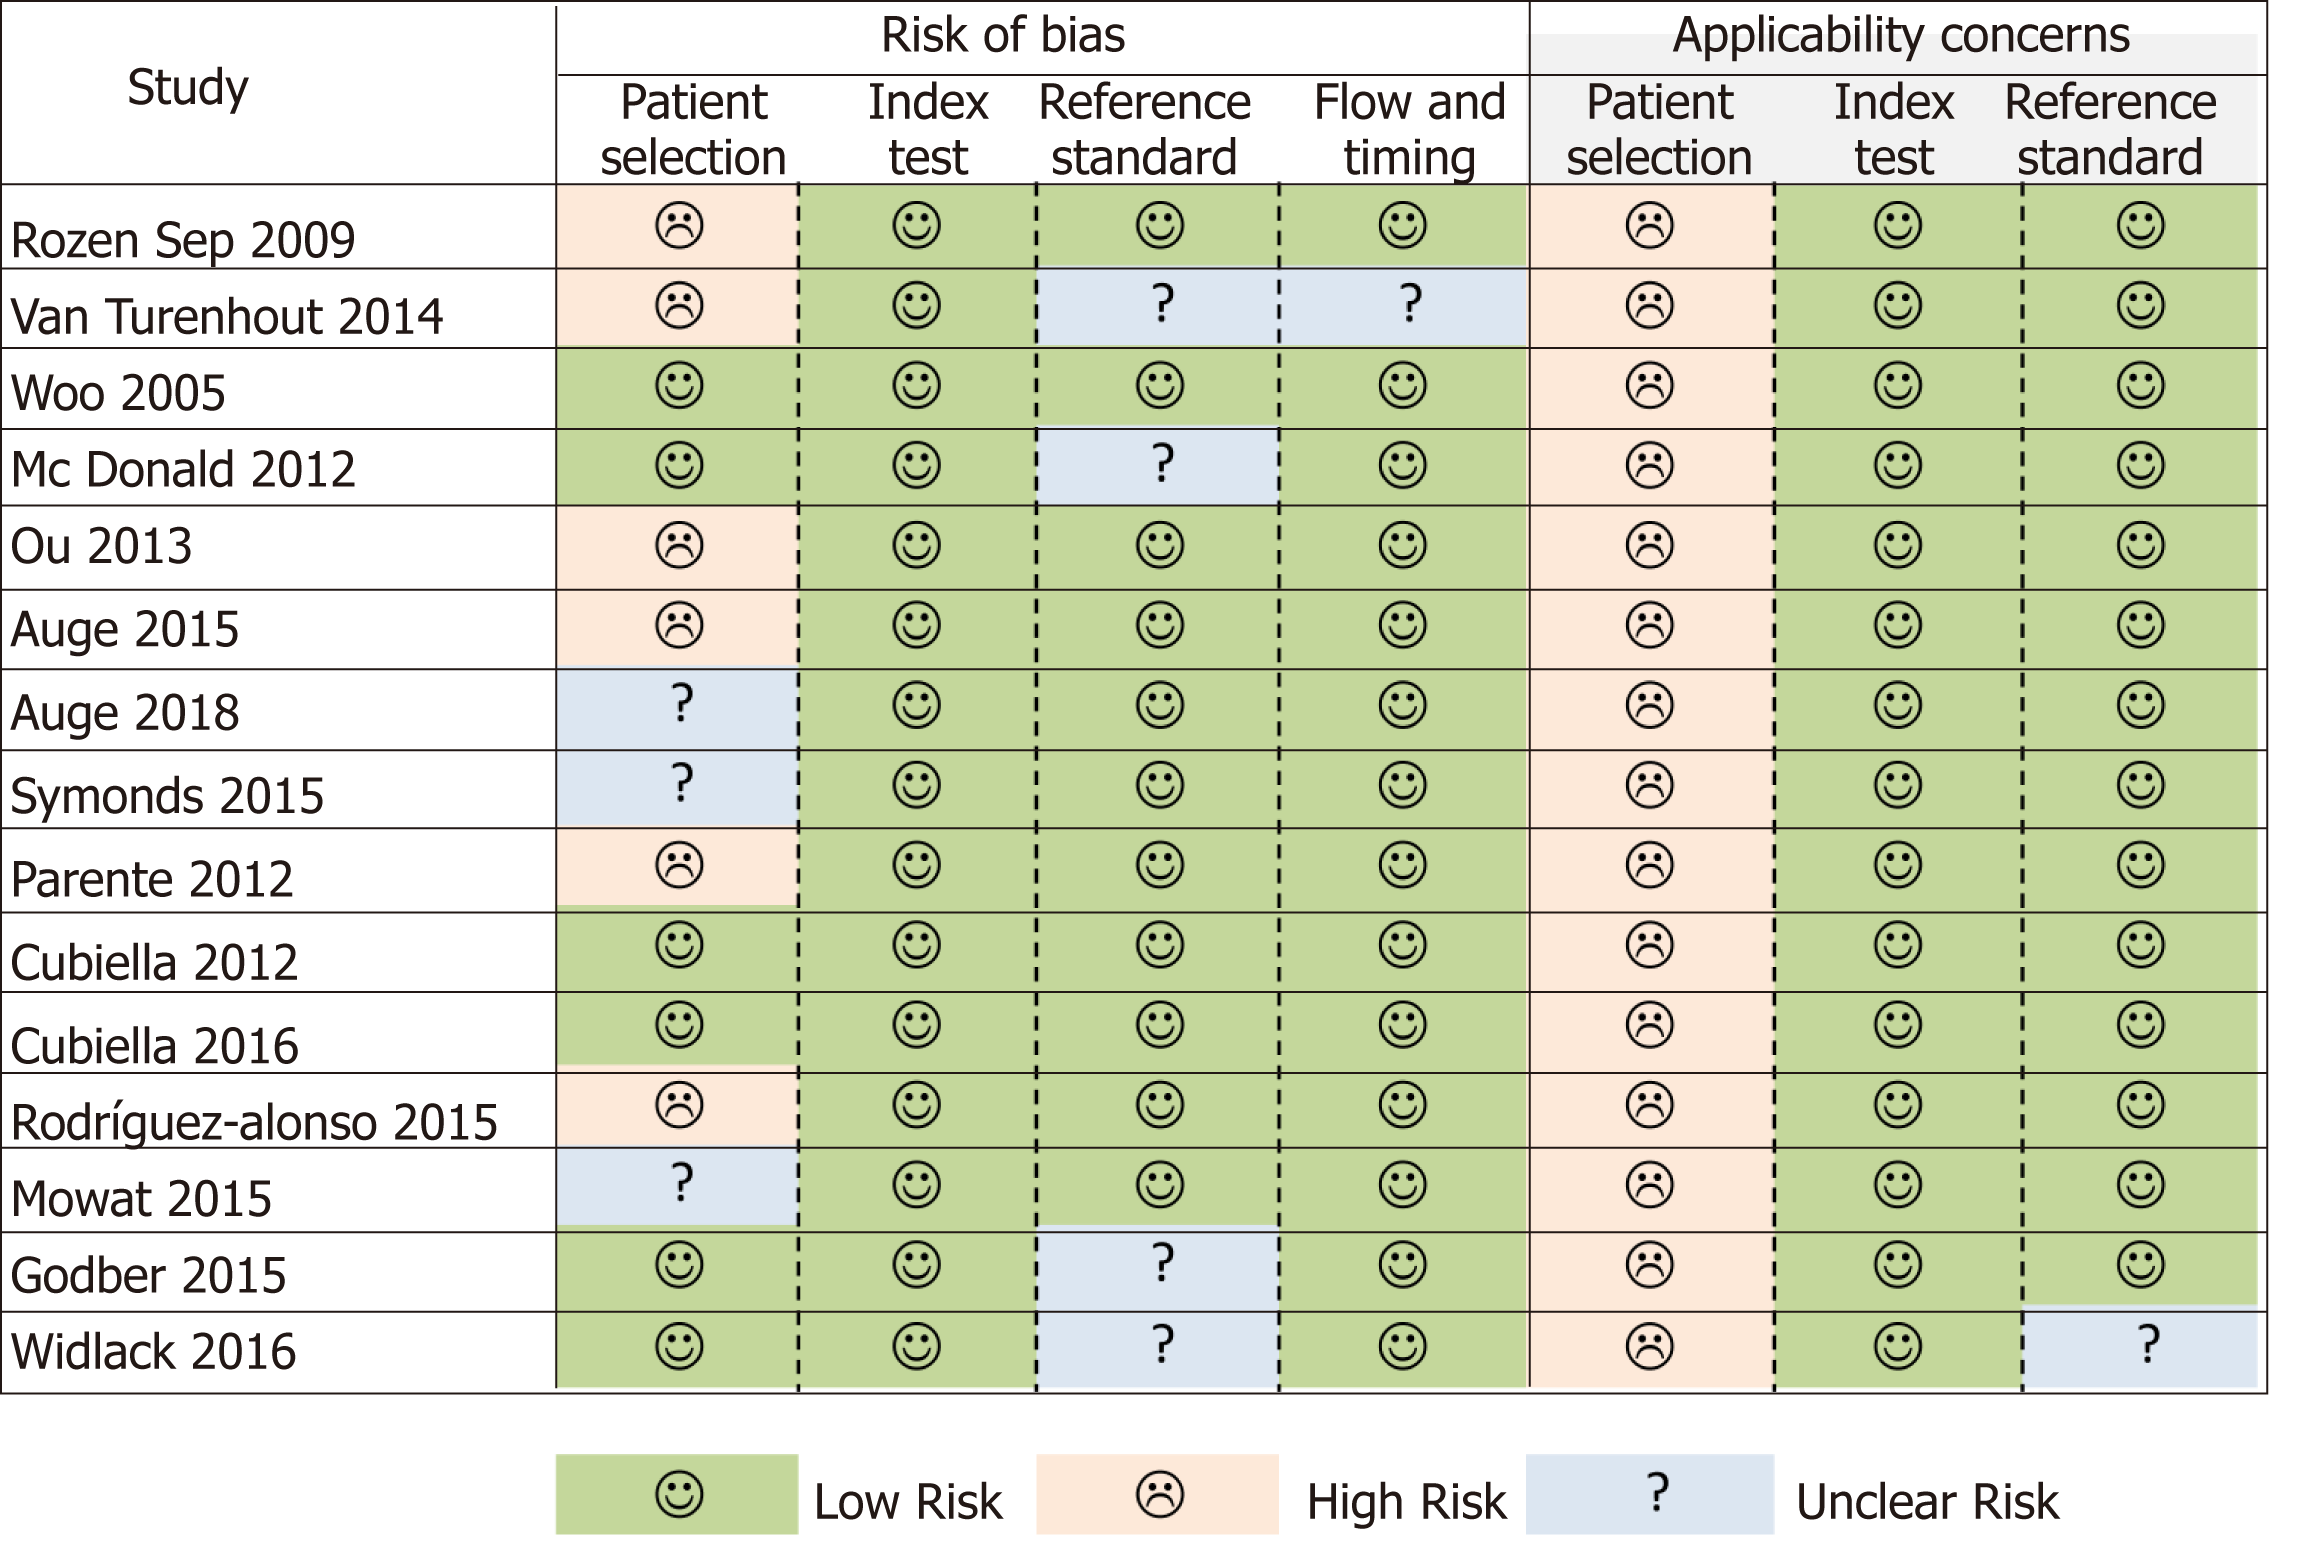
Figure 2 Quality Assessment of Diagnostic Accuracy Studies.
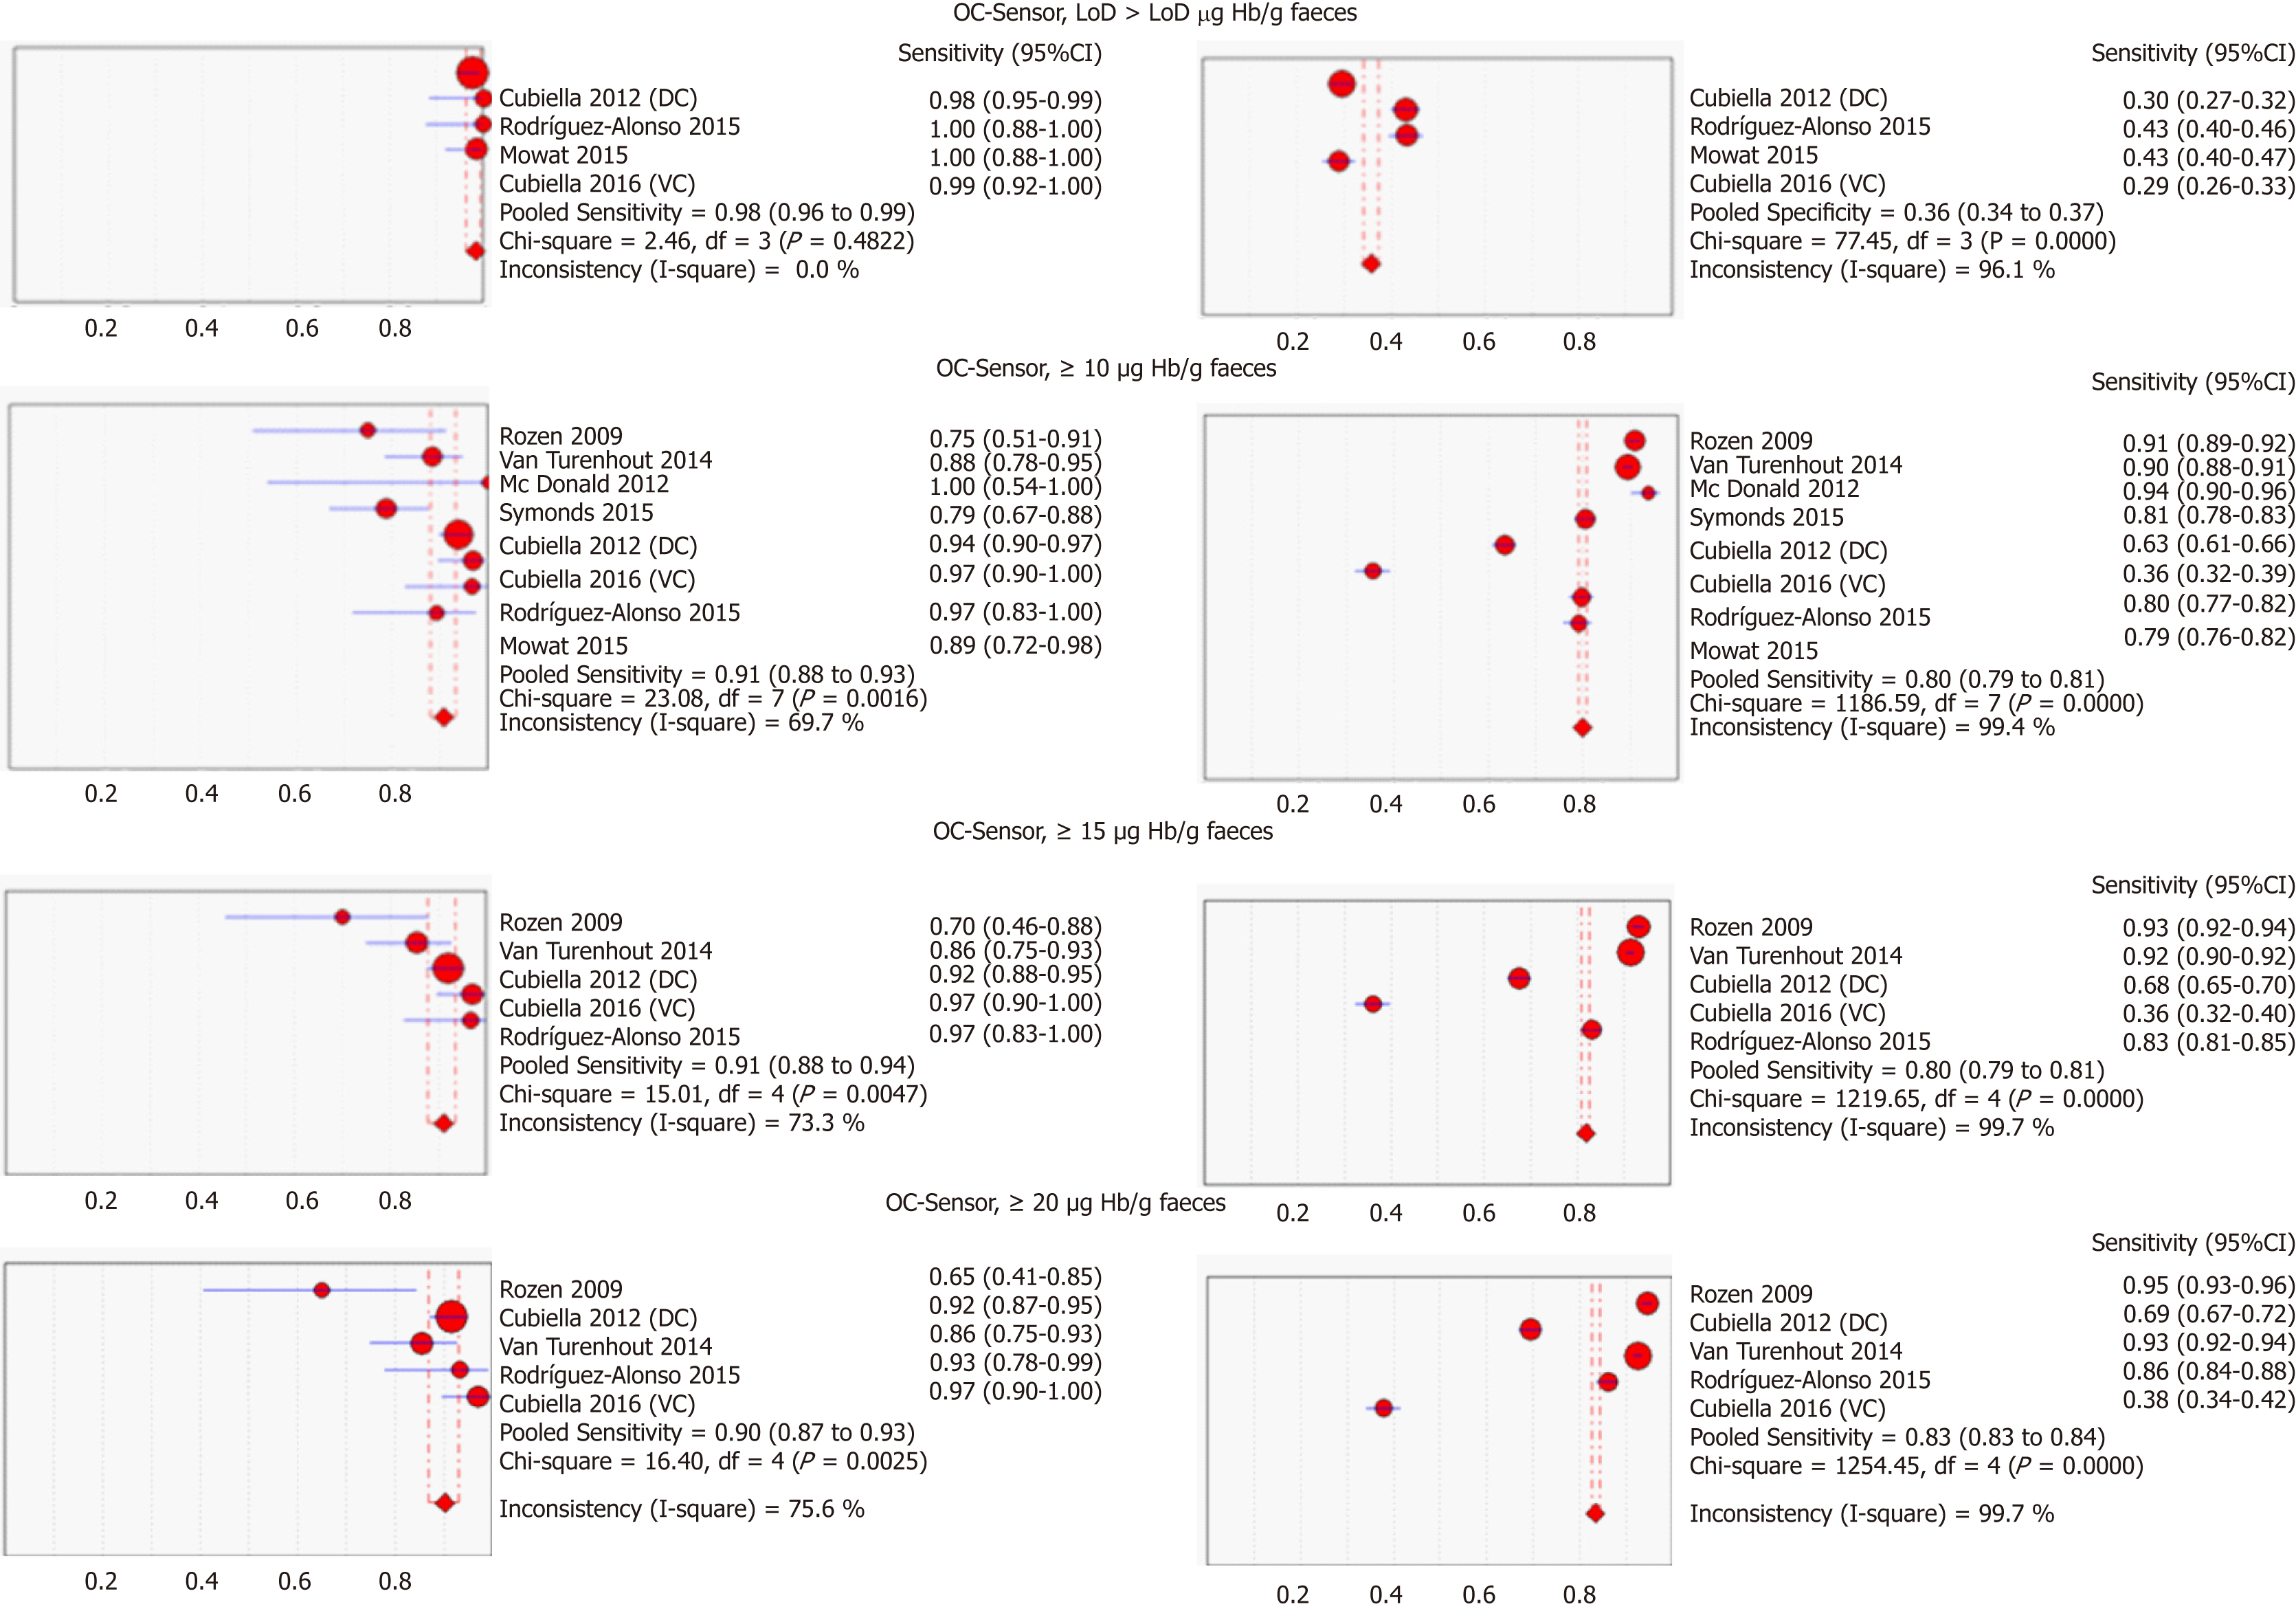
Figure 3 Pooled sensitivity and specificity of faecal immunochemical tests for colorectal cancer detection based on threshold and branch (DerSimonian´s method).
CI: Confidence interval; DC: Derivation cohort; VC: Validation cohort.
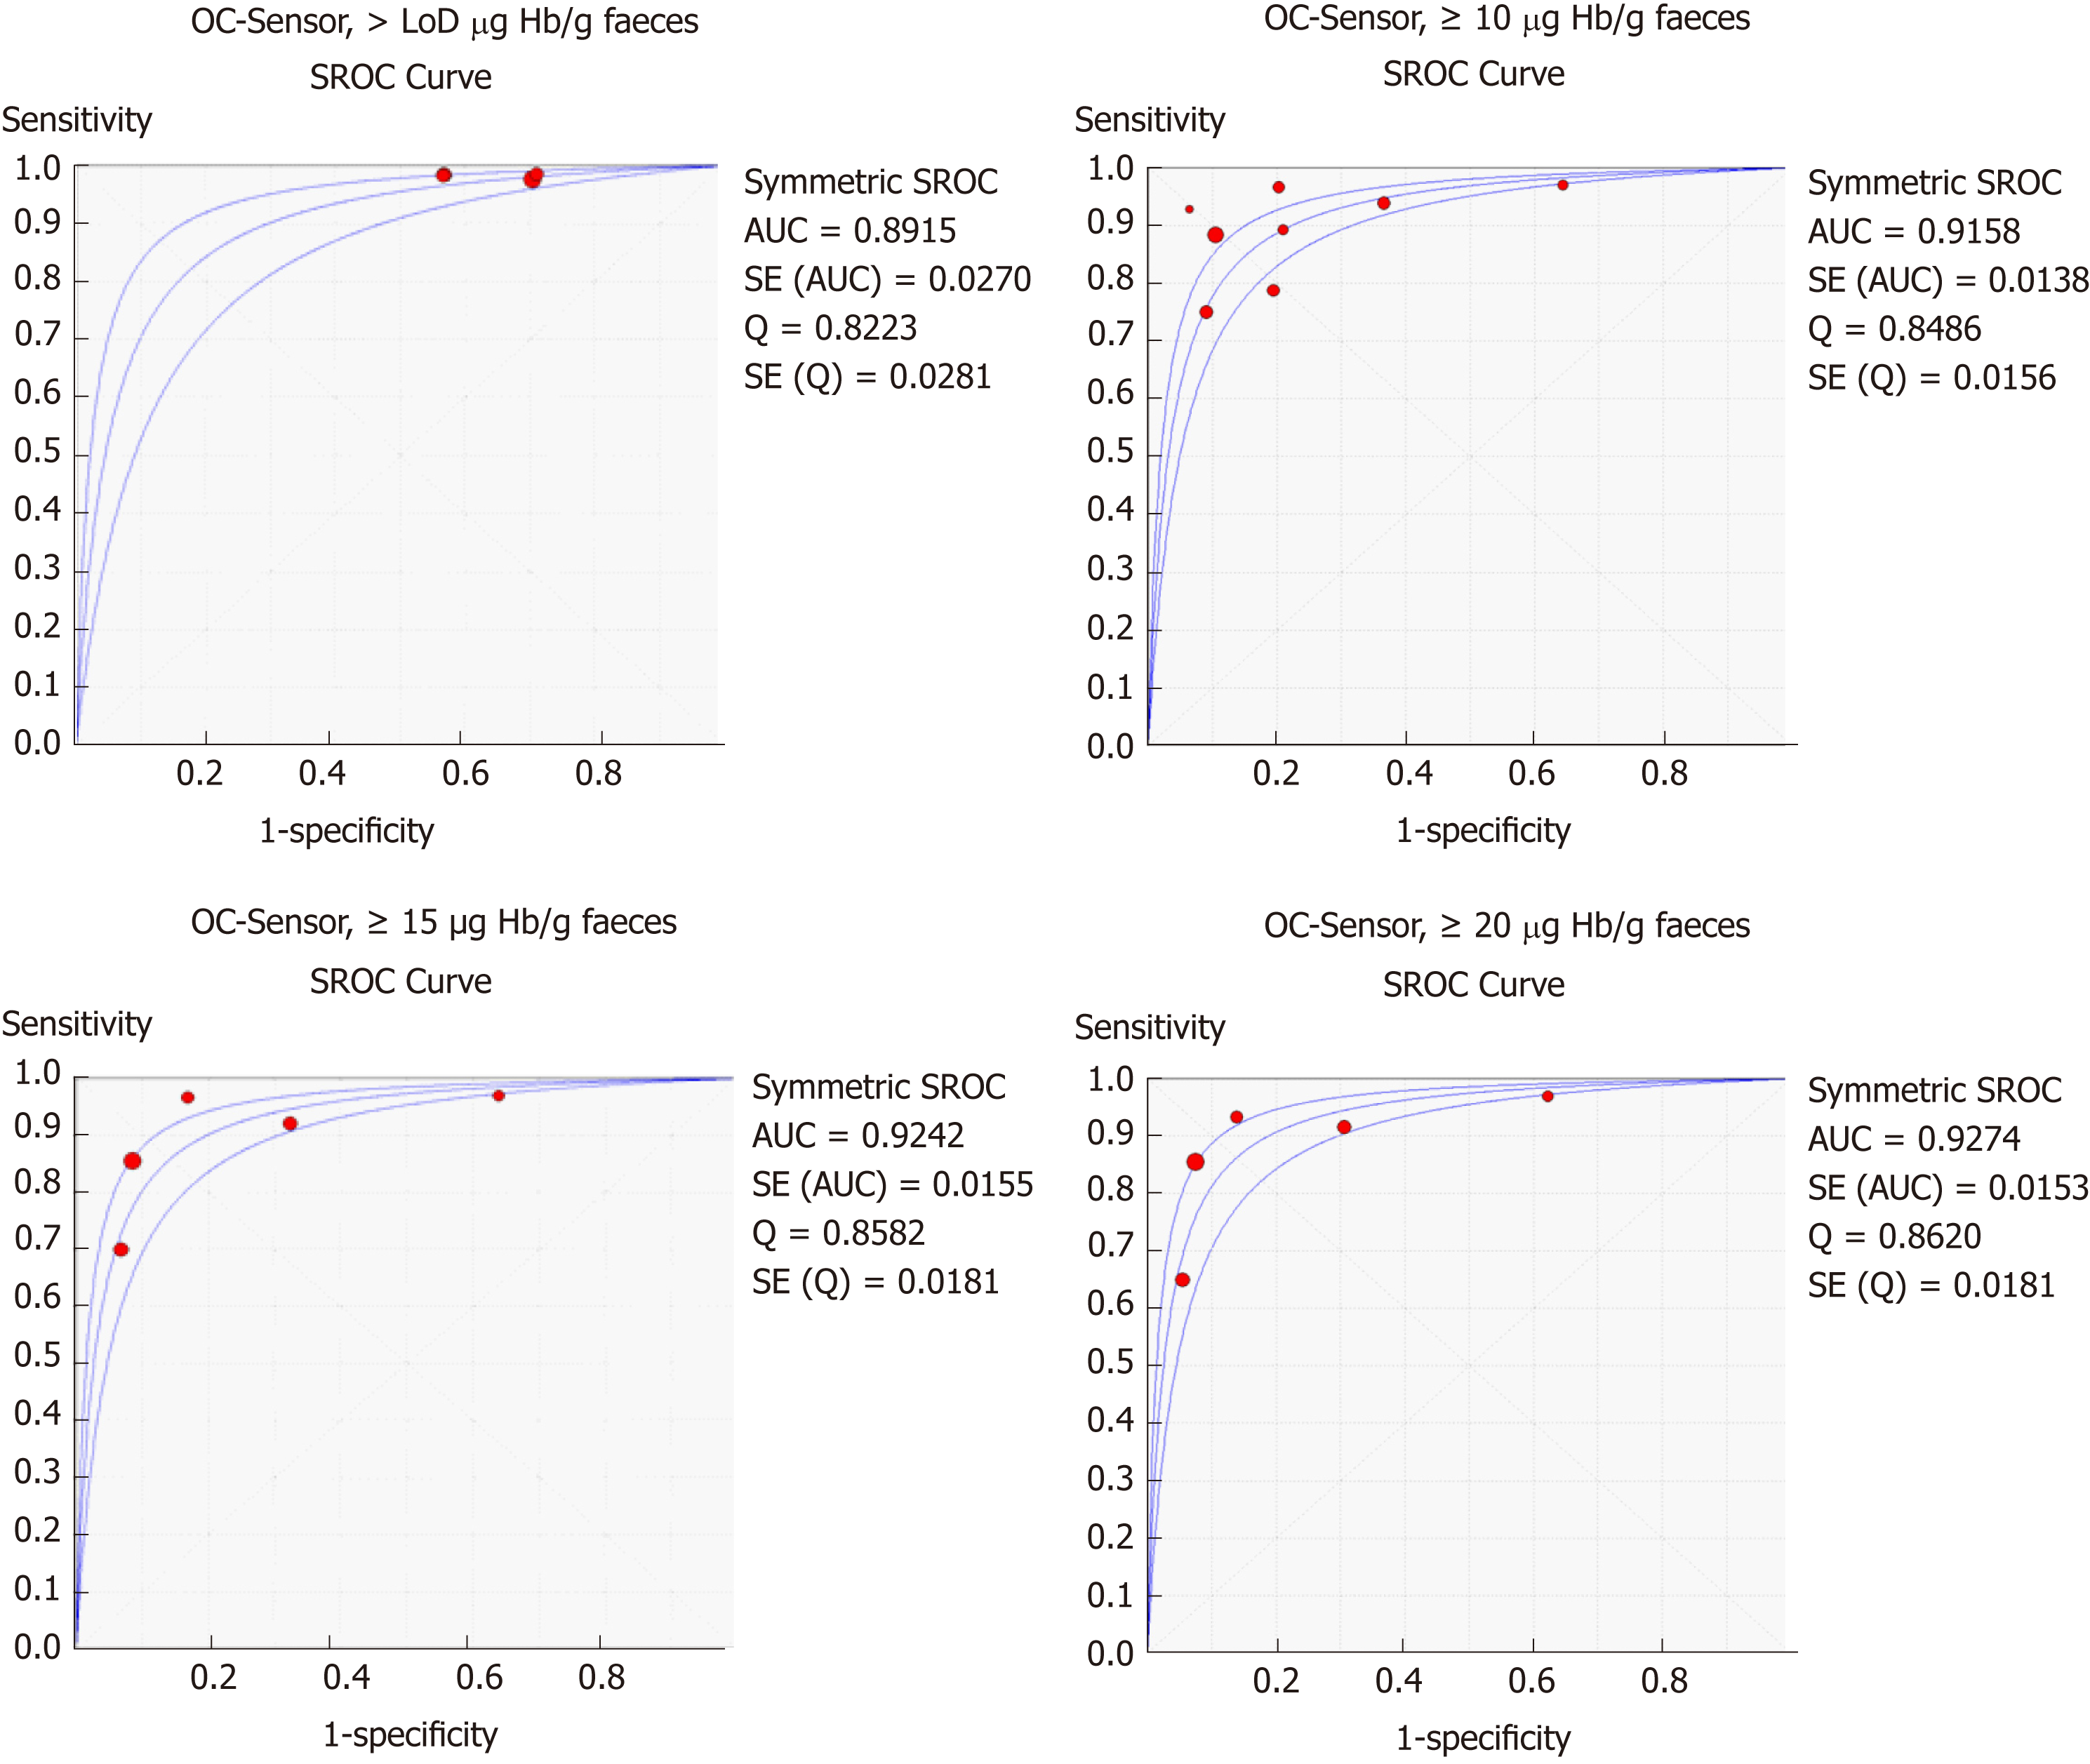
Figure 4 Summary receiver operating characteristic curve for colorectal cancer detection at different thresholds and branches (DerSimmonian and Lair´s model).
LoD: Limit of detection; AUC: Area under the curve; SROC: Summary receiver operating characteristic.
Figure 5 Funnel scatterplot to evaluate publication bias for studies using OC-Sensor® with different thresholds to detect colorectal cancer.
Each point in the plot represents a study with its diagnostic odds ratio (dOR) and sample size. A symmetric image around an axis traced by the pooled dOR value suggests absence of publication bias. Asymmetry with study concentration on the right side (the side with higher diagnostic odds ratio values) suggests publication bias with less negative studies published. dOR: Diagnostic odds ratio.
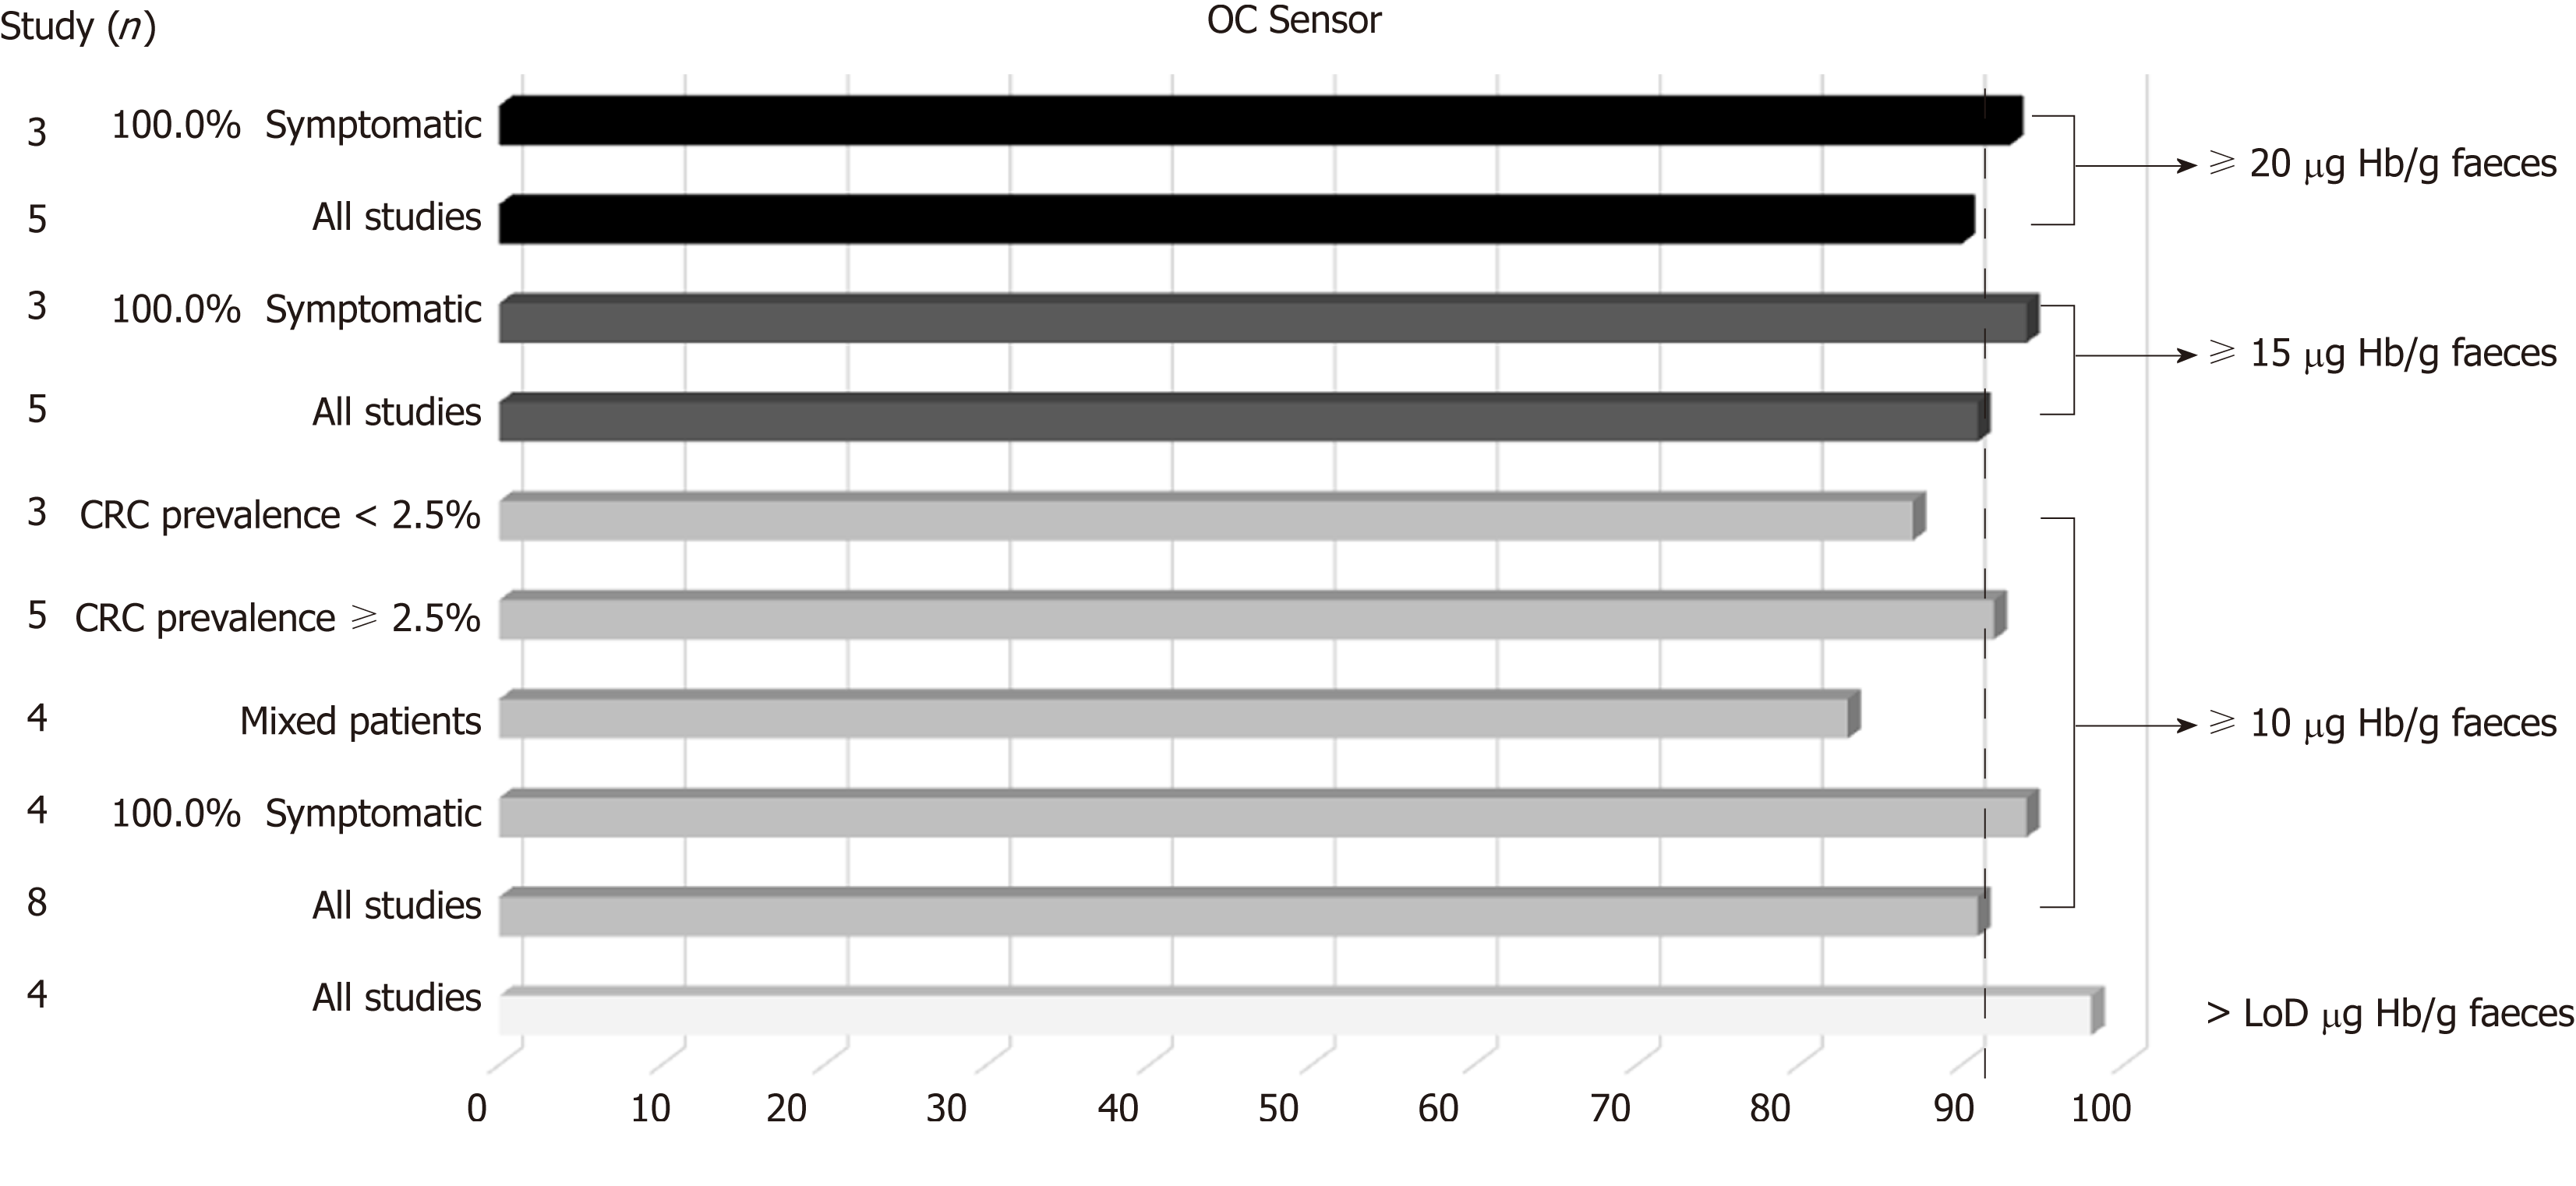
Figure 6 OC-Sensor® pooled sensitivity estimates for colorectal cancer detection (subgroup analysis using DerSimonian´s method).
CRC: Colorectal cancer.
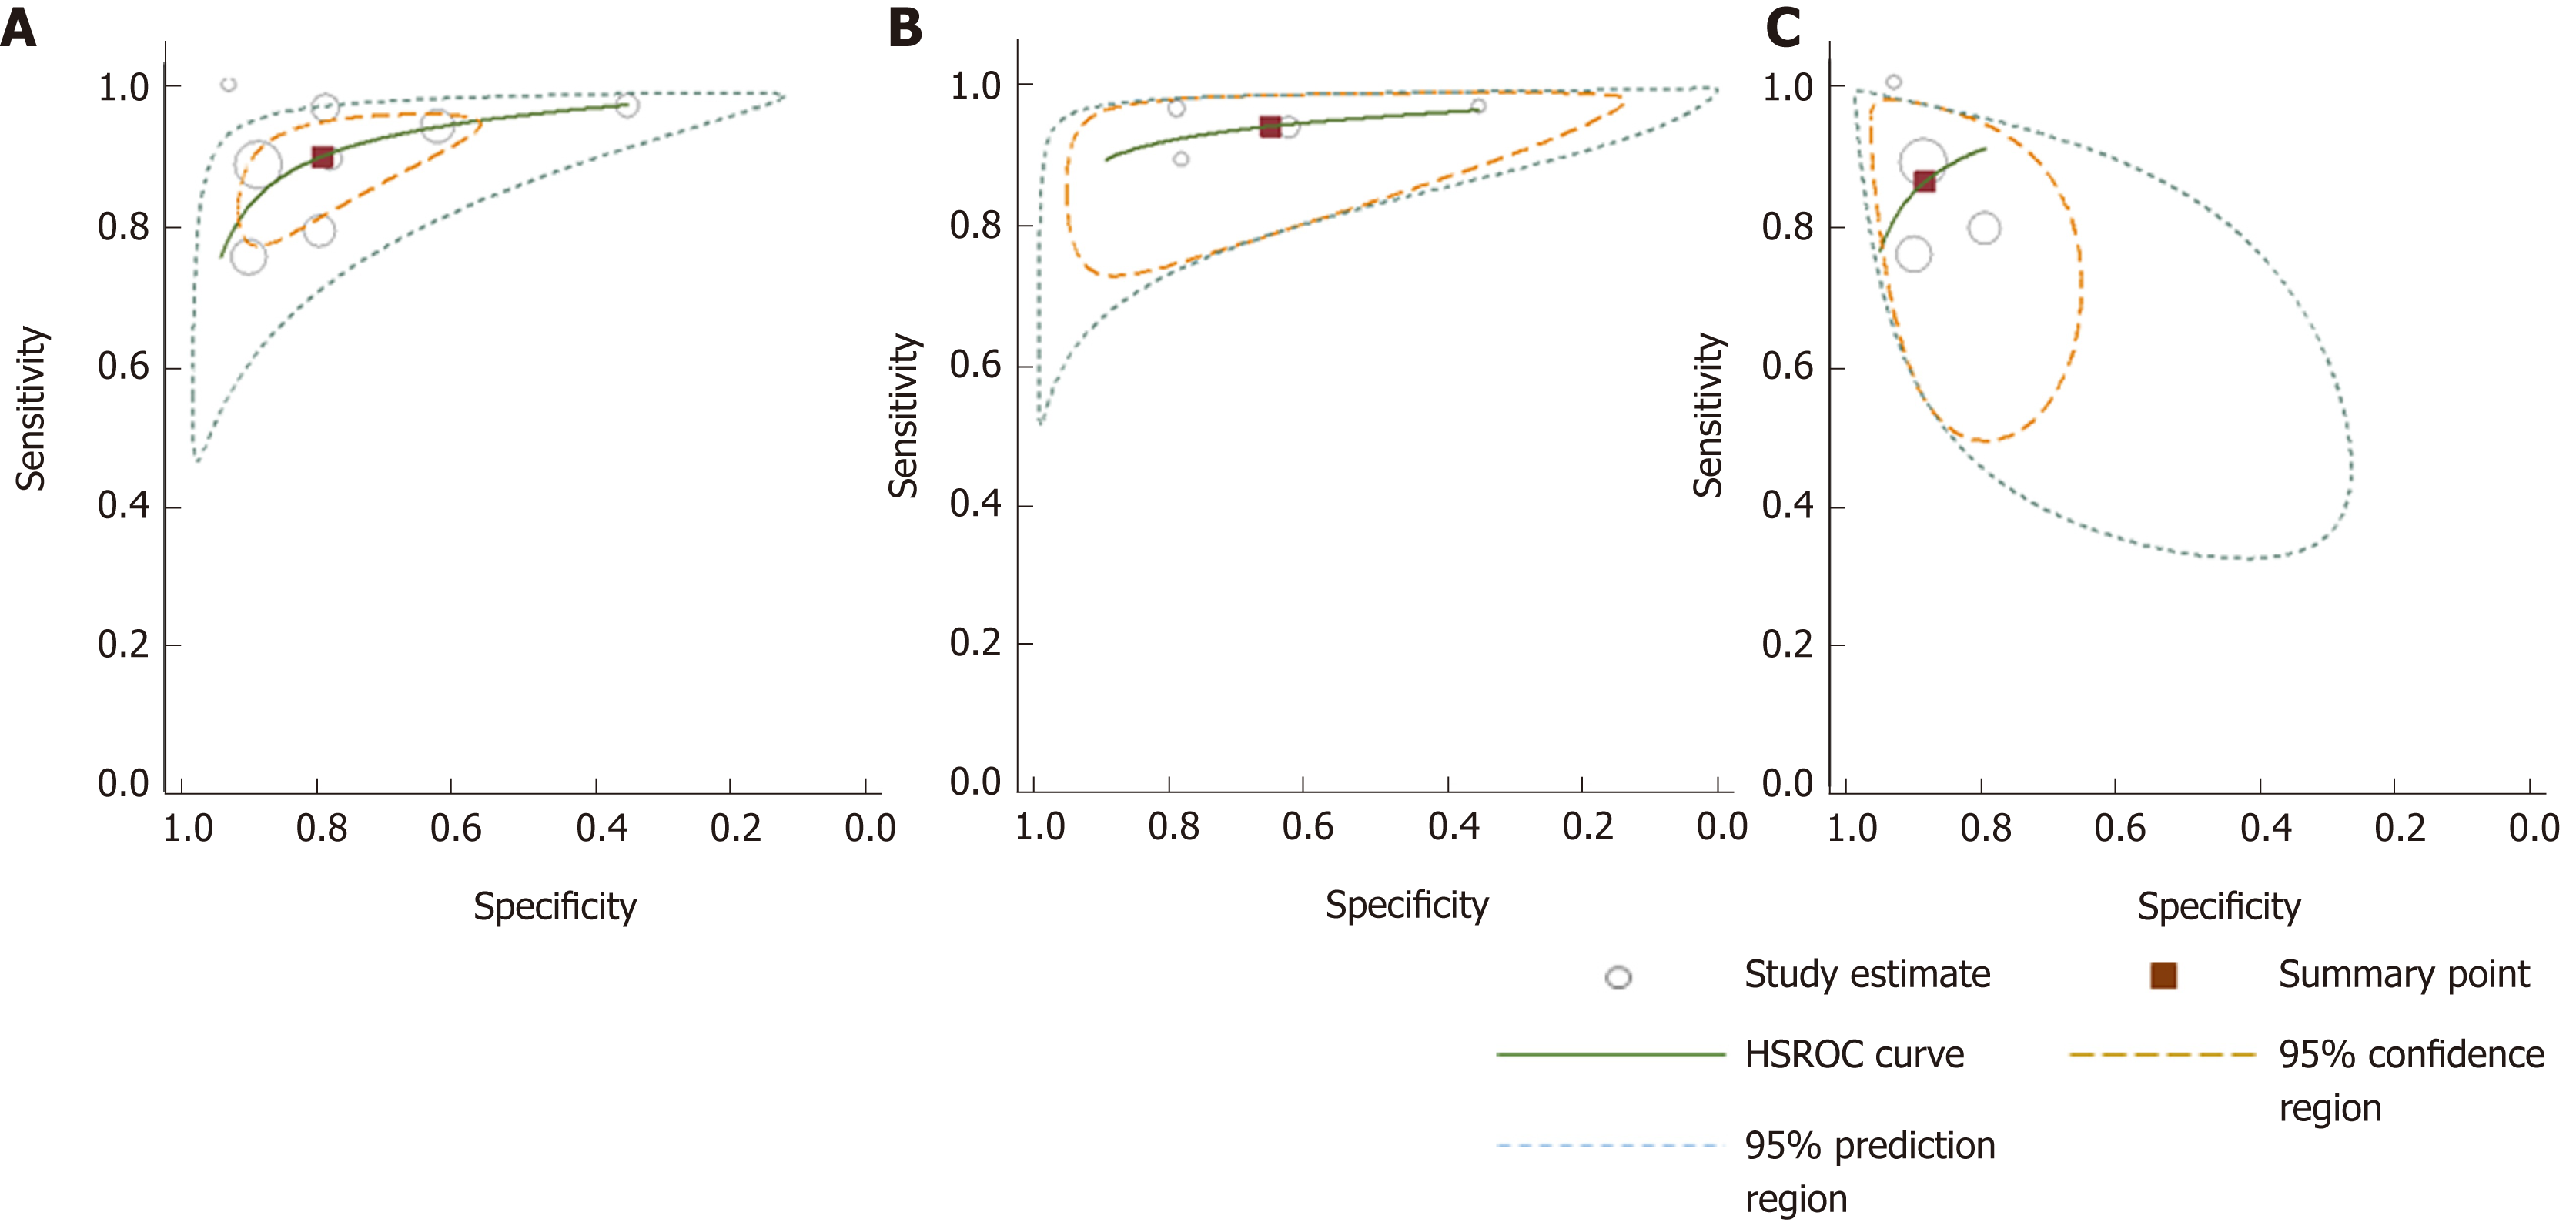
Figure 7 Hierarchical summary receiver-operating characteristic curves for colorectal cancer detection generated using different subgroups of studies.
A: All studies; B: 100% symptomatic; C: Mixed cohorts. HSROC: Hierarchical summary receiver operating characteristic.
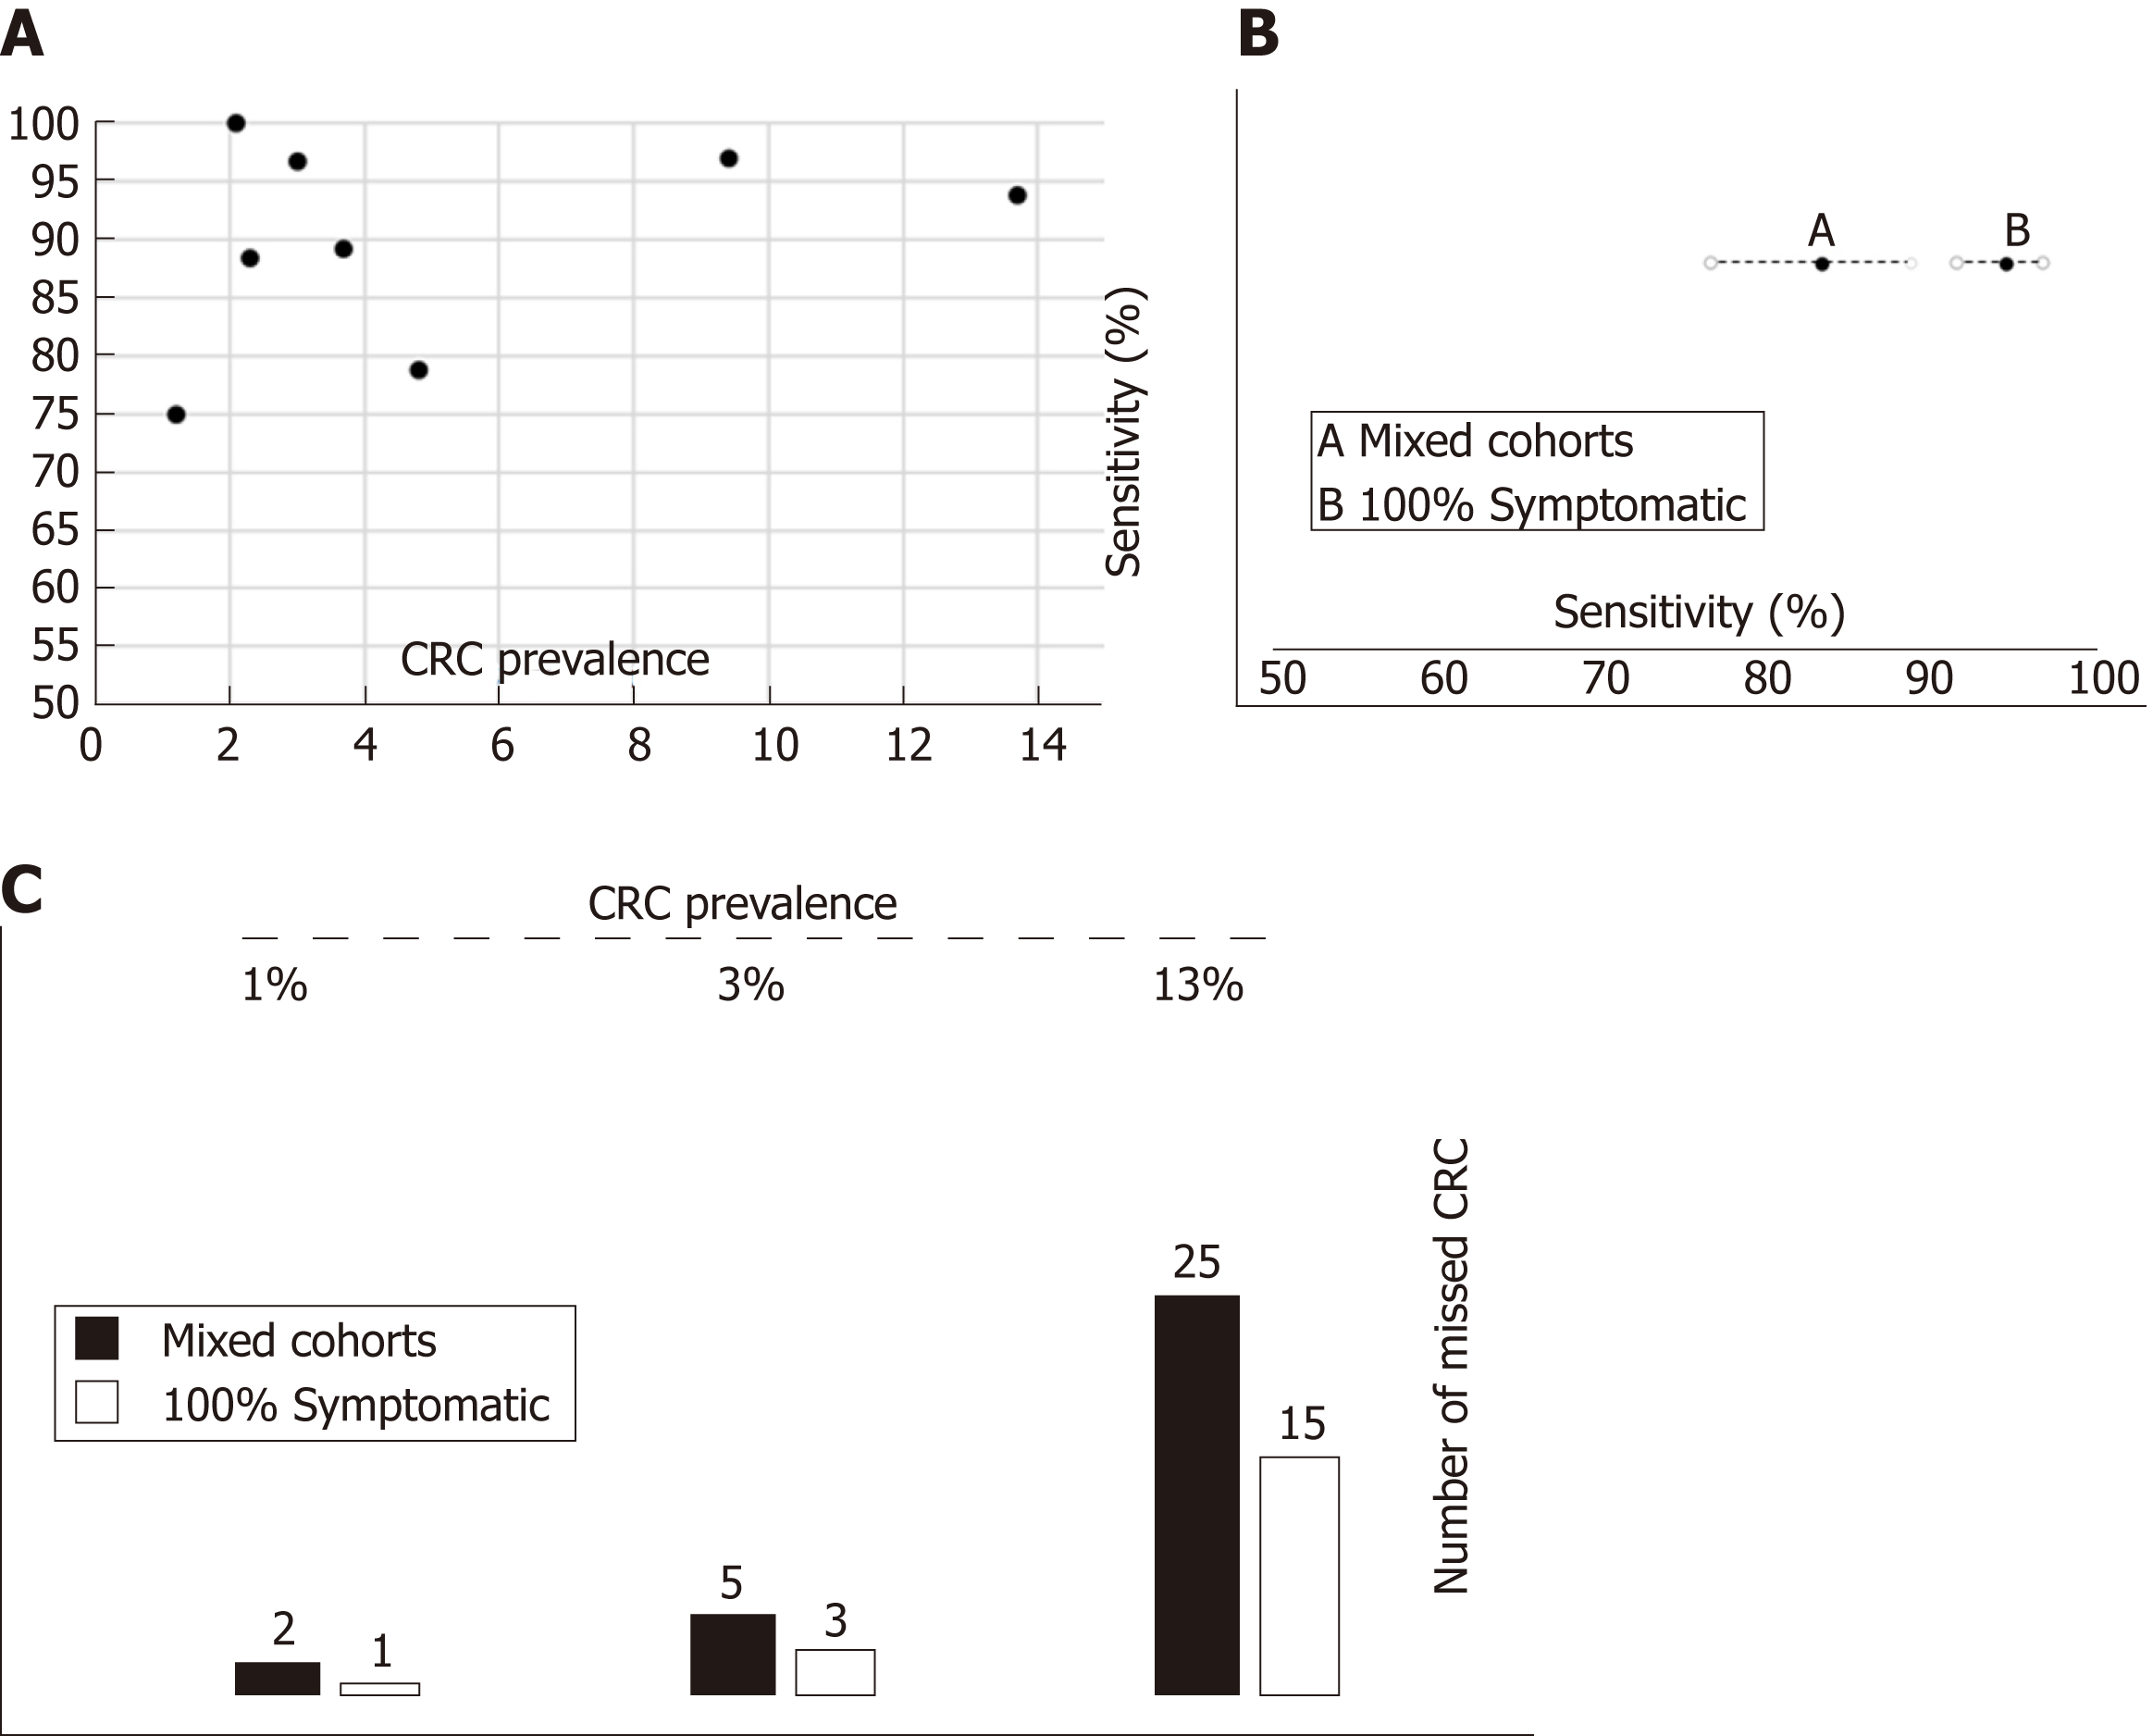
Figure 8 Relationship between colorectal cancer prevalence, clinical spectrum and accuracy of faecal immunochemical test for haemoglobin to rule out colorectal cancer.
A: There is no correlation between colorectal cancer (CRC) prevalence and faecal immunochemical test for haemoglobin (FIT) sensitivity; B: Pooled FIT sensitivity to detect CRC cancer estimated from studies with ‘Mixed cohorts’ is significantly lower than estimated with ‘100% symptomatic’ cohorts; C: Number of missed CRC per 1000 assessed symptomatic patients with colorectal cancer calculated through Fagan nomograms under various assumptions (FIT accuracy parameters estimated with mixed cohorts or 100% symptomatic cohorts) and CRC prevalence. CRC: Colorectal cancer; FIT: Faecal immunochemical test for haemoglobin.
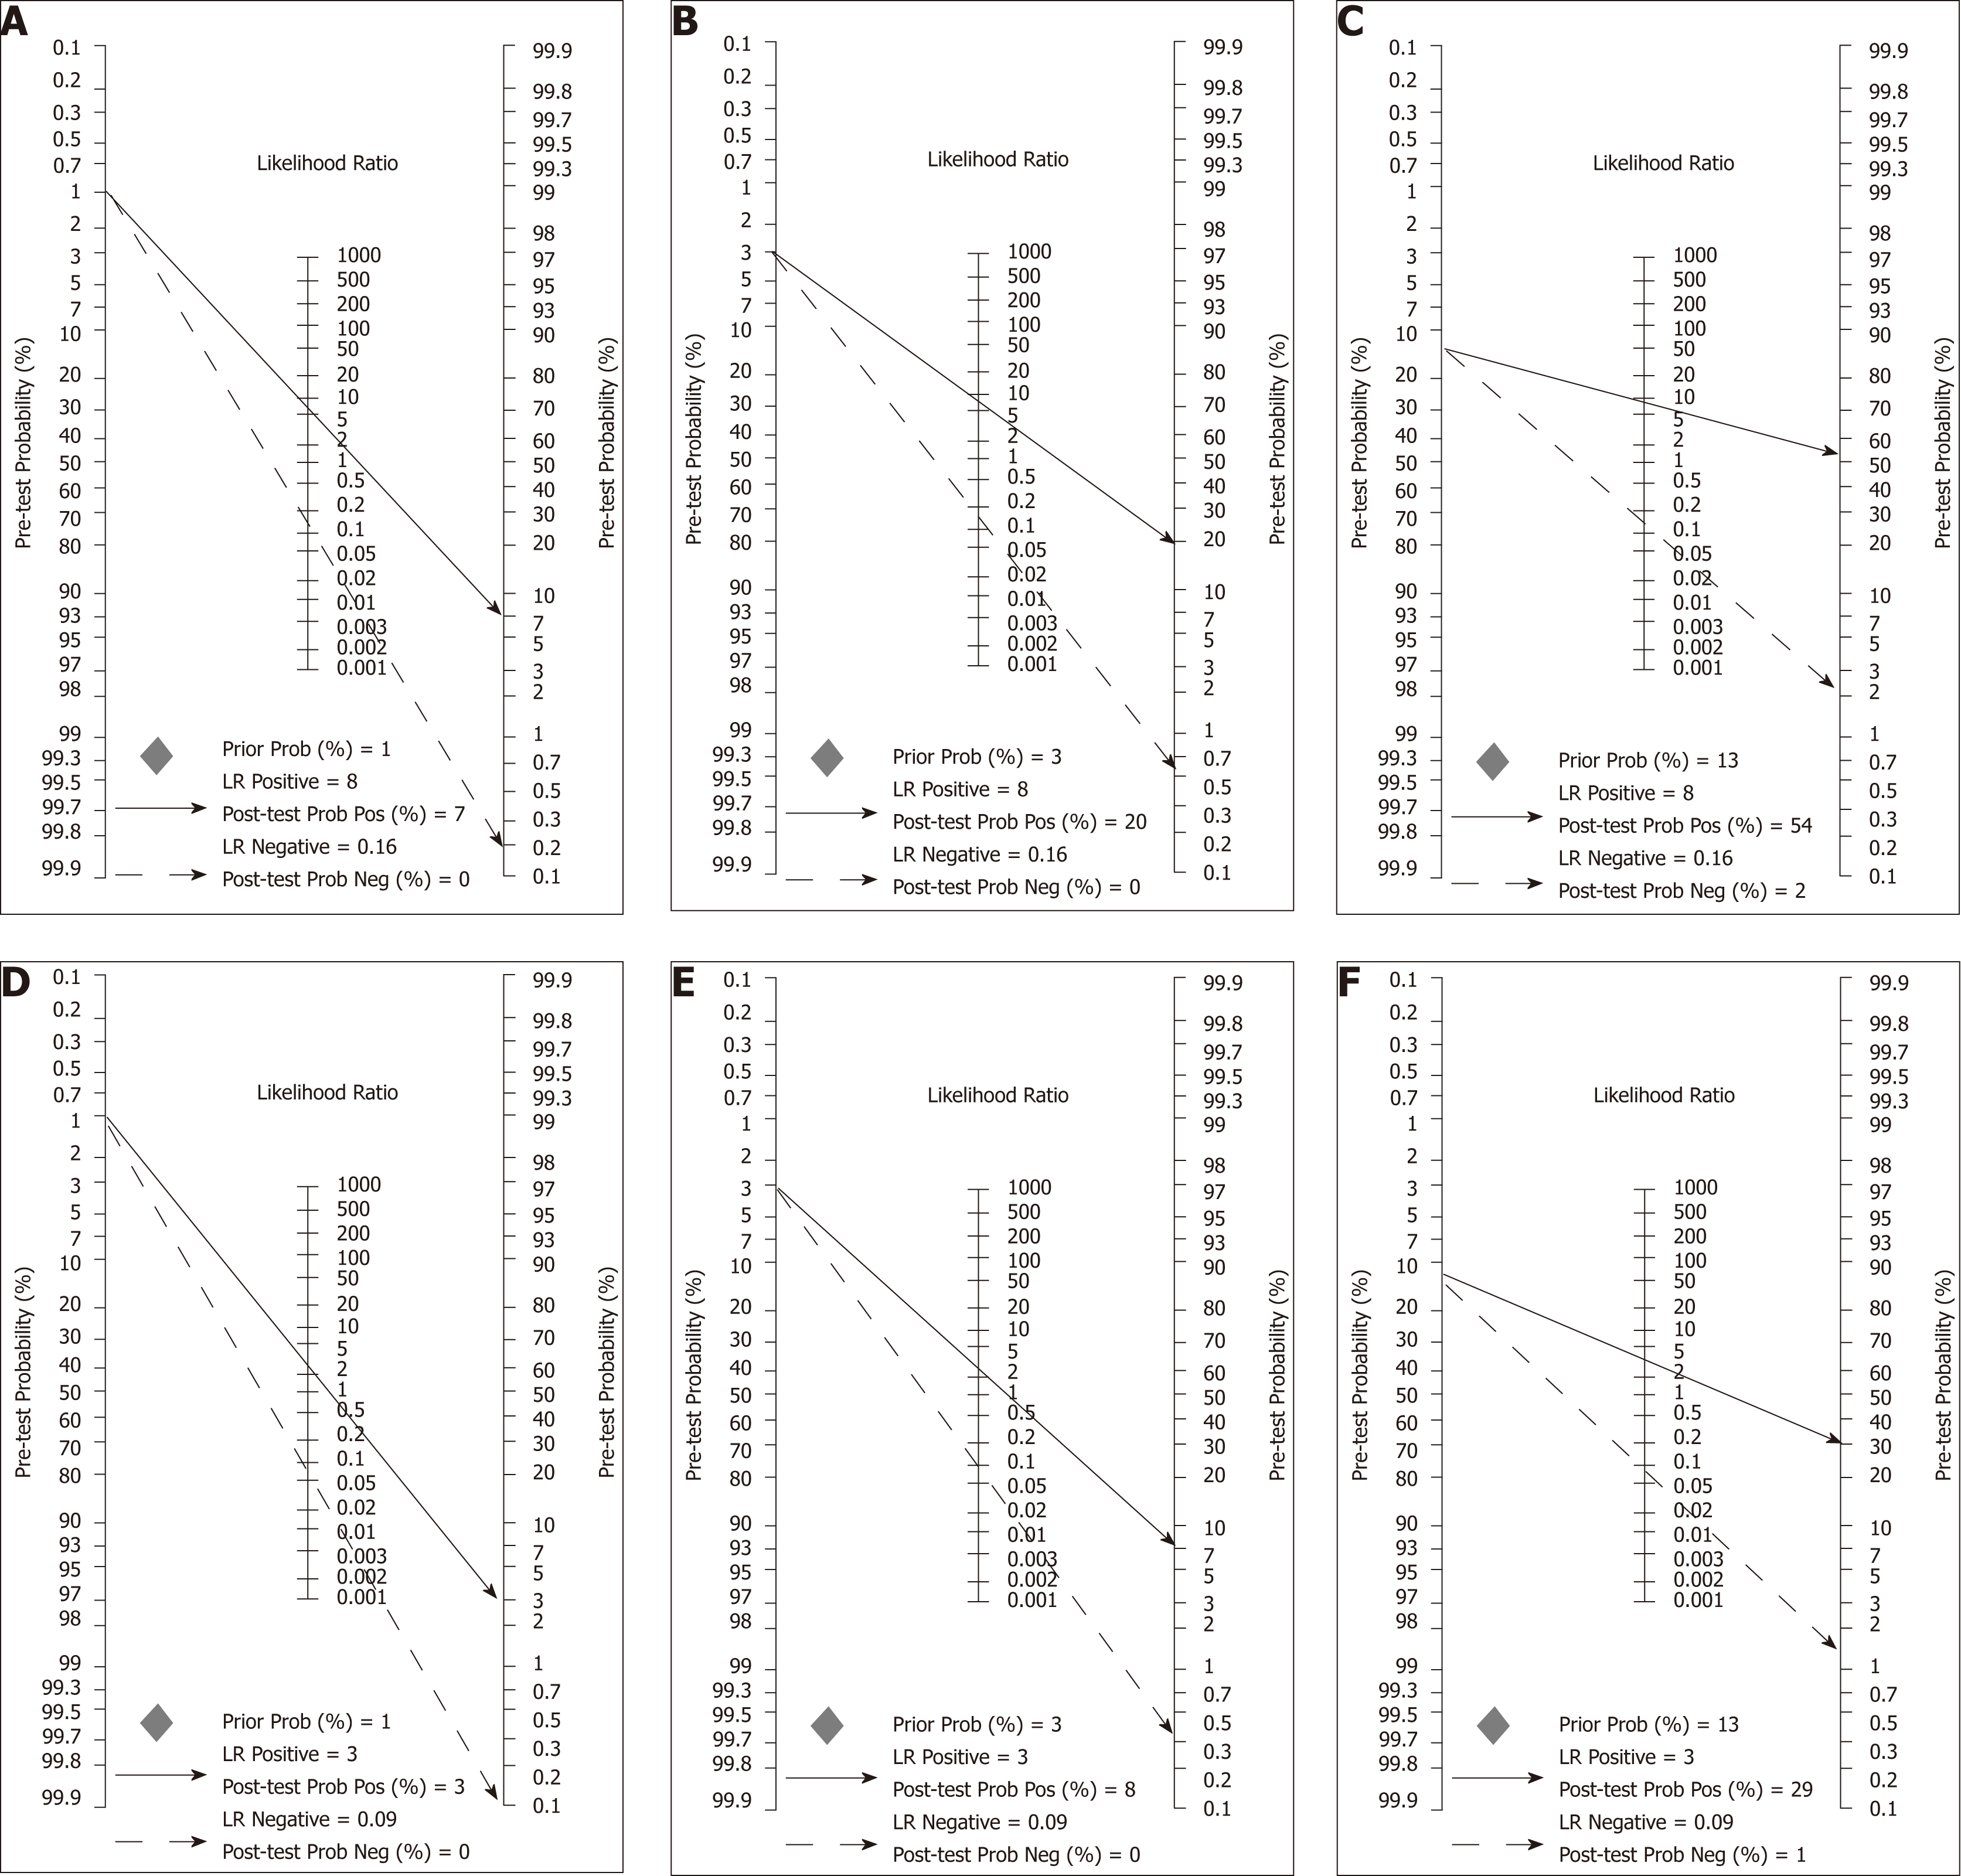
Figure 9 Fagan nomograms used to calculate post-test probabilities based on different scenarios defined by colorectal cancer prevalence and supposed accuracy of OC-Sensor (Threshold 10 µg Hb/g faeces).
A-C; These scenarios are defined by colorectal cancer (CRC) prevalence of 1%, 3% and 13% respectively and faecal immunochemical test for haemoglobin (FIT) accuracy parameters used were the pooled estimates calculated with ‘mixed cohorts’ studies; D-F; These scenarios are defined by CRC prevalence of 1%, 3% and 13% respectively and FIT accuracy parameters used were the pooled estimates calculated with ‘100% symptomatic’ studies. CRC: Colorectal cancer; FIT: Faecal immunochemical test for haemoglobin.
- Citation: Pin Vieito N, Zarraquiños S, Cubiella J. High-risk symptoms and quantitative faecal immunochemical test accuracy: Systematic review and meta-analysis. World J Gastroenterol 2019; 25(19): 2383-2401
- URL: https://www.wjgnet.com/1007-9327/full/v25/i19/2383.htm
- DOI: https://dx.doi.org/10.3748/wjg.v25.i19.2383


