Copyright
©The Author(s) 2019.
World J Gastroenterol. Apr 21, 2019; 25(15): 1865-1878
Published online Apr 21, 2019. doi: 10.3748/wjg.v25.i15.1865
Published online Apr 21, 2019. doi: 10.3748/wjg.v25.i15.1865
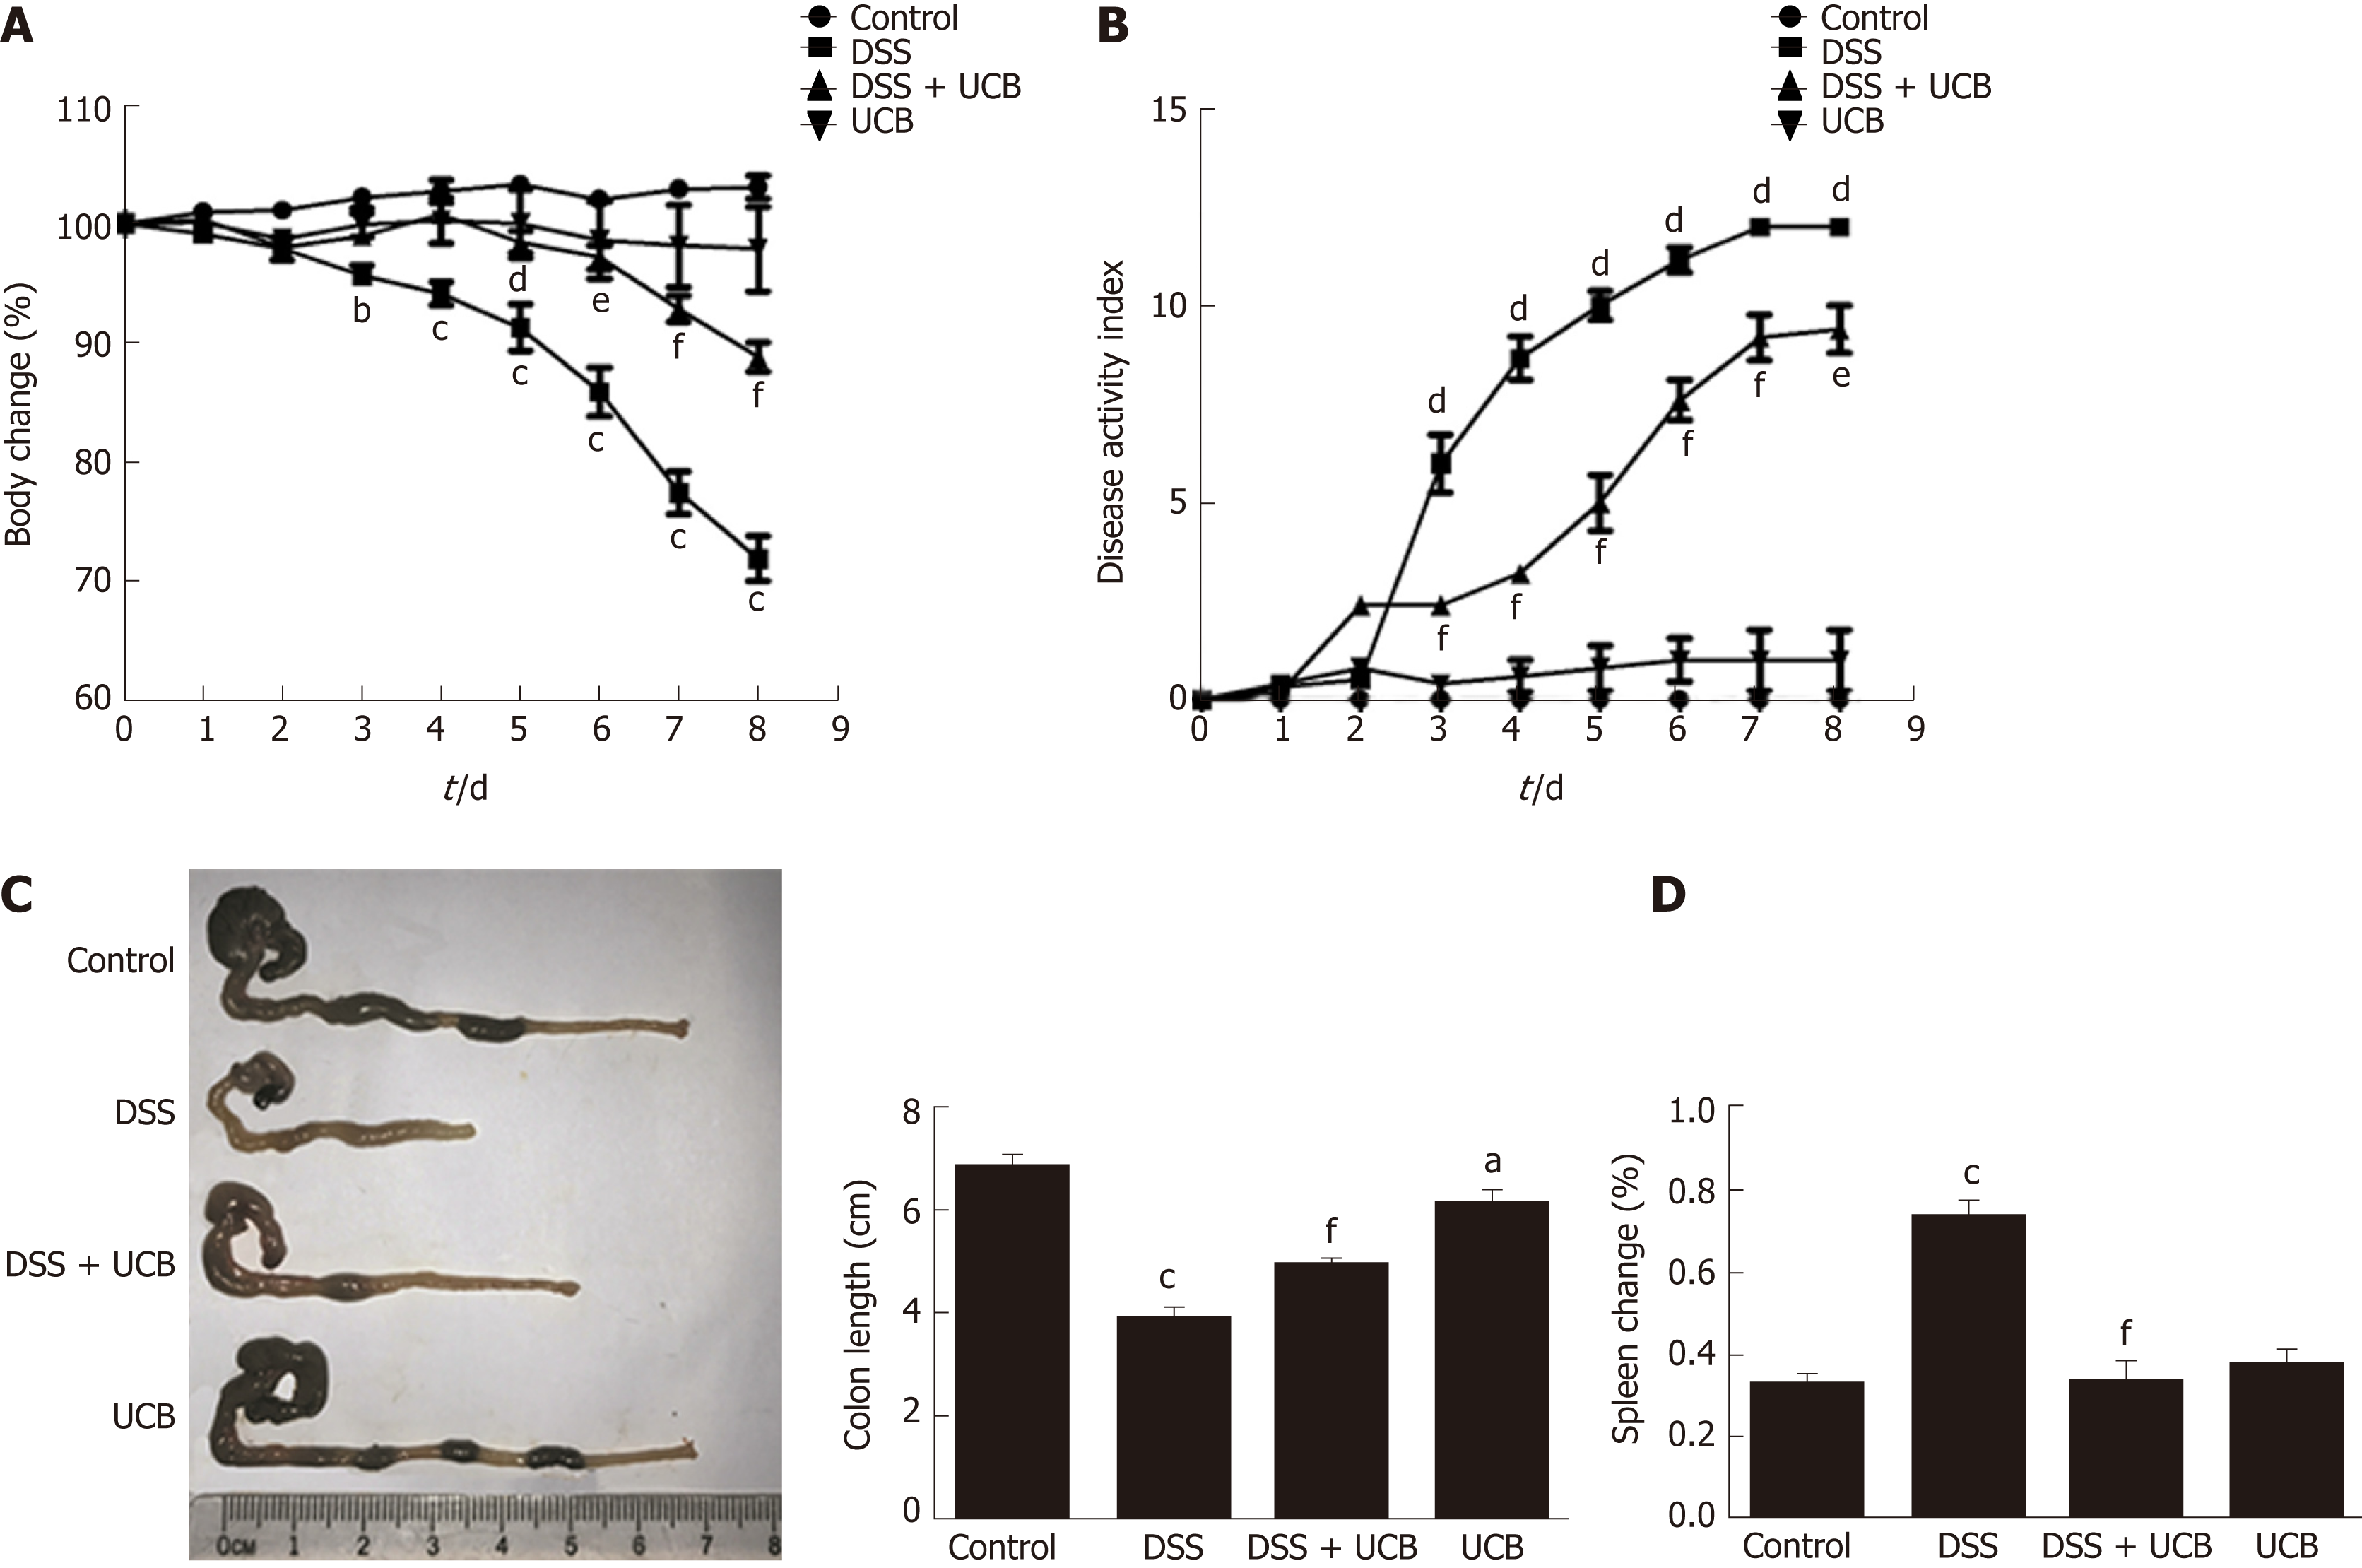
Figure 1 UCB significantly relieved severity of dextran sulfate sodium induced colitis.
A: Body weight changes, data plotted as percentage of basal body weight; B: Disease activity index; C: Changes in colon length; D: Relative spleen weight. Data are expressed as means ± SEM (n = 5). aP < 0.05, bP < 0.01, and cP < 0.001 vs control group, dP < 0.05, eP < 0.01, and fP < 0.001 vs dextran sodium sulfate group. UCB: Unconjugated bilirubin; DSS: Dextran sodium sulfate; SEM: Standard error of the mean.
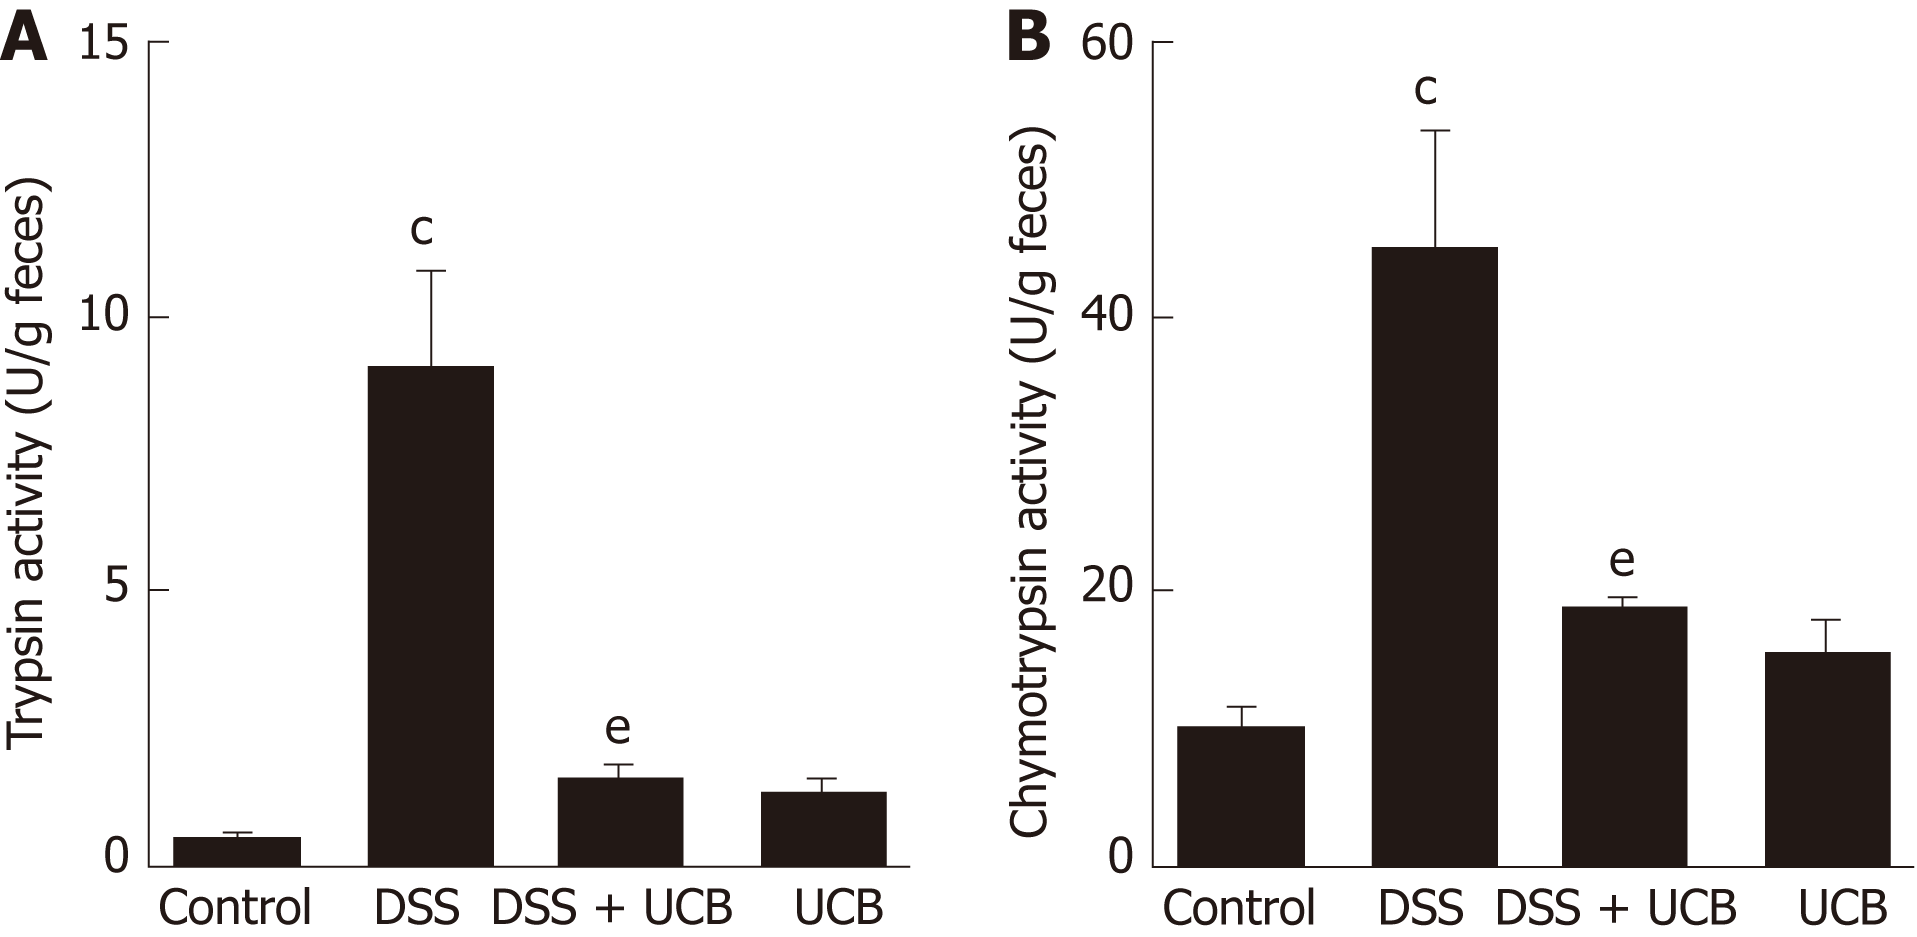
Figure 2 UCB inactivated digestive protease activity in DSS treated mice.
A: Trypsin activity in feces; B: Chymotrypsin activity in feces. Data are expressed as means ± SEM (n = 5). cP < 0.001 vs control group and eP < 0.01 vs dextran sodium sulfate group. UCB: Unconjugated bilirubin; DSS: Dextran sodium sulfate; SEM: Standard error of the mean.
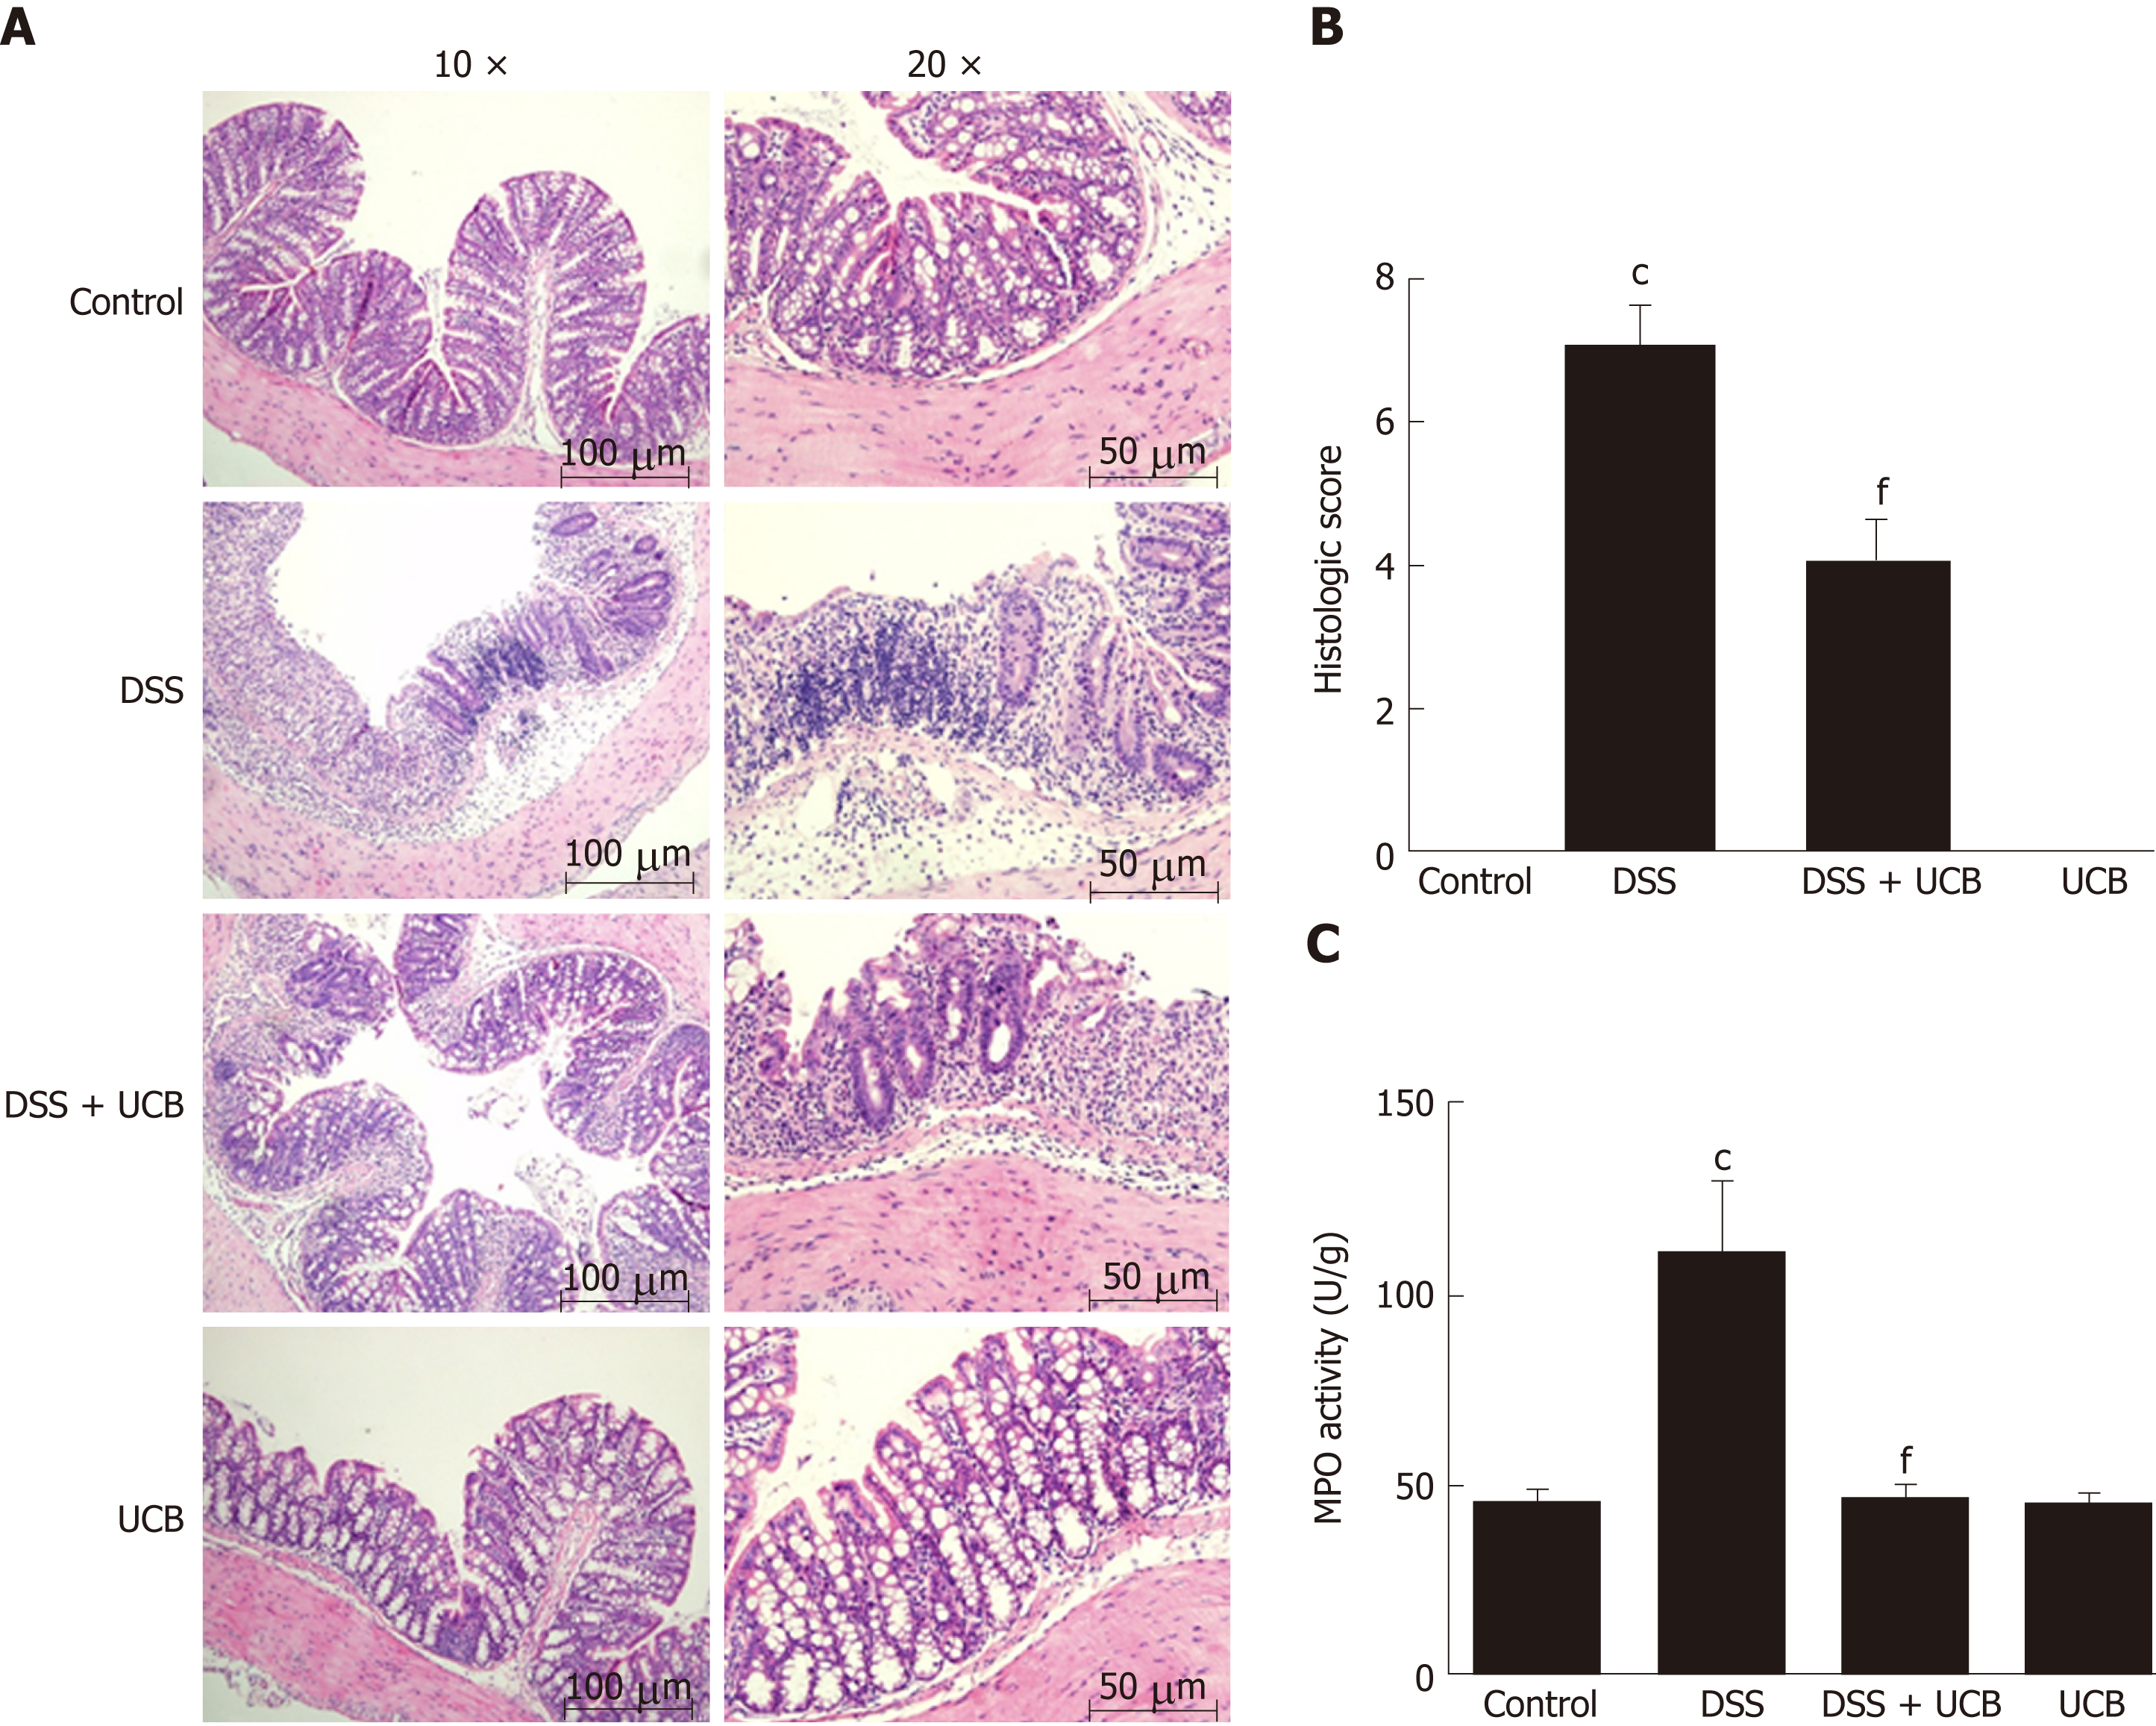
Figure 3 UCB ameliorated colon tissue injury in DSS induced colitis mice.
A: Light microscopic assessment of hematoxylin and eosin stained sections; B: Histological scores (images acquired at 10 × using Olympus BX60; scale bar =100 μM; images acquired at 20 × using Olympus BX60, scale bar = 50 μM, n = 3); C: MPO activity of colon tissues (n = 5). Data are expressed as means ± SEM. cP < 0.001 vs control group, and fP < 0.001 vs DSS. UCB: Unconjugated bilirubin; DSS: Dextran sodium sulfate; MPO: Myeloperoxidase; SEM: Standard error of the mean.
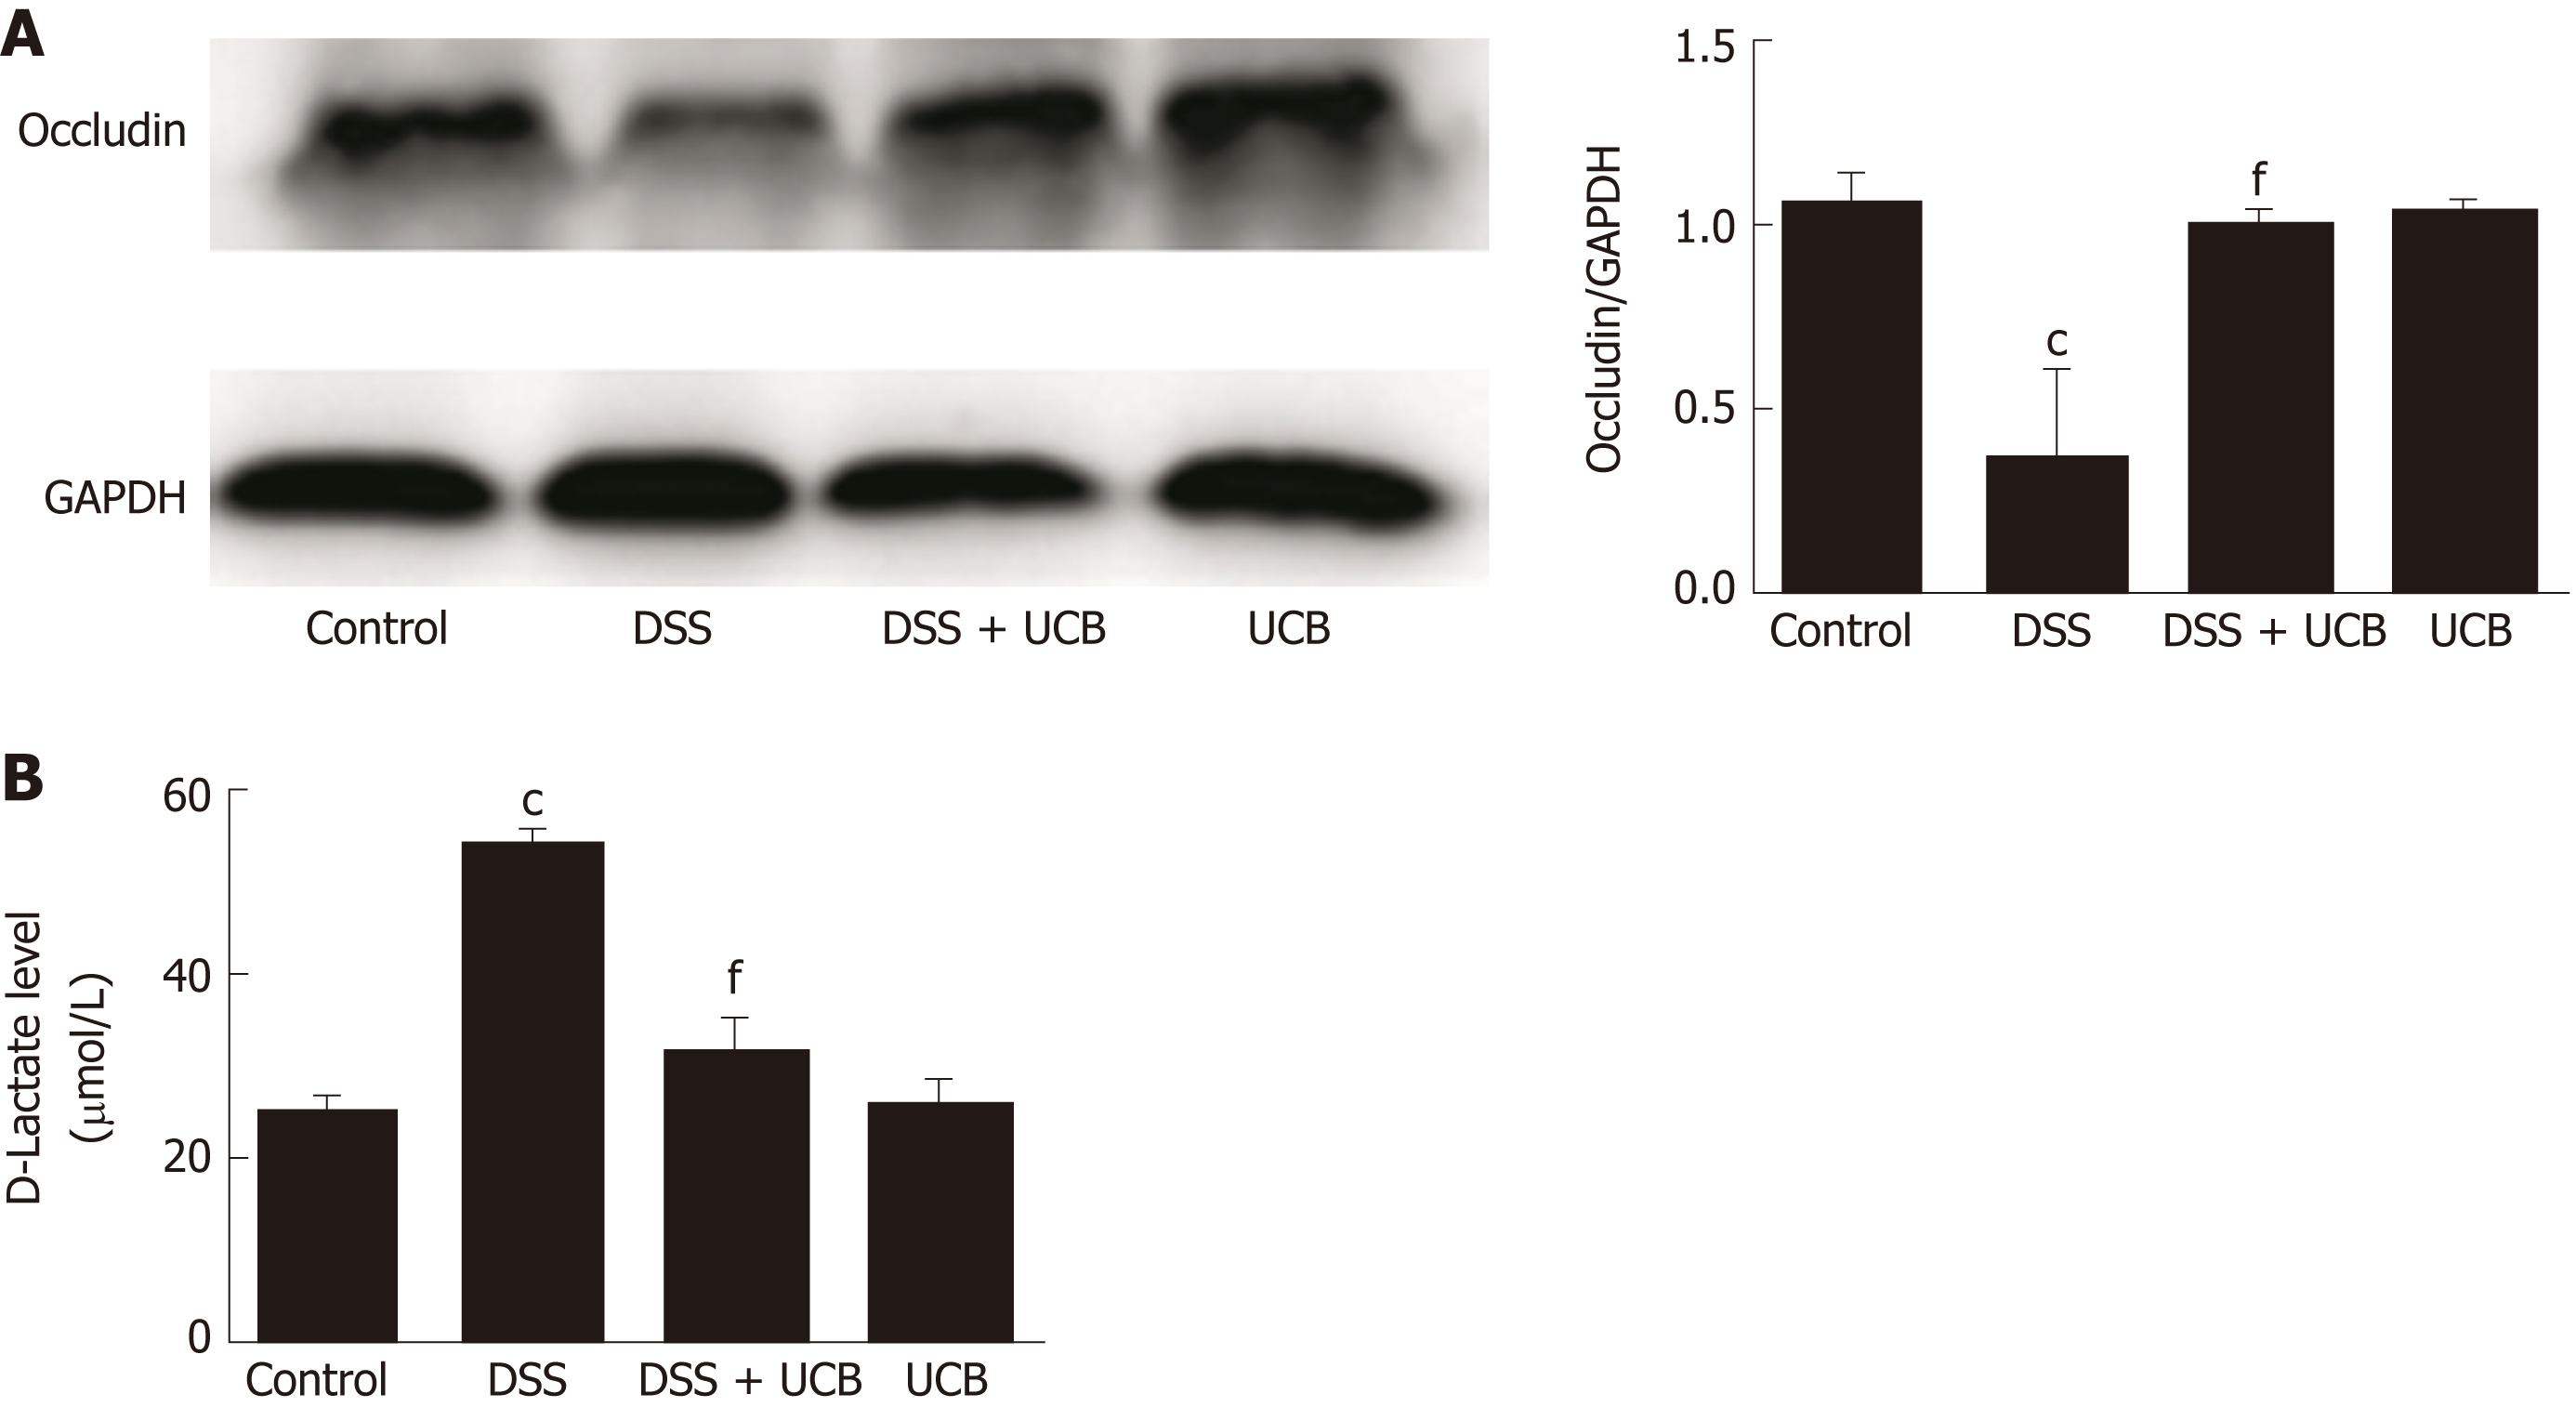
Figure 4 UCB increased expression of tight junction proteins in the colon and decreased intestinal permeability.
A: Protein expression of tight junction occludin (n = 3); B: D-Lactate level in serum (n = 5). Data are expressed as means ± SEM. cP < 0.001 vs control group, and fP < 0.001 vs DSS group. UCB: Unconjugated bilirubin; DSS: Dextran sodium sulfate; SEM: Standard error of the mean.
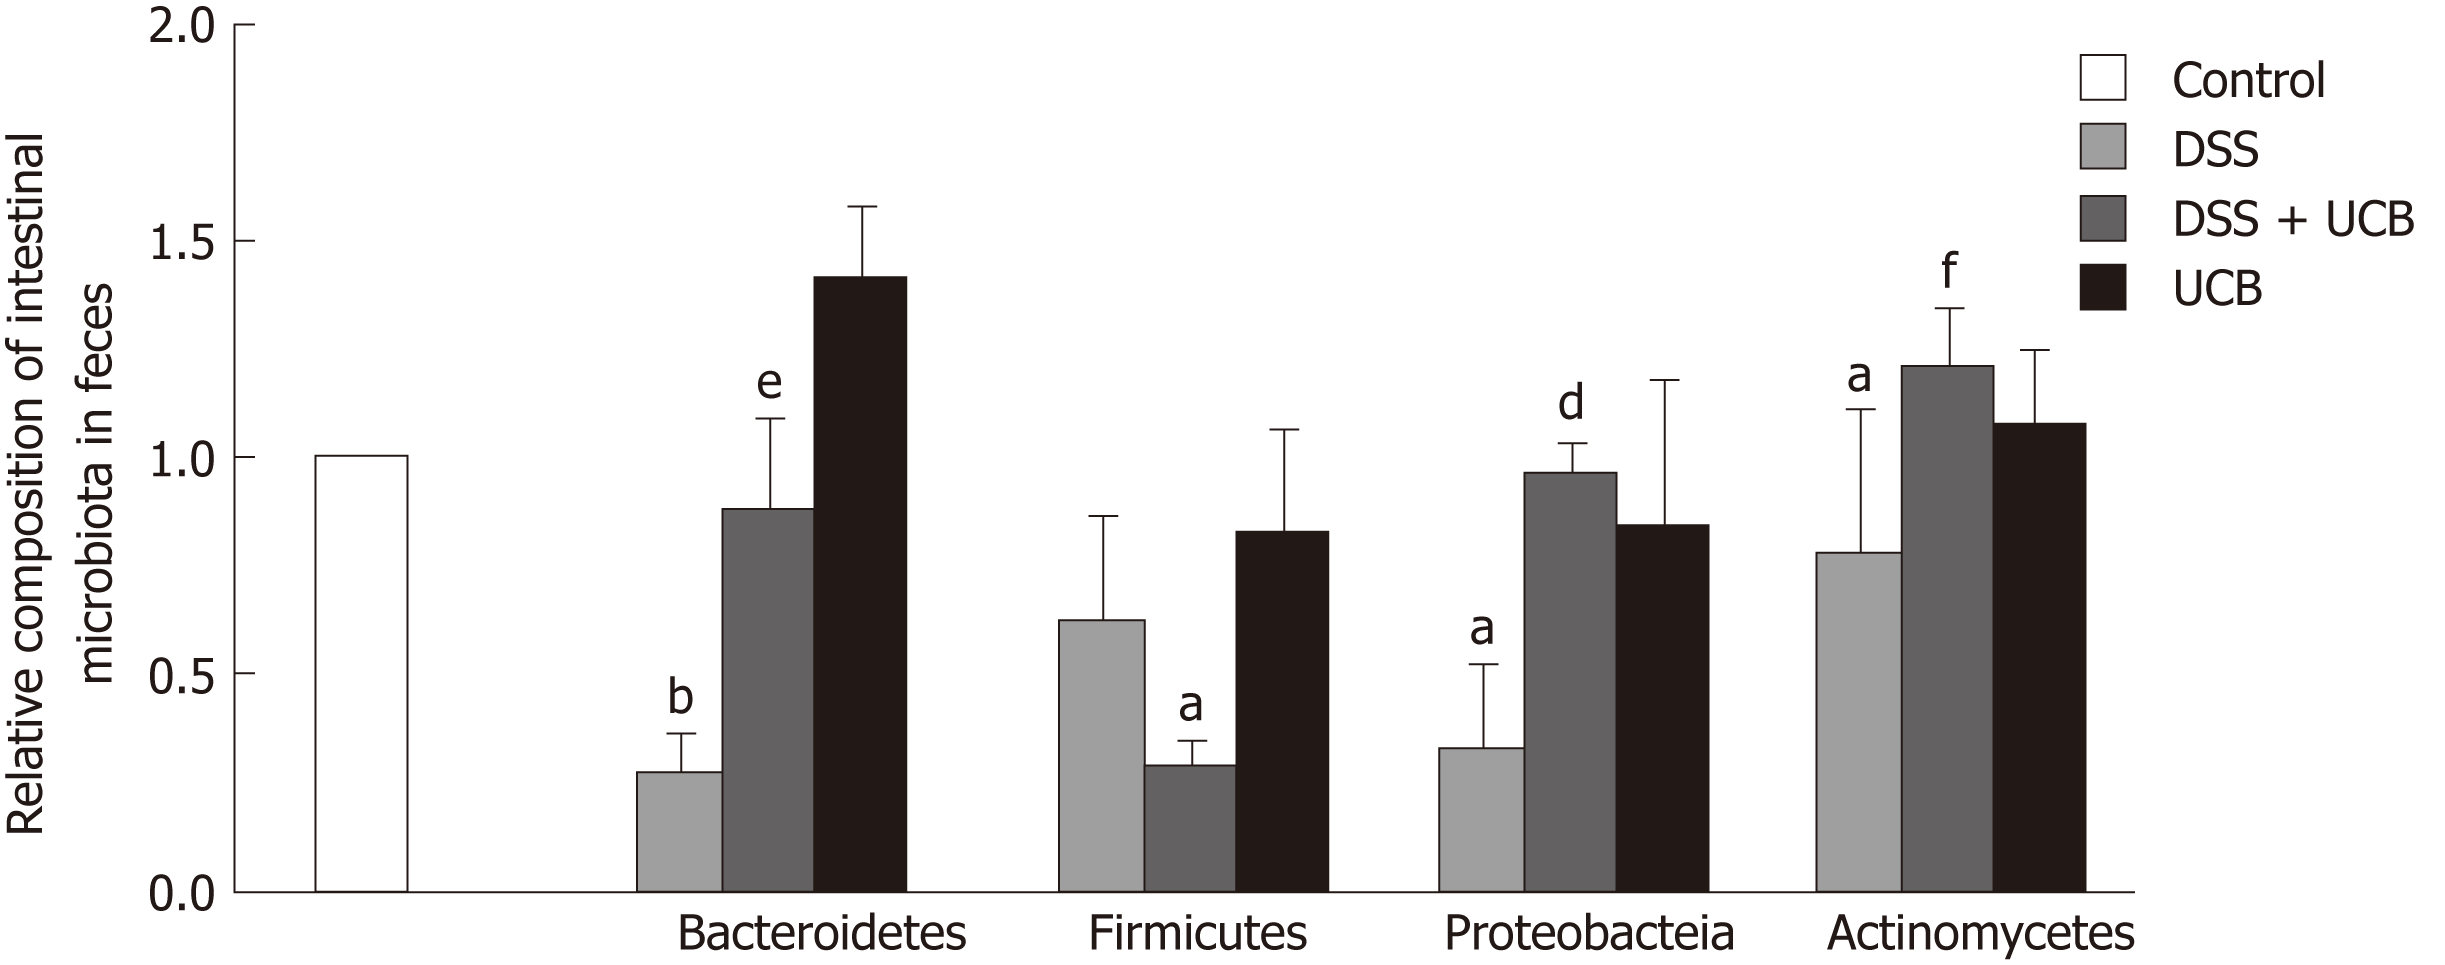
Figure 5 UCB maintained the steady state of intestinal flora of DSS induced colitis mice.
Data are expressed as means ± SEM (n = 5). aP < 0.05 and bP < 0.01 vs control group; eP < 0.01, and fP < 0.001 vs dextran sodium sulfate group. UCB: Unconjugated bilirubin; DSS: Dextran sodium sulfate; SEM: Standard error of the mean.
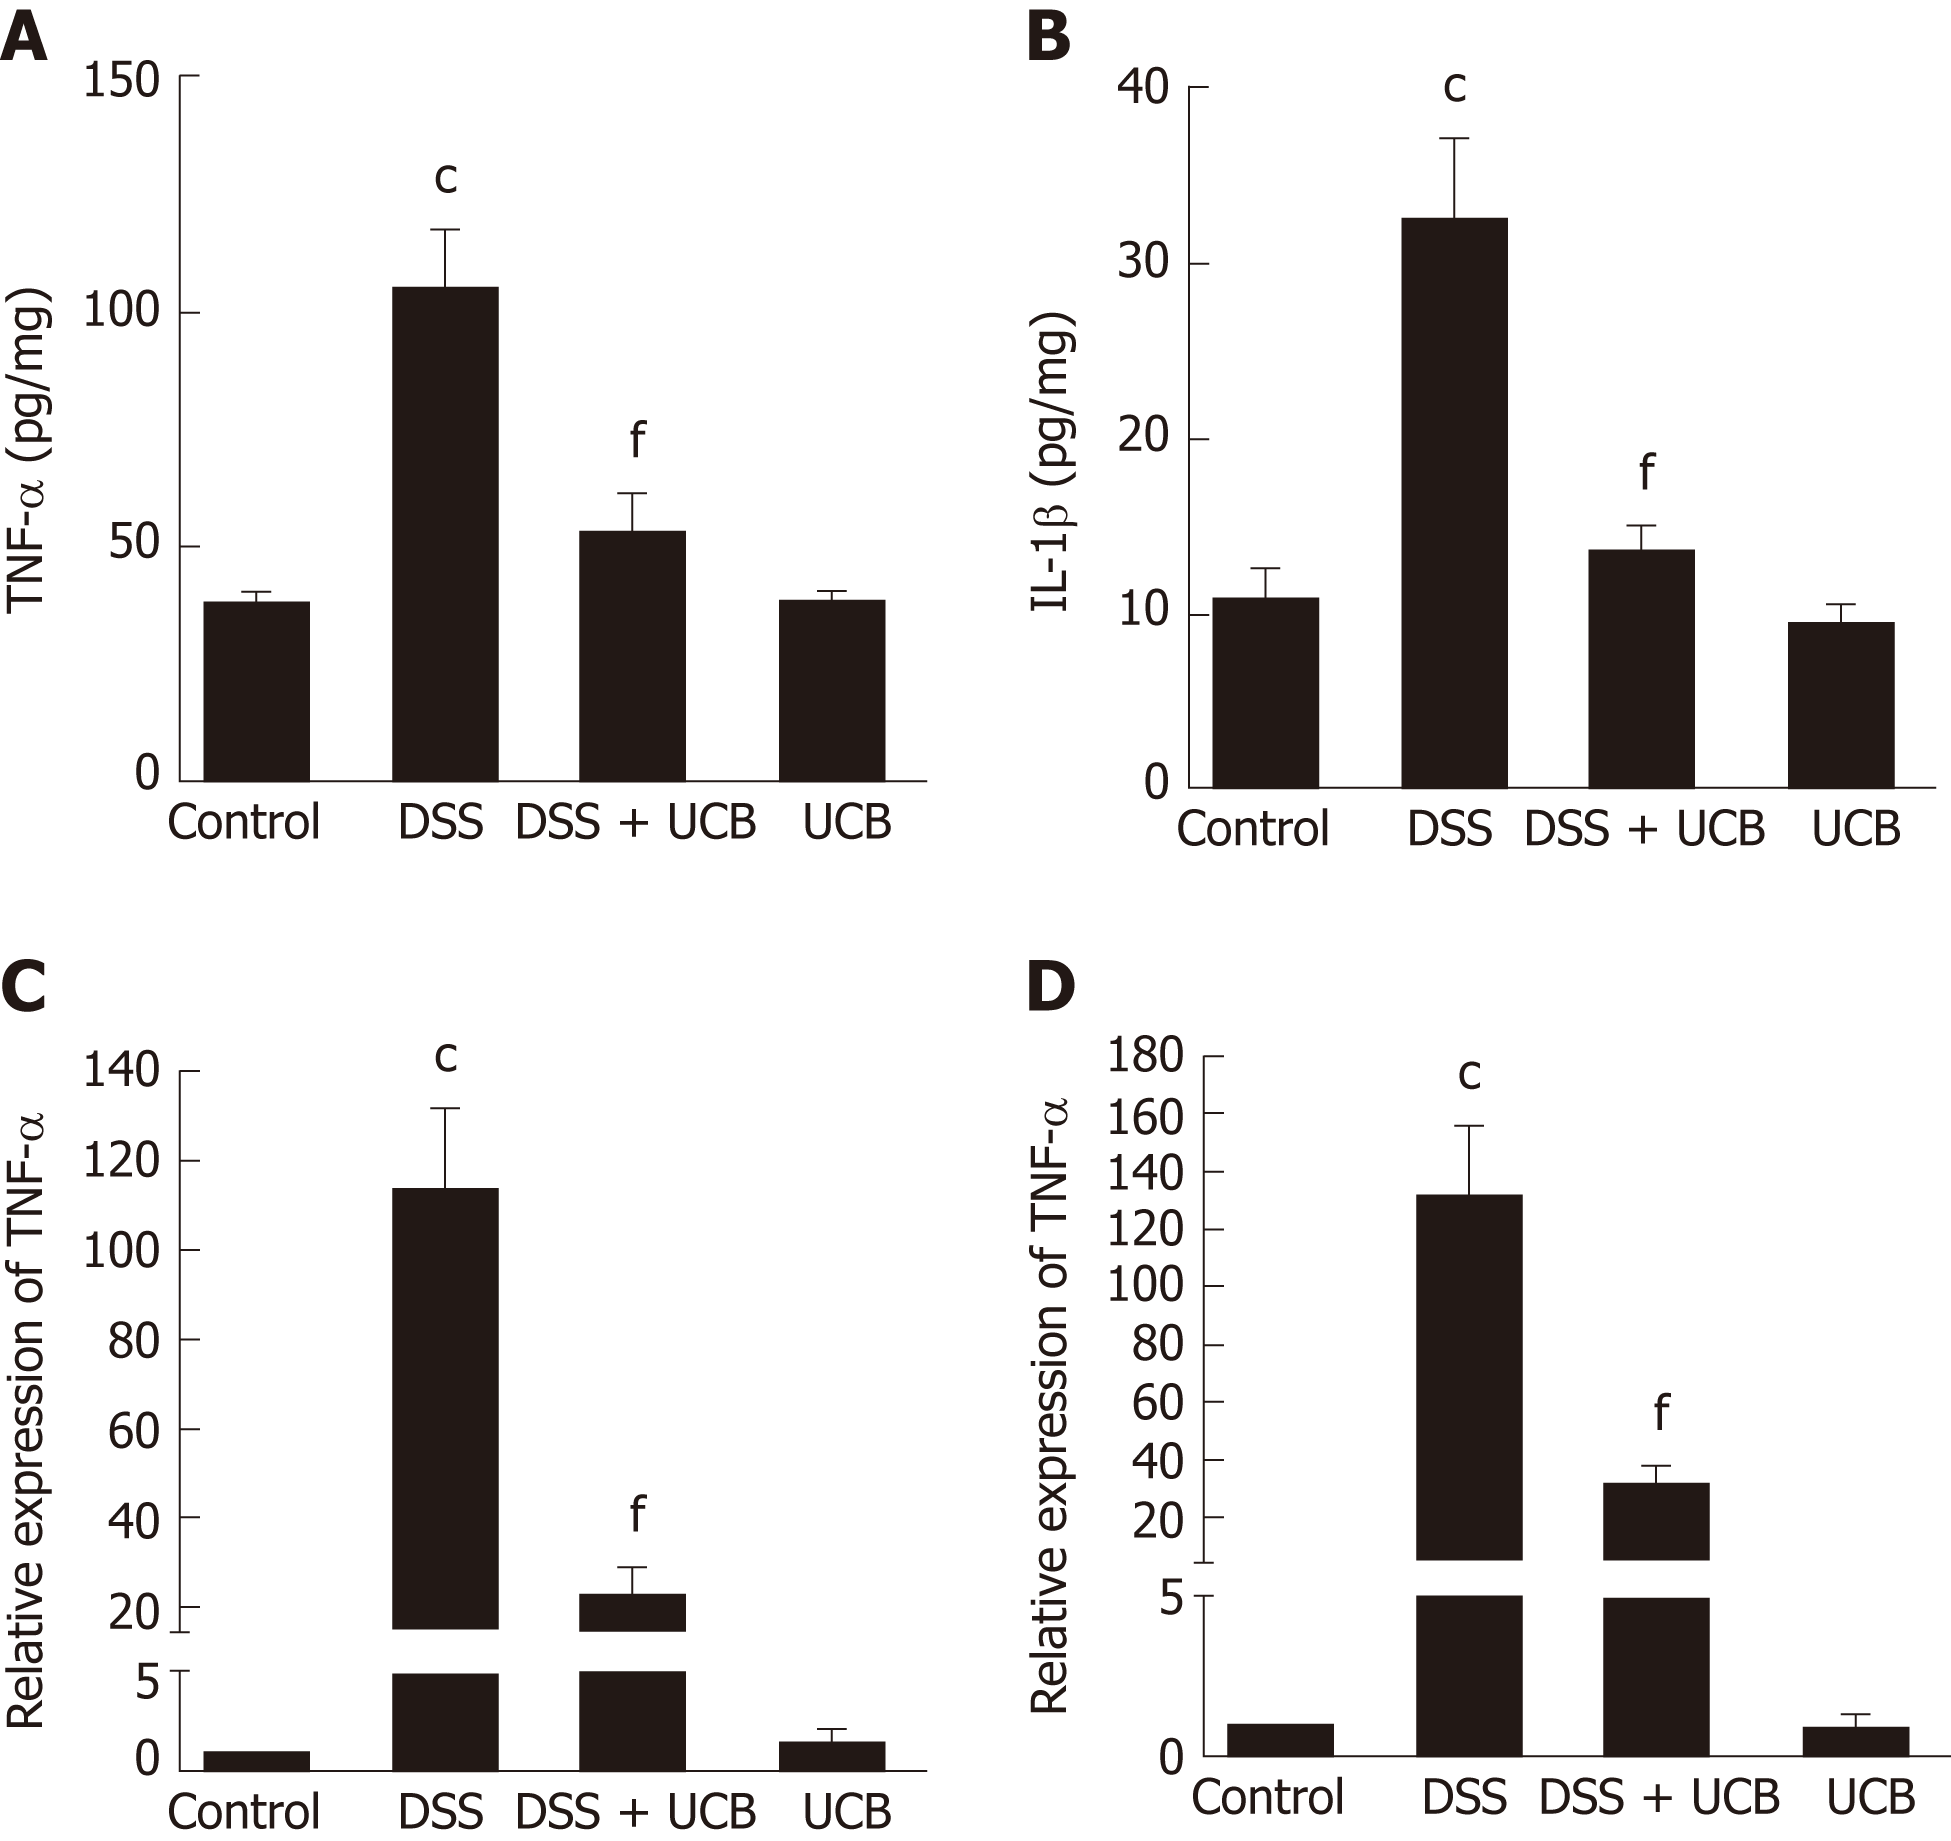
Figure 6 UCB reduced production of proinflammatory cytokines in DSS induced colitis mice.
A and B: Protein expression of TNF-α and IL-1β; C and D: mRNA transcript expression of TNF-α and IL-1β. Data are expressed as means ± SEM (n = 5). cP < 0.001 vs control group and fP < 0.001 vs DSS. UCB: Unconjugated bilirubin; DSS: Dextran sodium sulfate; TNF-α: Tumor necrosis factor α; IL-1β: Interleukin 1β; SEM: Standard error of the mean.
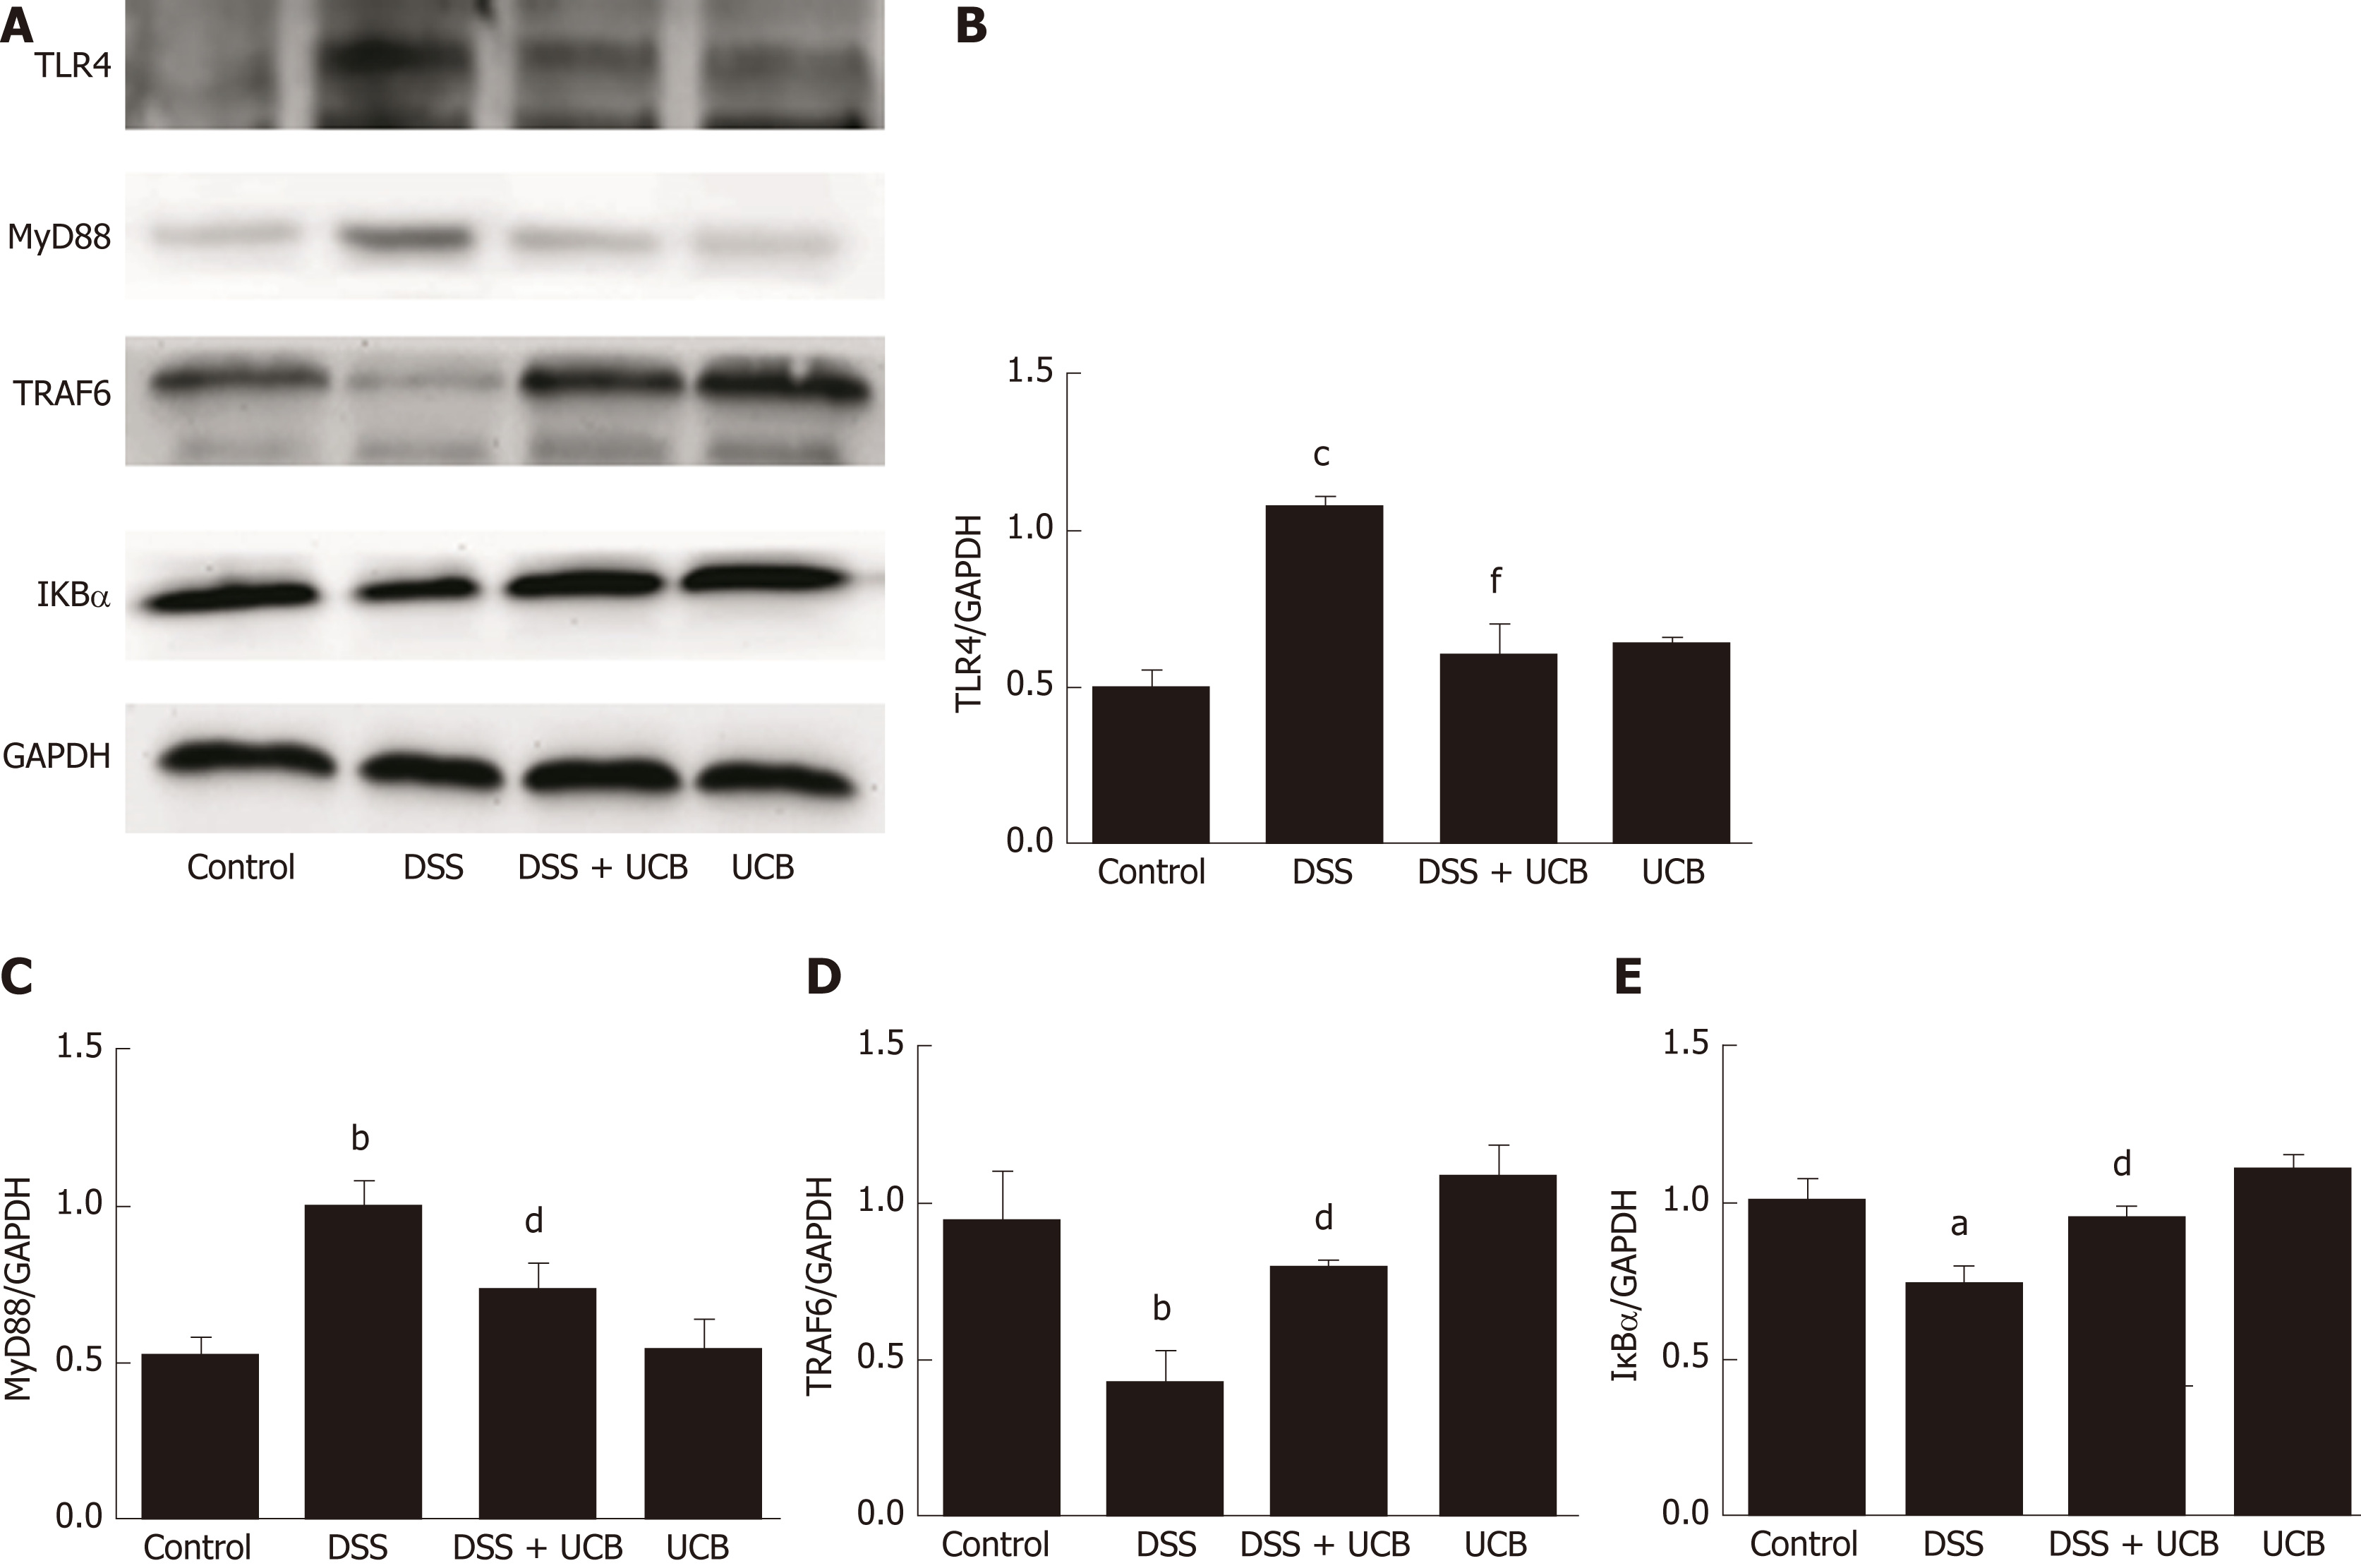
Figure 7 UCB inhibited the TLR4/MyD88/TRAF6/nuclear factor-κB signaling in DSS induced colitis mice.
A: Total protein from colon samples was extracted, and TLR4, MyD88, TRAF6, and IκBα protein expression was measured by western blotting; B-E: Quantification of TLR4, MyD88, TRAF6, and IκBα protein expression was performed by densitometric analysis of the blots. Data are expressed as means ± SEM (n = 3). aP < 0.05 and cP < 0.001 vs control group; dP < 0.05 and fP < 0.001 vs dextran sodium sulfate group. UCB: Unconjugated bilirubin; DSS: Dextran sodium sulfate; TLR4: Toll-like receptor 4; MyD88: Myeloid differentiation primary response gene 88; TRAF6: Tumor necrosis factor receptor-associated factor 6; IκBα: Anti-inhibitor of nuclear factor-κB alpha.
- Citation: Zheng JD, He Y, Yu HY, Liu YL, Ge YX, Li XT, Li X, Wang Y, Guo MR, Qu YL, Qin XF, Jiang MS, Wang XH. Unconjugated bilirubin alleviates experimental ulcerative colitis by regulating intestinal barrier function and immune inflammation. World J Gastroenterol 2019; 25(15): 1865-1878
- URL: https://www.wjgnet.com/1007-9327/full/v25/i15/1865.htm
- DOI: https://dx.doi.org/10.3748/wjg.v25.i15.1865


