Copyright
©The Author(s) 2019.
World J Gastroenterol. Apr 21, 2019; 25(15): 1840-1853
Published online Apr 21, 2019. doi: 10.3748/wjg.v25.i15.1840
Published online Apr 21, 2019. doi: 10.3748/wjg.v25.i15.1840
Figure 1 Cetuximab induces autophagy and upregulates 4E-BP1 expression and autophagy enhances anti-cancer effect of cetuximab in colon cancer.
A: CACO-2 cell viability measured using MTT assay. Cell viability was significantly inhibited in a time- and dose-dependent manner by cetuximab. B: Cetuximab induced formation of autophagosomes. Autophagosomes in CACO-2 cells treated by cetuximab or not were examined by fluorescence microscopy. More autophagosomes were found in CACO-2 cells after treatment with cetuximab. C: Western blot analysis showing that cetuximab induced autophagy. (a) CACO-2 cells were either untreated or treated with cetuximab and Baf, and Baf inhibited autophagy-related protein degradation. Microtubule-associated protein 1A/B-light chain 3 (LC3)-II/LC3-I was increased, and P62 was decreased when treated with cetuximab, and both LC3 and P62 were increased when treated with cetuximab and Baf compared to treatment with cetuximab alone. (b and c) Cetuximab induced autophagy in a concentration and time dependent manner. With time and increasing concentration, the expression of LC3 increased, and P62 declined. (d) CACO-2 cells were treated with cetuximab for 48 h, and the expression of 4E-binding protein 1 was increased as the concentration of cetuximab increased. D: Effect of autophagy on cetuximab inhibition of cell proliferation. We added PBS, cetuximab, cetuximab + Beclin1-siRNA, and cetuximab + NC-siRNA separately, and the concentration of cetuximab was 78 µg/mL; then, cells were treated for 72 h. The results confirmed that autophagy enhanced cetuximab inhibition of cell proliferation in CACO-2 cells. LC3: Microtubule-associated protein 1A/B-light chain 3; 4E-BP1: 4E-binding protein 1.
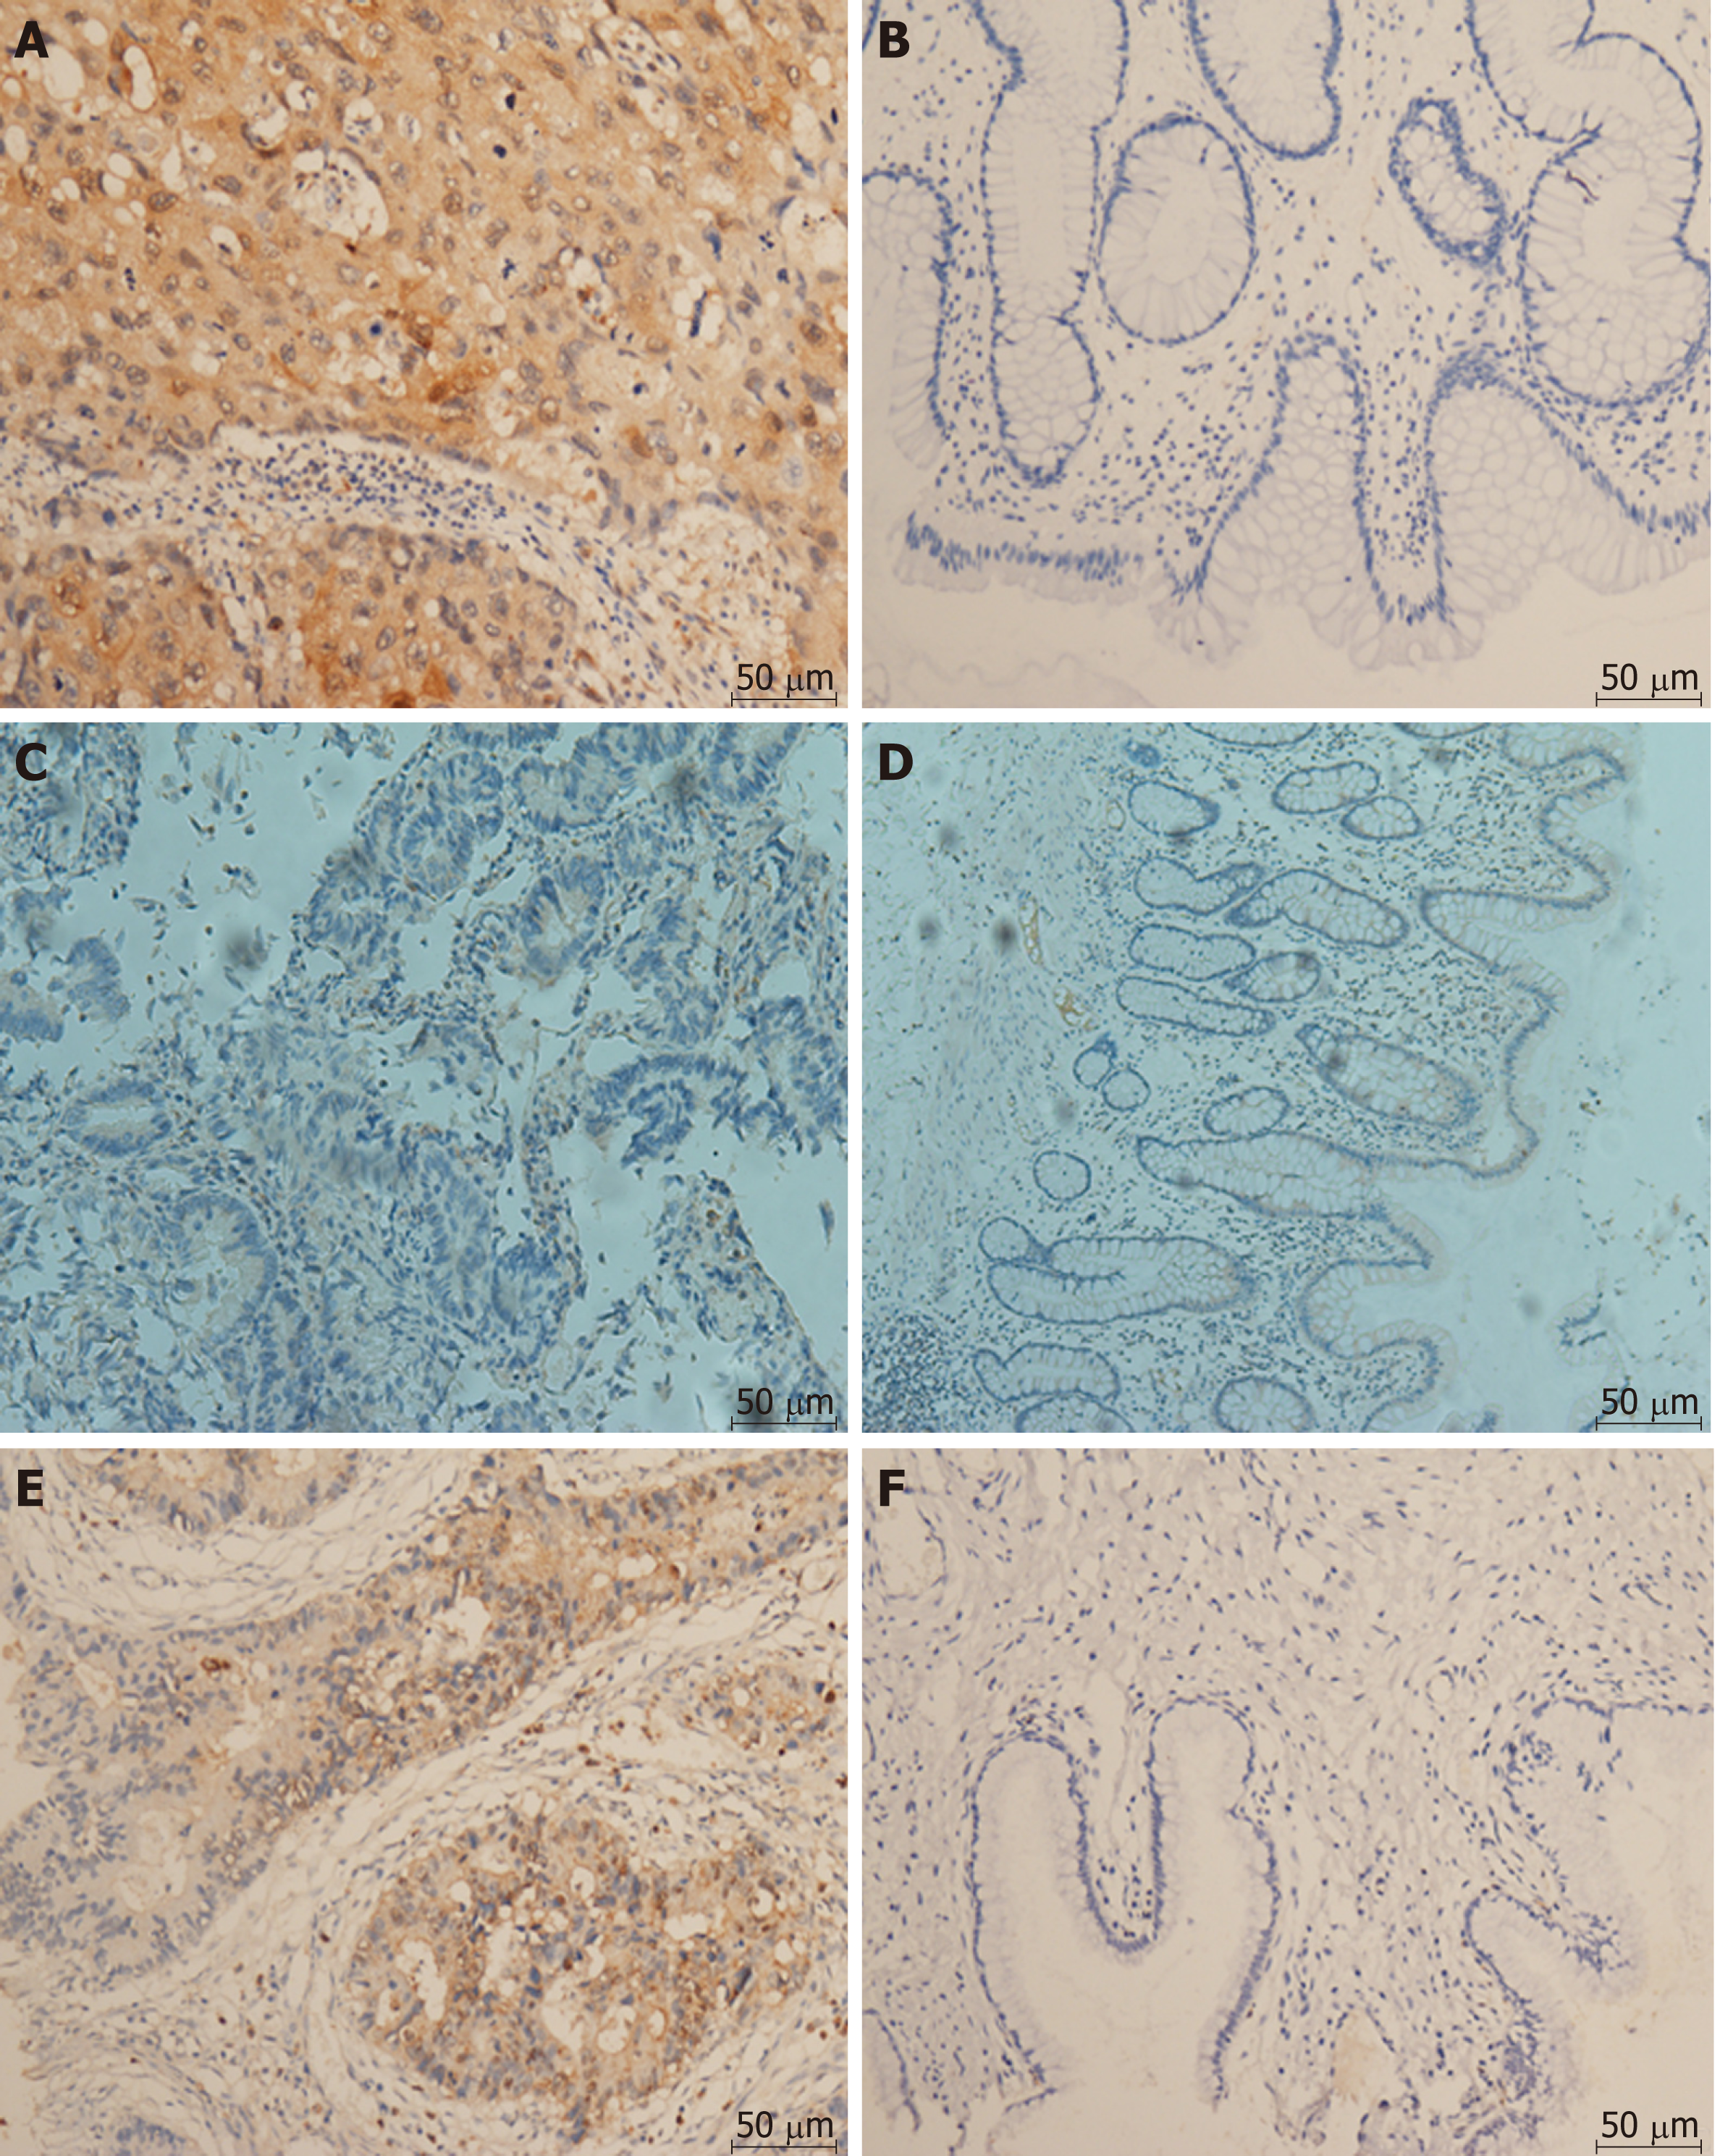
Figure 2 Immunohistochemical staining (200×).
A: LC3 displayed strong cytoplasm staining in colorectal cancer tissue; B: LC3 displayed weak cytoplasm staining in normal tissue; C: Beclin1 displayed strong cytoplasm staining in colorectal cancer tissue; D: Beclin1 displayed weak cytoplasm staining in normal tissue; E: 4E-BP1 displayed strong cytoplasm staining in colorectal cancer tissue; F: 4E-BP1 displayed weak cytoplasm staining in normal tissue.
Figure 3 Differential expression of Beclin-1, LC3, and 4E-BP1 tested by immunohistochemical staining in colorectal cancer samples compared to normal tissues.
LC3 (P < 0.001) showed higher expression in cancer than in normal tissue, while Beclin-1 (P = 0.248) and 4E-binding protein 1 (P = 0.793) did not. LC3: Microtubule-associated protein 1A/B-light chain 3; 4E-BP1: 4E-binding protein 1.
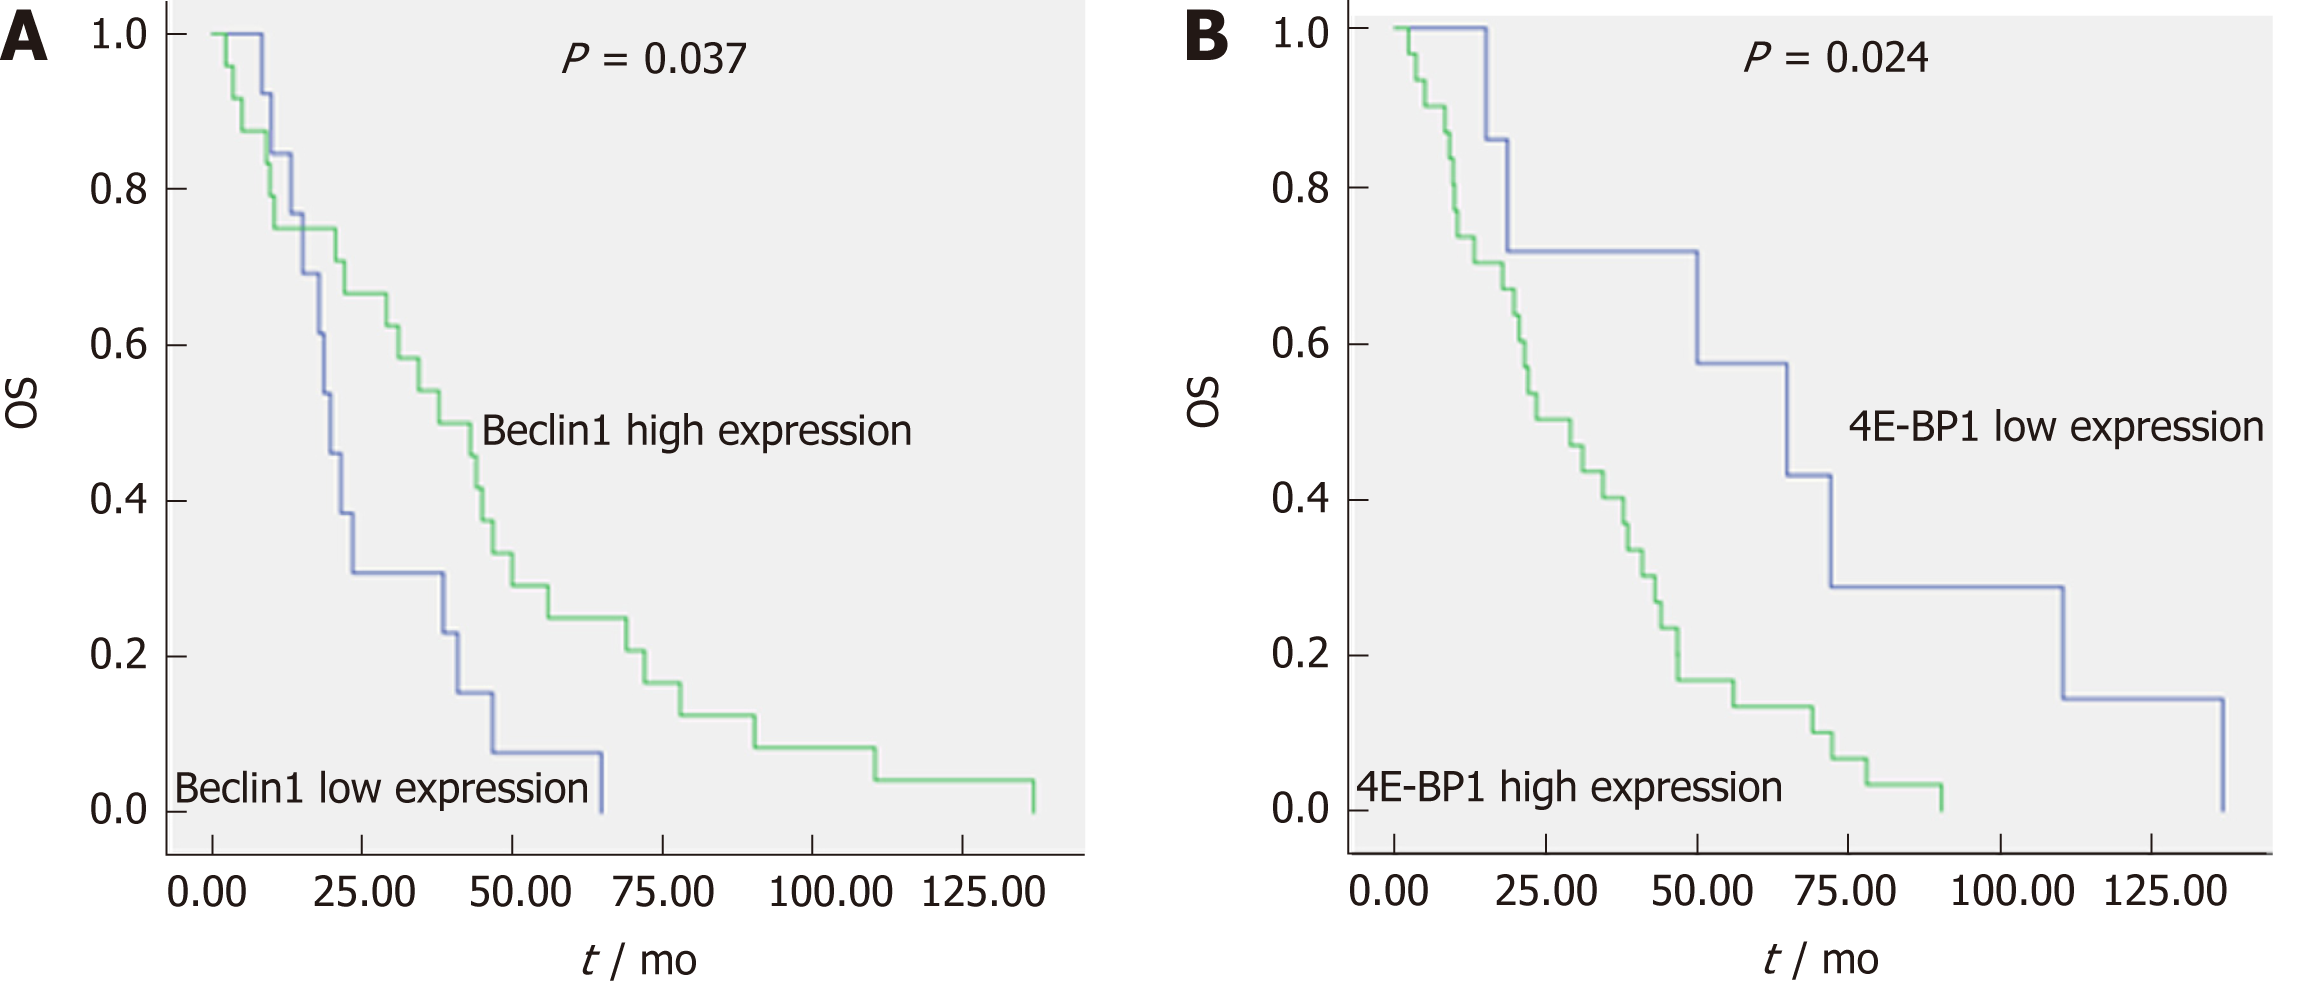
Figure 4 The expression levels of Beclin1 and 4E-binding protein 1 are independent prognostic factors for overall survival of advanced colorectal cancer patients initially treated with cetuximab-containing chemotherapy.
A: The median overall survival (OS) of patients with low and high Beclin1 expression (low expression was defined as an immunohistochemistry score ≤ 0, and high expression was defined as a score > 0) was 19.65 mo vs 37.82 mo, respectively. B: The median OS of patients with low and high 4E-BP1 expression (low expression was defined as an immunohistochemistry score ≤ 0, and high expression was defined as a score > 0) was 64.82 mo vs 23.66 mo, respectively. OS: Overall survival; 4E-BP1: 4E-binding protein 1.
- Citation: Guo GF, Wang YX, Zhang YJ, Chen XX, Lu JB, Wang HH, Jiang C, Qiu HQ, Xia LP. Predictive and prognostic implications of 4E-BP1, Beclin-1, and LC3 for cetuximab treatment combined with chemotherapy in advanced colorectal cancer with wild-type KRAS: Analysis from real-world data. World J Gastroenterol 2019; 25(15): 1840-1853
- URL: https://www.wjgnet.com/1007-9327/full/v25/i15/1840.htm
- DOI: https://dx.doi.org/10.3748/wjg.v25.i15.1840


