Copyright
©The Author(s) 2019.
World J Gastroenterol. Apr 21, 2019; 25(15): 1828-1839
Published online Apr 21, 2019. doi: 10.3748/wjg.v25.i15.1828
Published online Apr 21, 2019. doi: 10.3748/wjg.v25.i15.1828
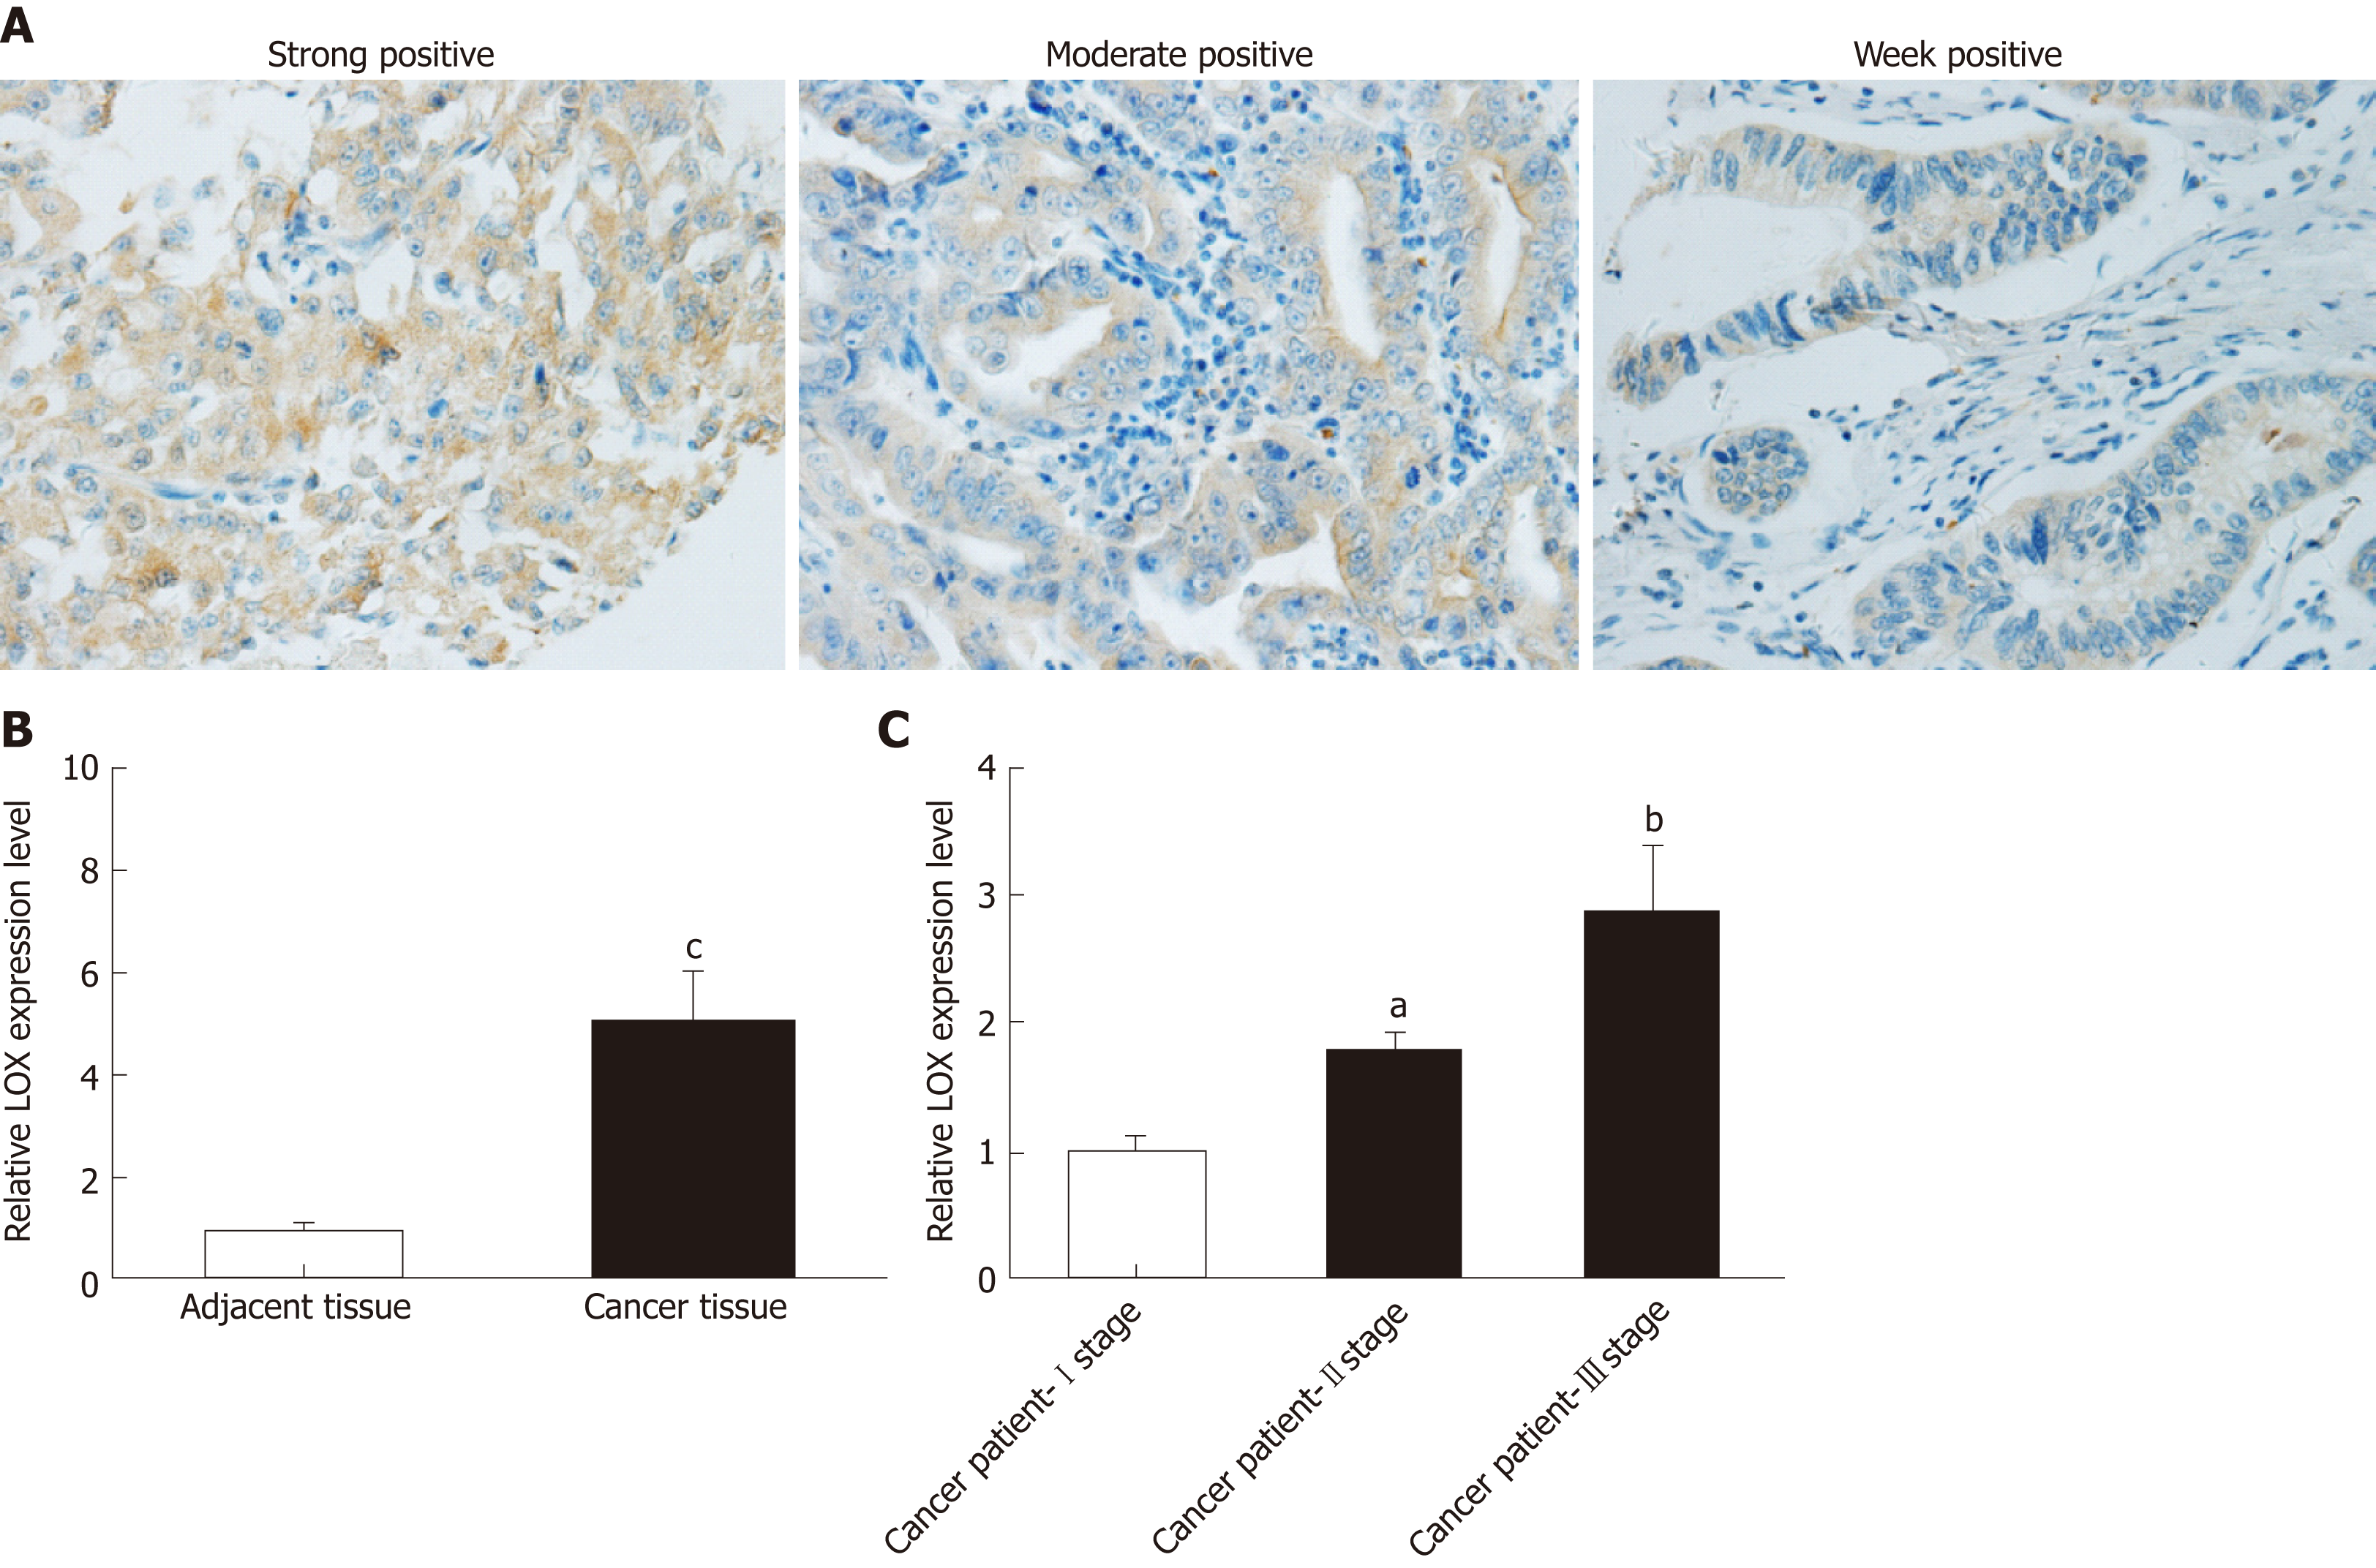
Figure 1 Expression of LOX in GC patients.
A: Immunohistochemical staining was used to detect expression of LOX in tumor tissues from patients with GC; B: qRT-PCR was performed to measure mRNA expression of LOX in adjacent tissues and cancer tissues from GC patients; C: qRT-PCR was performed to examine the expression level of LOX in patients with GC. aP < 0.05, bP < 0.01 and cP < 0.001 represent significant difference compared with controls. LOX: Lysyl oxidase; GC: Gastric cancer; qRT-PCR: Quantitative reverse transcription polymerase chain reaction.
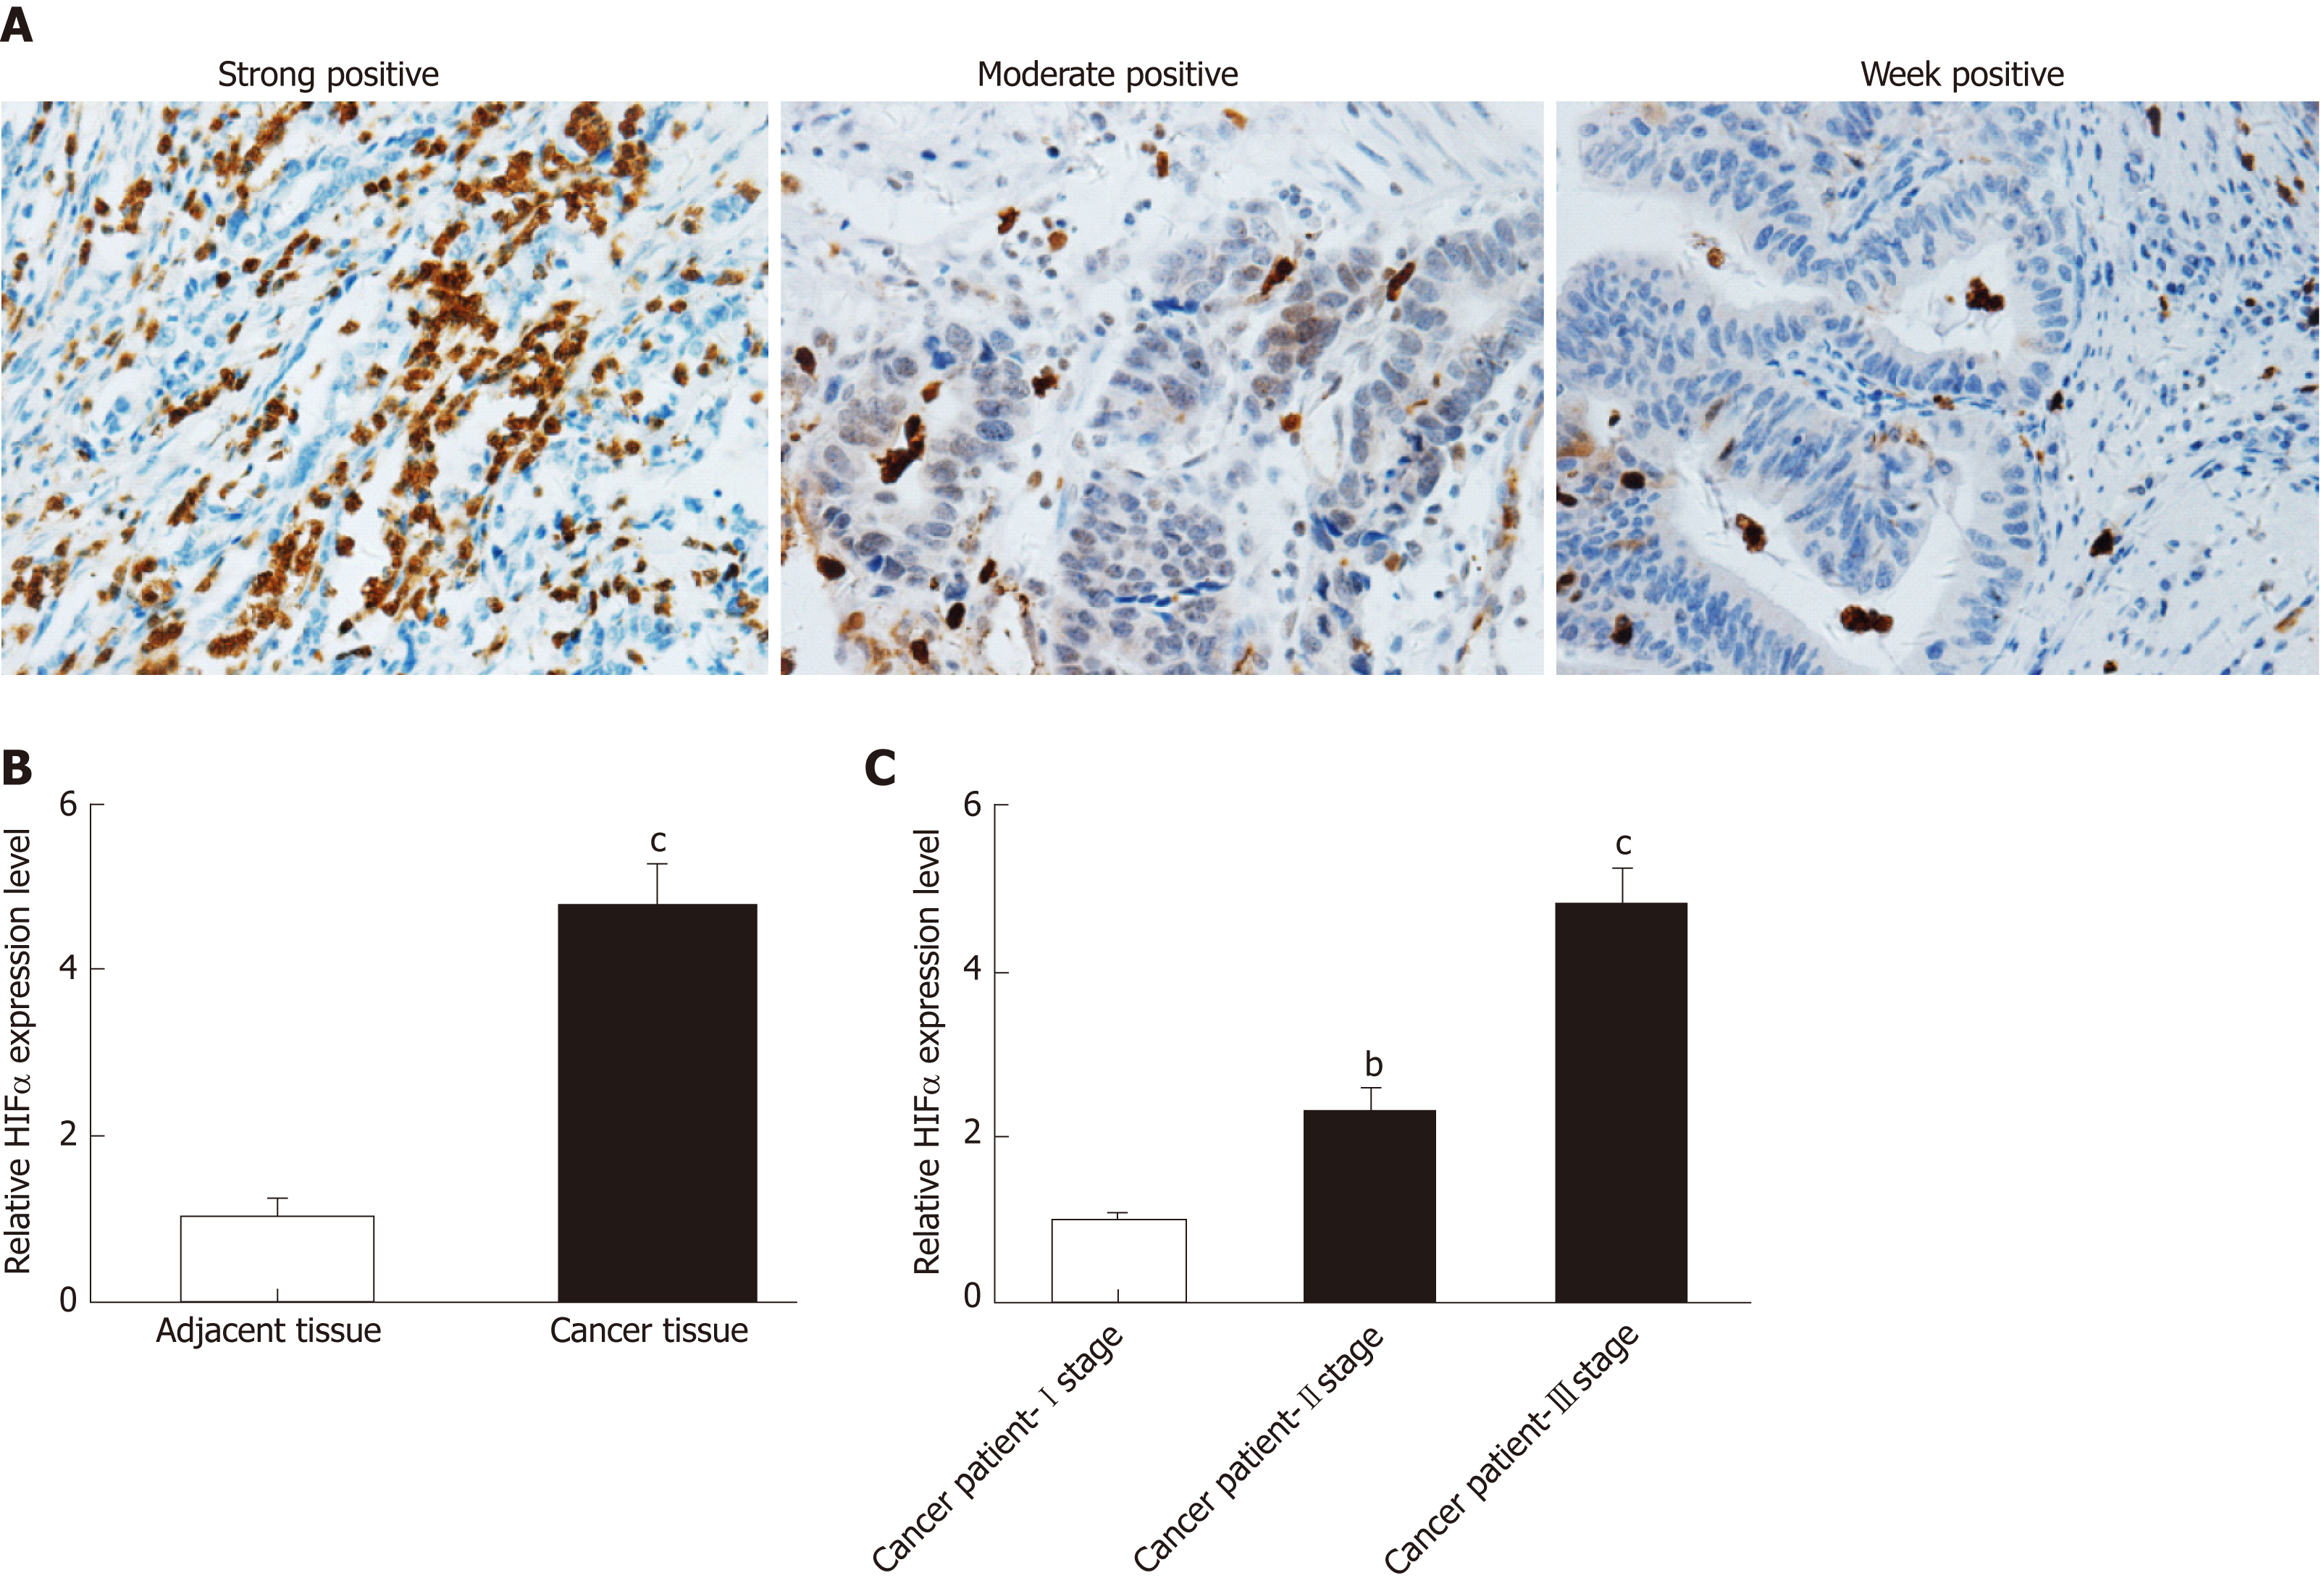
Figure 2 Expression of HIF1α in patients with GC.
A: Immunohistochemical analysis of HIF1α in tumor tissues from patients with GC; B: qRT-PCR was applied to measure mRNA expression of HIF1α in adjacent tissues and cancer tissues from GC patients; C: qRT-PCR was used to detect the level of HIF1α in patients with GC. aP < 0.05, bP < 0.01 and cP < 0.001 represent significant difference compared with controls. HIF1α: Hypoxia-inducible factor 1α; GC: Gastric cancer; qRT-PCR: Quantitative reverse transcription polymerase chain reaction.
Figure 3 LOX expression is associated with DFS and OS.
A: DFS curve of patients with GC with regards to lysyl oxidase expression, aP < 0.05; B: Survival analysis of overall survival in patients with GC, aP < 0.05. LOX: Lysyl oxidase; GC: Gastric cancer; DFS: Disease-free survival; OS: Overall survival.
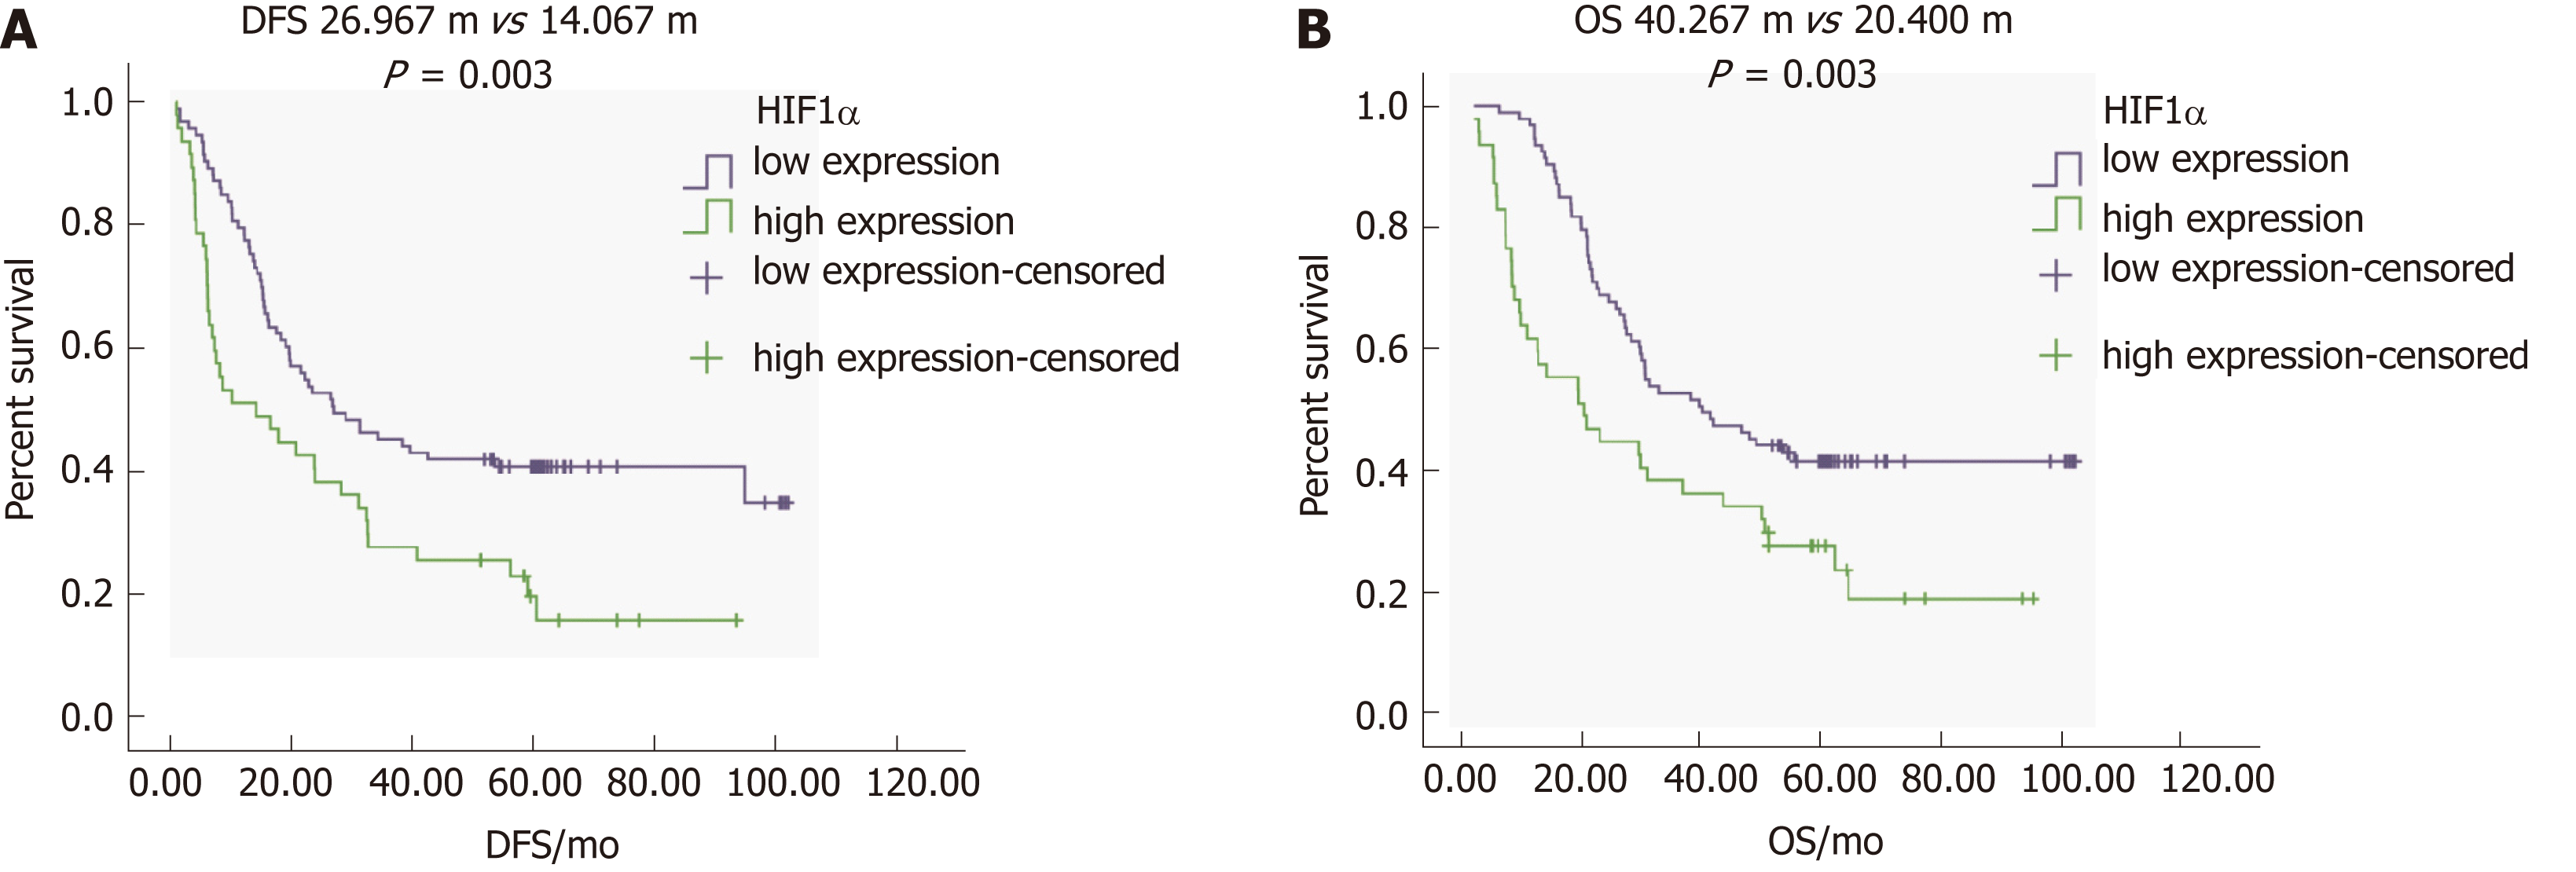
Figure 4 HIF1α correlates with DFS and OS of patients with GC.
A: DFS curve of patients with GC with respect to HIF1α expression, aP < 0.05; B: OS curve of patients with GC expressing low and high HIF1α levels. aP < 0.05. GC: Gastric cancer; DFS: Disease-free survival; OS: Overall survival; HIF1α: Hypoxia-inducible factor 1α.
- Citation: Han YL, Chen L, Qin R, Wang GQ, Lin XH, Dai GH. Lysyl oxidase and hypoxia-inducible factor 1α: biomarkers of gastric cancer. World J Gastroenterol 2019; 25(15): 1828-1839
- URL: https://www.wjgnet.com/1007-9327/full/v25/i15/1828.htm
- DOI: https://dx.doi.org/10.3748/wjg.v25.i15.1828


