Copyright
©The Author(s) 2019.
World J Gastroenterol. Apr 7, 2019; 25(13): 1603-1617
Published online Apr 7, 2019. doi: 10.3748/wjg.v25.i13.1603
Published online Apr 7, 2019. doi: 10.3748/wjg.v25.i13.1603
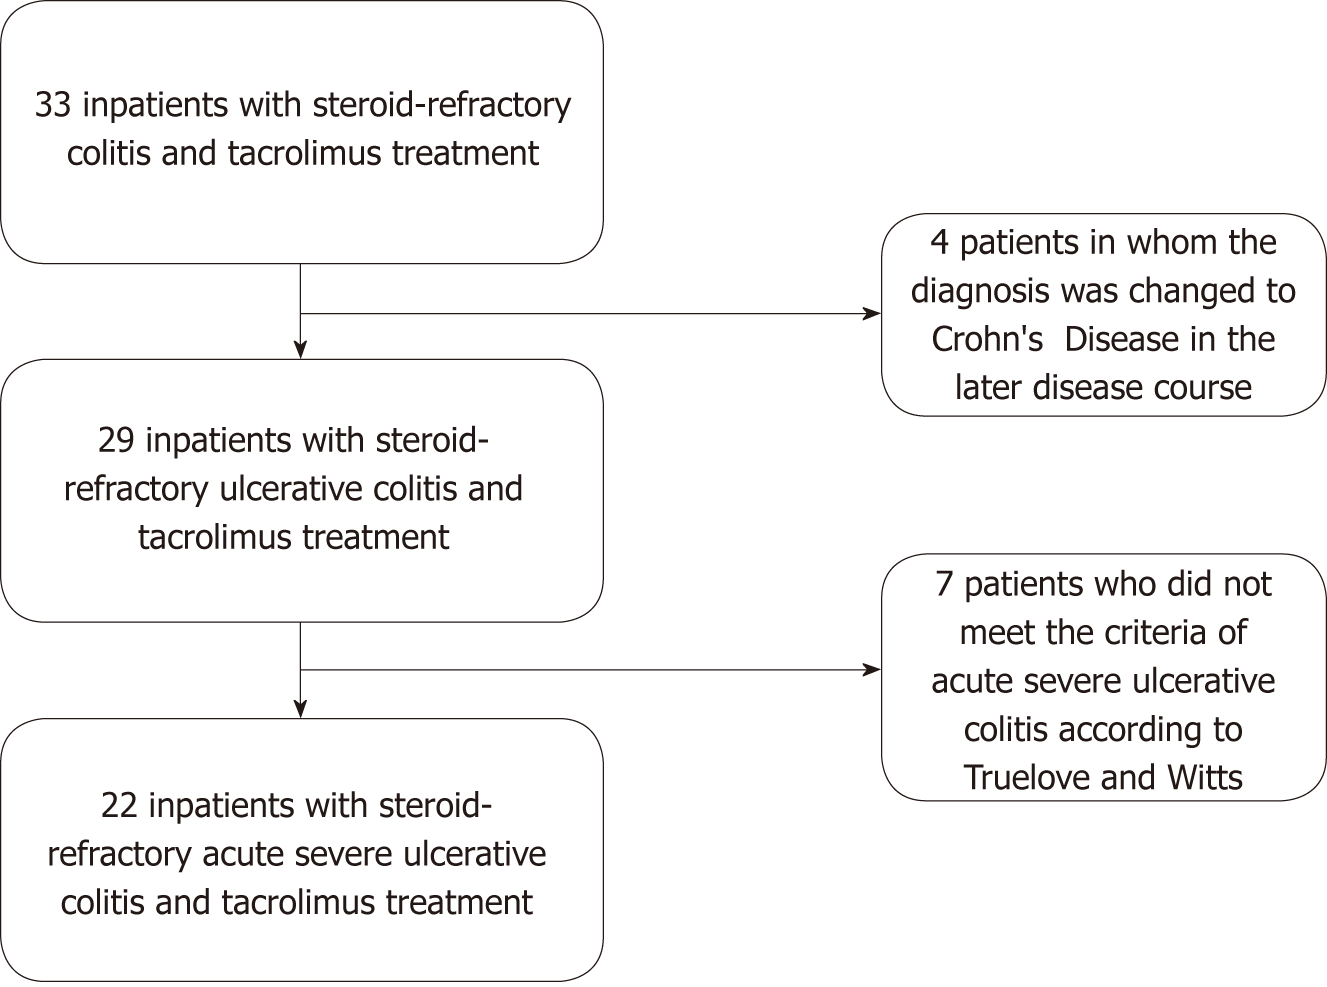
Figure 1 Flow diagram for patient inclusion and exclusion.
Finally, 22 patients who met the inclusion criteria were enrolled in the study.
Figure 2 Detailed information on the reasons for which tacrolimus treatment was discontinued.
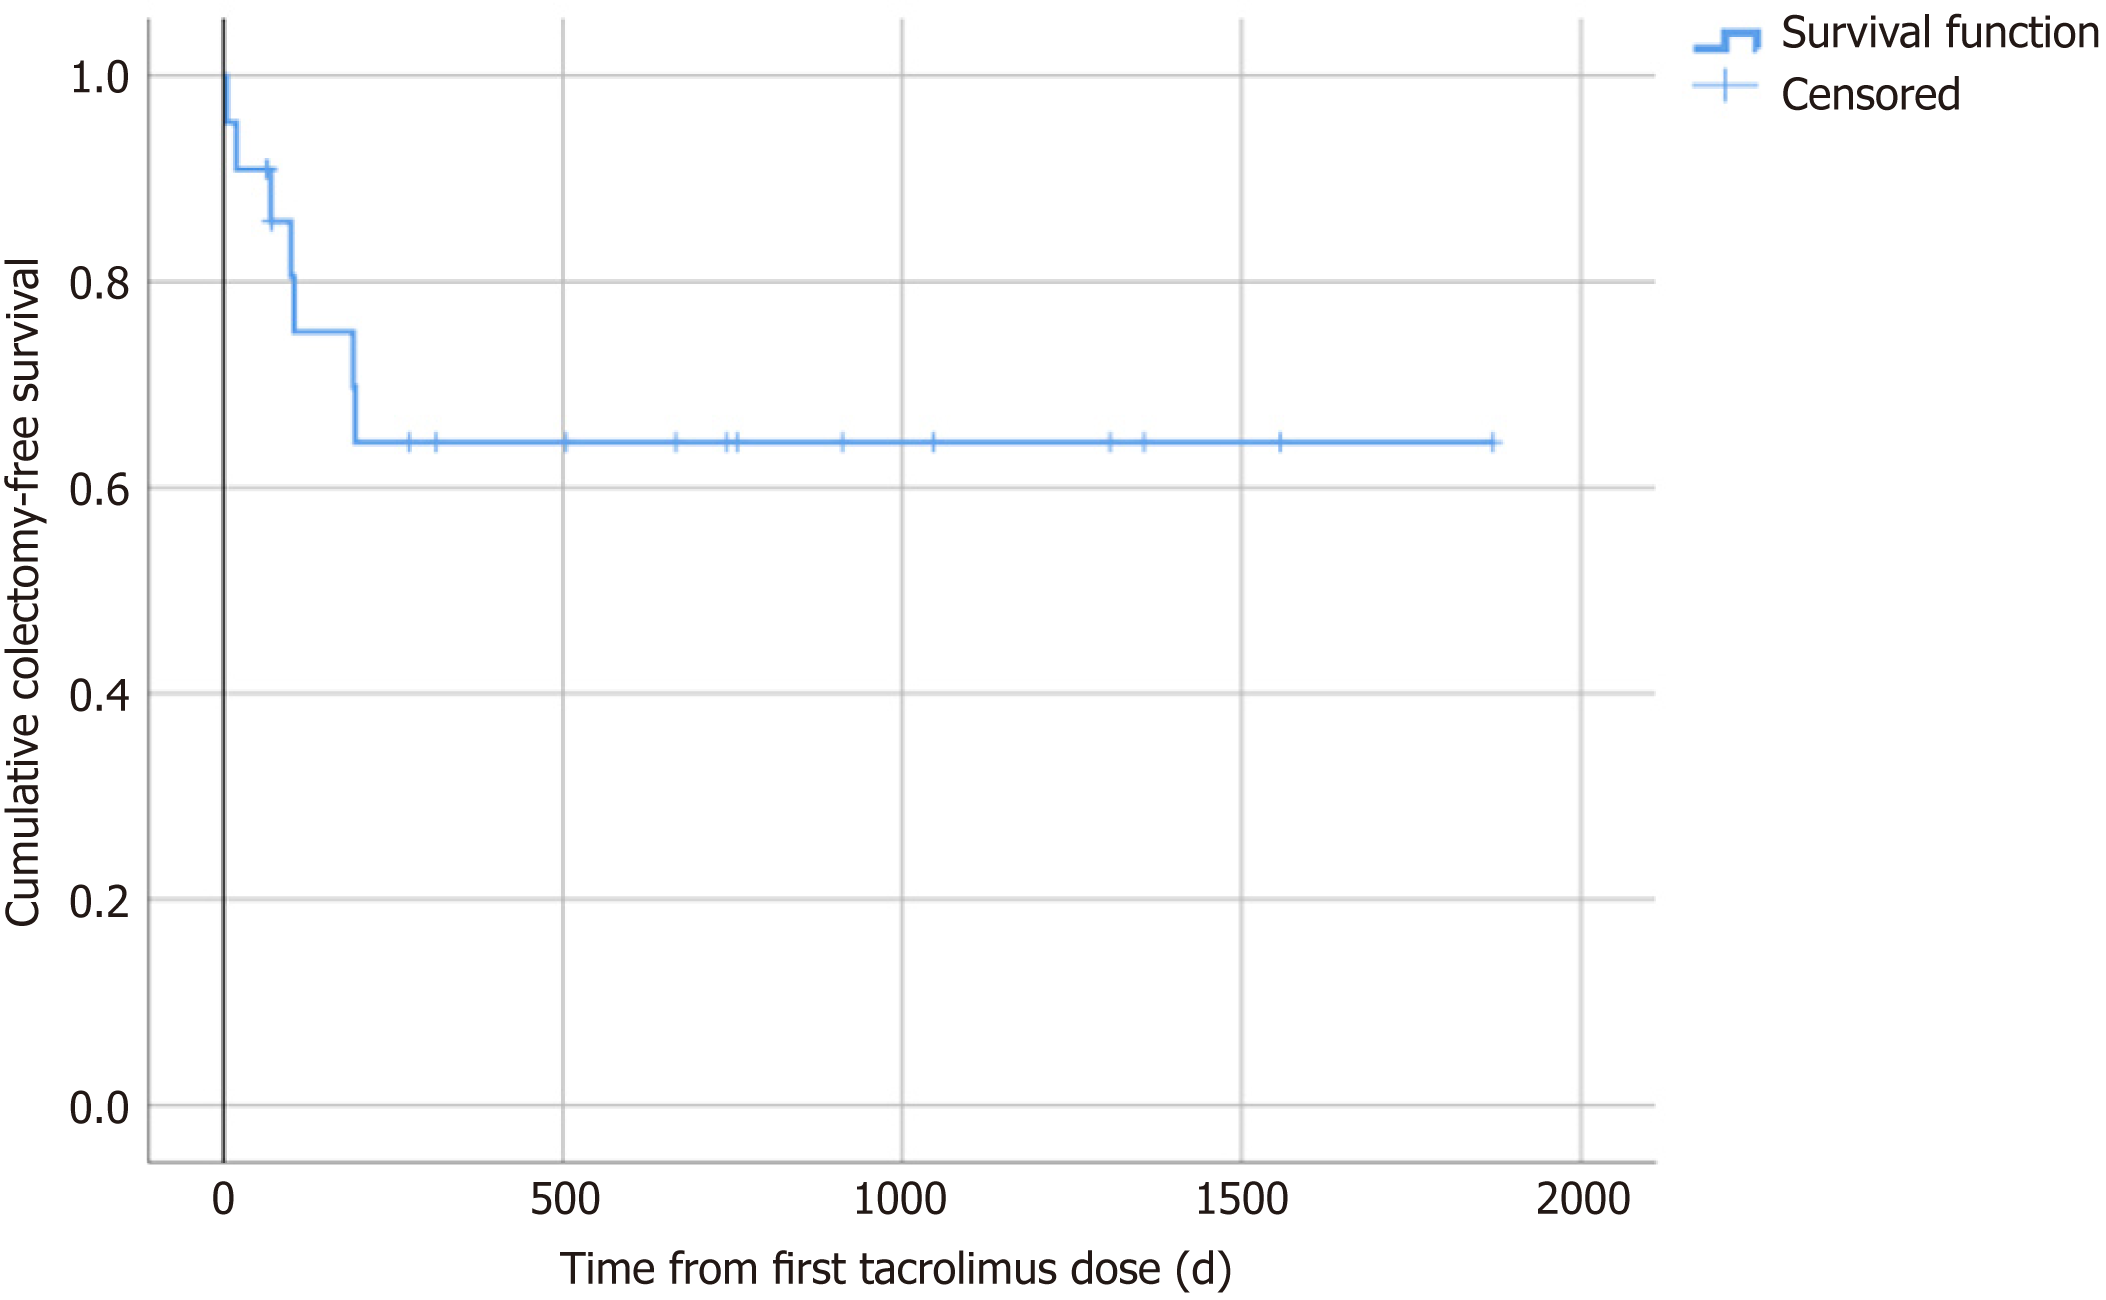
Figure 3 Kaplan-Meier plot of colectomy-free survival after initiation of tacrolimus therapy.
Vertical lines in the curve (“censored”) demonstrate the duration of follow-up and do not necessarily indicate loss to follow-up.
- Citation: Hoffmann P, Wehling C, Krisam J, Pfeiffenberger J, Belling N, Gauss A. Performance of tacrolimus in hospitalized patients with steroid-refractory acute severe ulcerative colitis. World J Gastroenterol 2019; 25(13): 1603-1617
- URL: https://www.wjgnet.com/1007-9327/full/v25/i13/1603.htm
- DOI: https://dx.doi.org/10.3748/wjg.v25.i13.1603


