Copyright
©The Author(s) 2019.
World J Gastroenterol. Apr 7, 2019; 25(13): 1580-1591
Published online Apr 7, 2019. doi: 10.3748/wjg.v25.i13.1580
Published online Apr 7, 2019. doi: 10.3748/wjg.v25.i13.1580
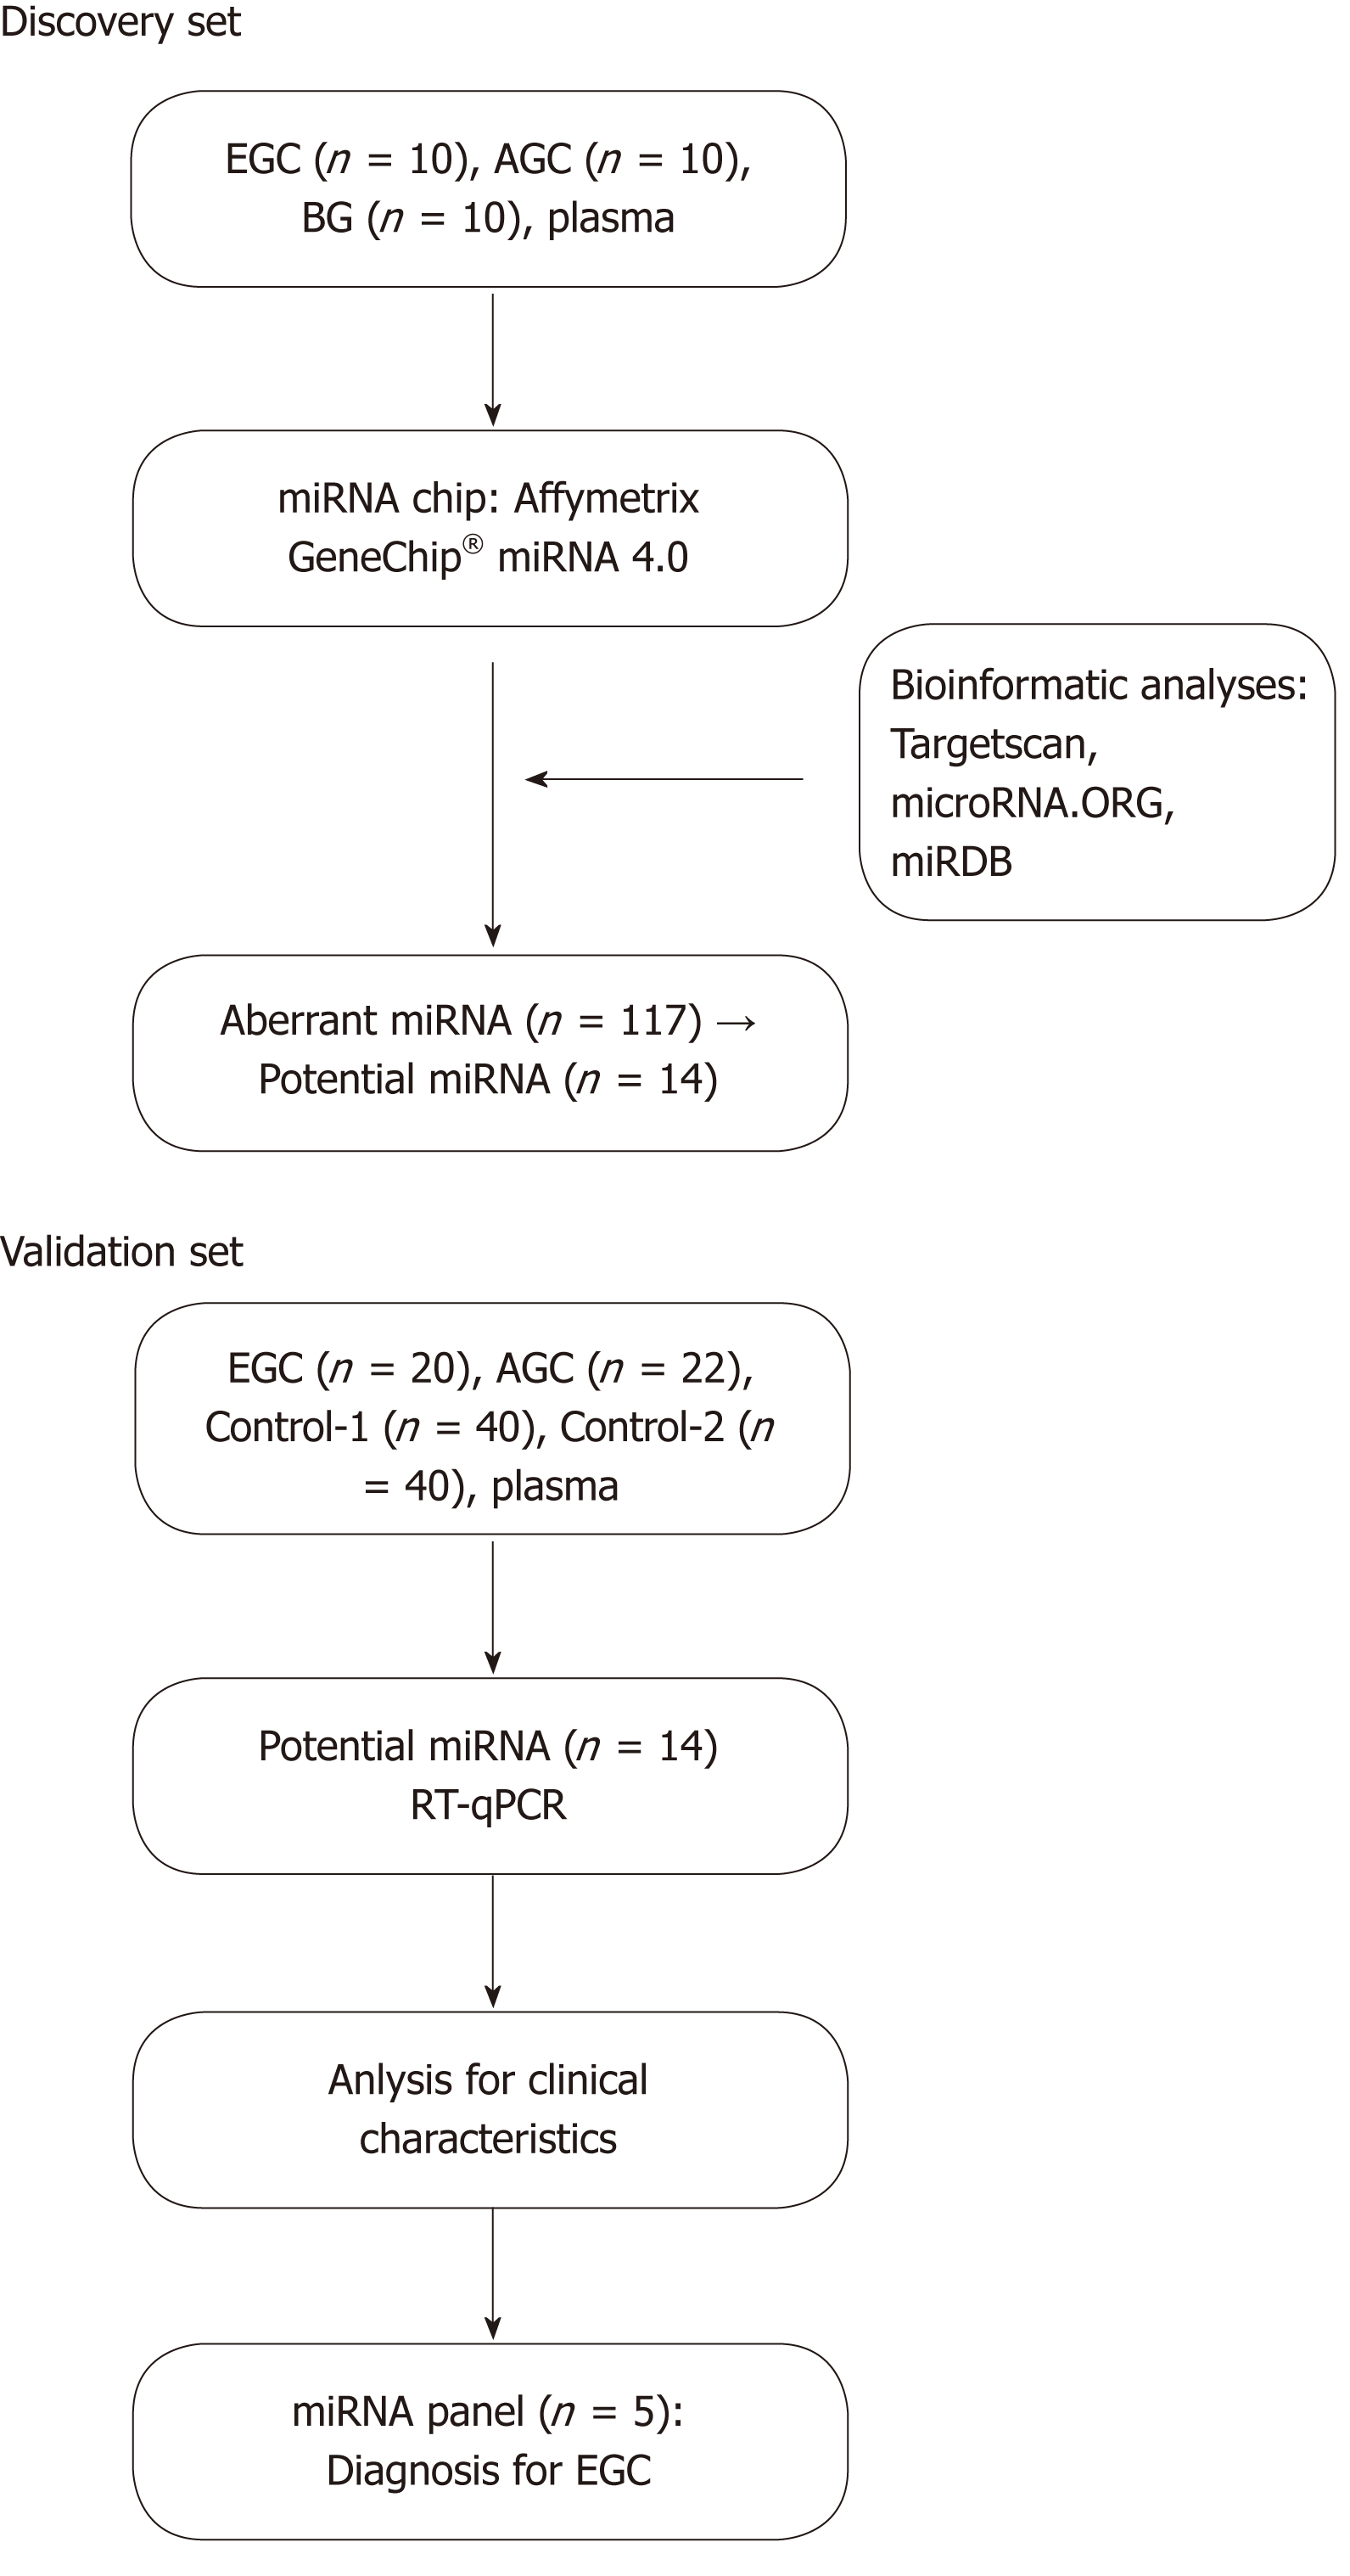
Figure 1 Overview of the study design.
EGC: Early gastric cancer; AGC: Advanced gastric cancer; BG: Benign gastritis; Control-1: Helicobacter pylori-negative gastritis; Control-2: Helicobacter pylori-positive atrophic gastritis; RT-qPCR: Reverse transcription quantitative real-time polymerase chain reaction.
Figure 2 Expression of the four identified microRNAs between the control (Control-1 + Control-2) and cancer (early gastric cancer + advanced gastric cancer) groups.
To assess the diagnostic utility of miR-7641, miR-425-5p, miR-1180-3p and miR-122-5p, a linear combination of the risk score of the four miRNAs weighted by the regression coefficient was used to calculate a risk score factor (RSF) for the four-microRNA panel for each subject. The RSF was calculated as follows: RSF = 1.569 × miR-7641 + 1.312 × miR-425-5p + 1.852 × miR-1180-3p + 1.322 × miR-122-5p. Area under curve = 0.799, 95% confidence interval: 0.691-0.908, P < 0.001. AUC: Area under curve; CI: Confidence interval; miRNA: MicroRNA.
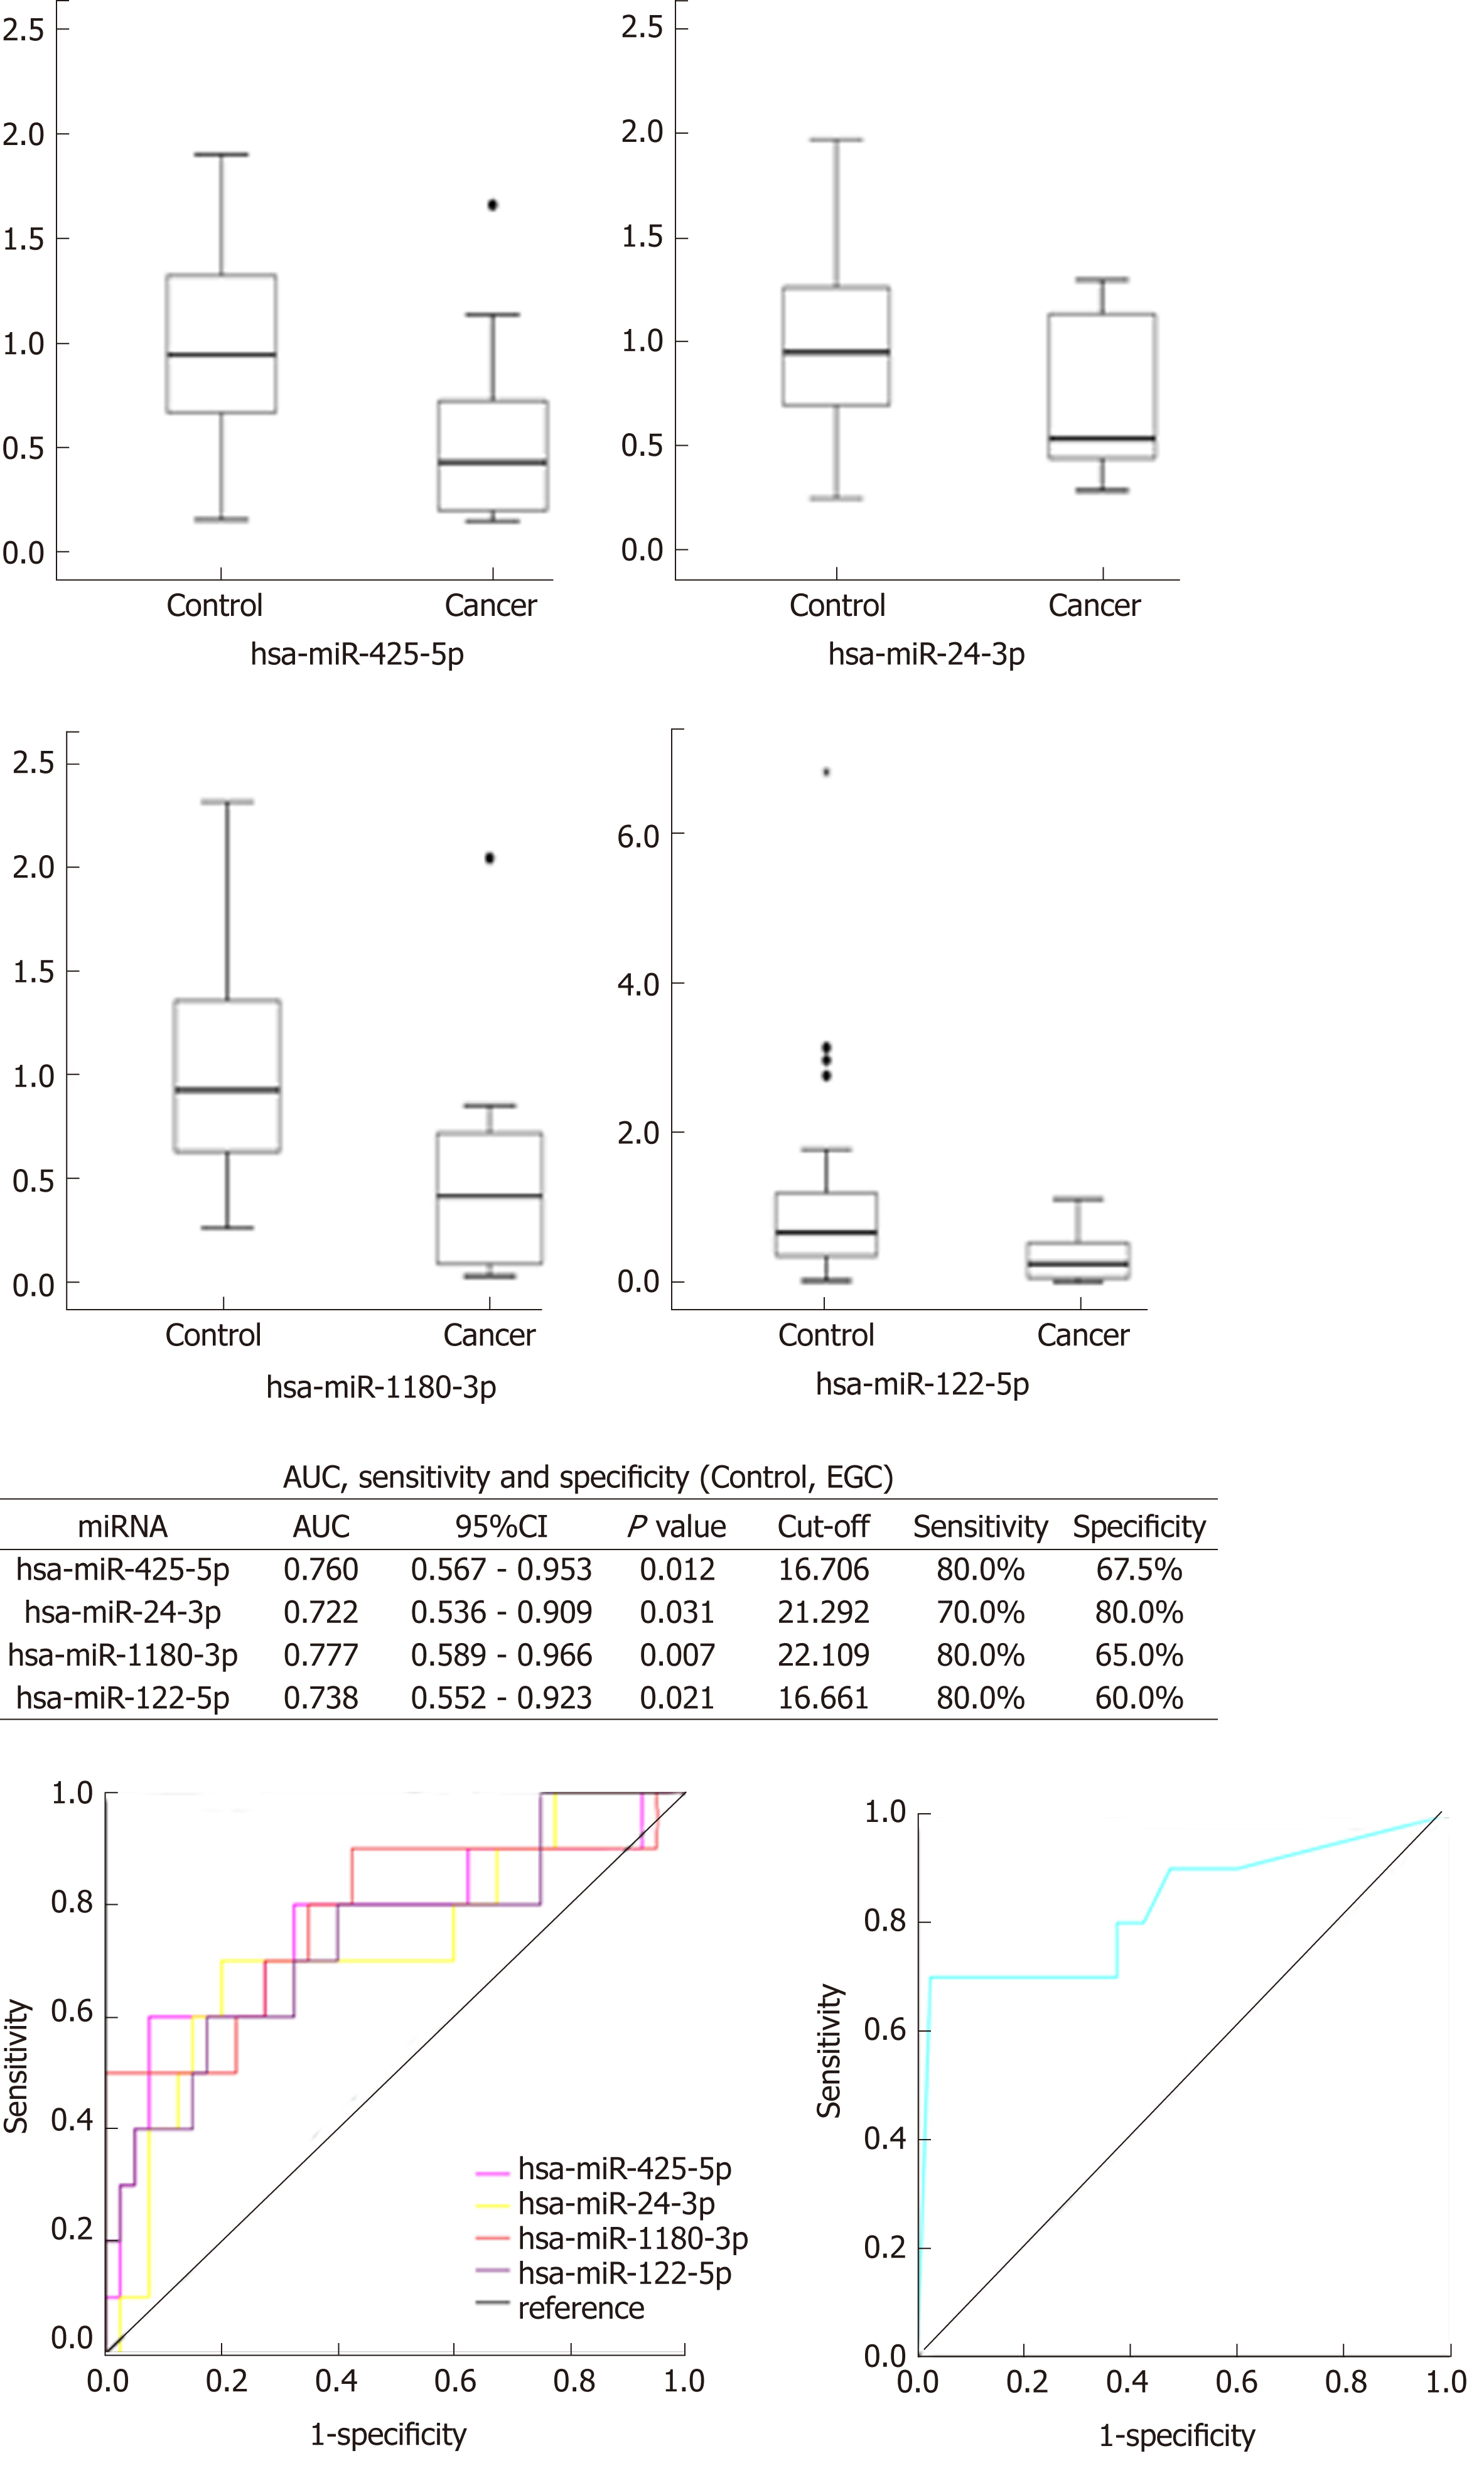
Figure 3 Expression of the four identified microRNAs between the control (Control-1 + Control-2) and early gastric cancer groups.
To assess the diagnostic utility of miR-425-5p, miR-24-3p, miR-1180-3p and miR-122-5p, a linear combination of the risk score of the four microRNAs (miRNAs) weighted by the regression coefficient was used to calculate a risk score factor (RSF) for the four-miRNA panel for each subject. The RSF was calculated as follows: RSF = 2.117 × miR-425-5p + 2.234 × miR-24-3p + 2.005 × miR-1180-3p + 1.792 × miR-122-5p. Area under curve = 0.829, 95% confidence interval: 0.657-1.000, P = 0.001. AUC: Area under curve; CI: Confidence interval; miRNA: MicroRNA; EGC: Early gastric cancer.
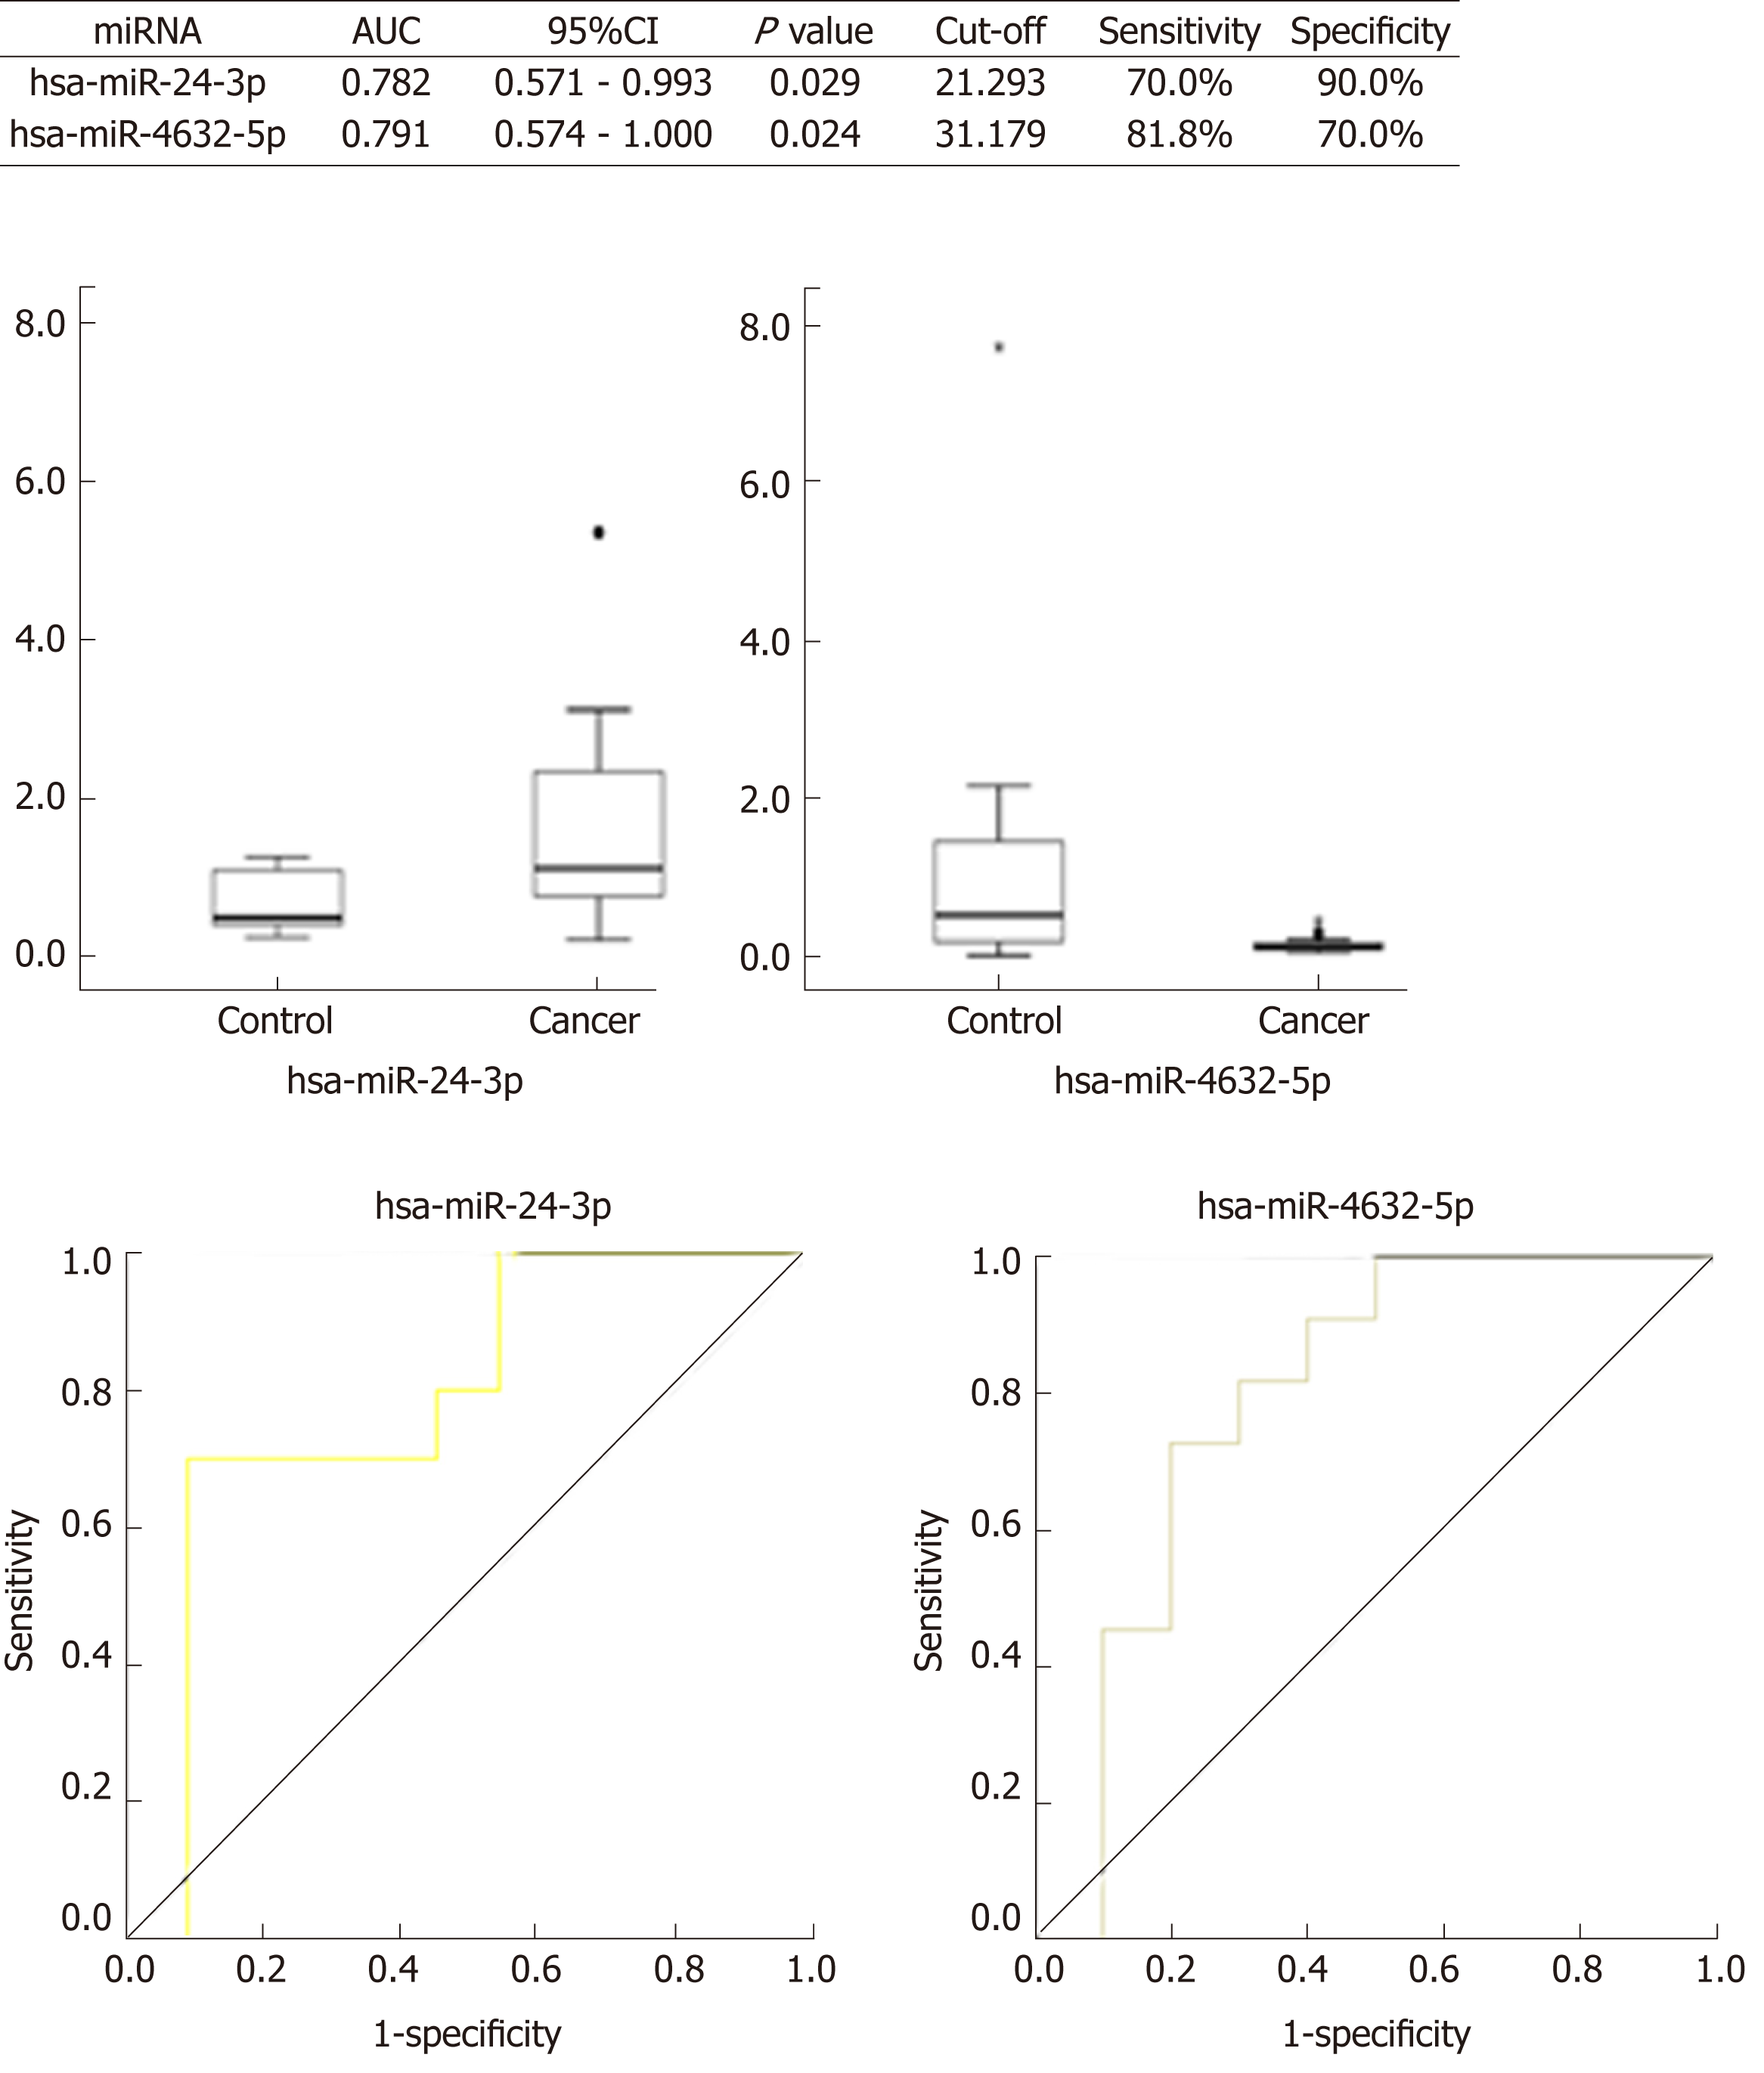
Figure 4 Expression of the two microRNAs between the advanced and early gastric cancer groups.
The expression of miR-24-3p in the early gastric cancer (EGC) group was significantly lower than that in the advanced gastric cancer (AGC) [area under curve (AUC) = 0.782, 95% confidence interval (CI): 0.571-0.993, P = 0.029] group. The expression of miR-4632-5p in the EGC group was significantly higher than that in the AGC (AUC = 0.791, 95%CI: 0.574-1.000, P = 0.024) group. AUC: Area under curve; CI: Confidence interval; miRNA: MicroRNA.
- Citation: Zhu XL, Ren LF, Wang HP, Bai ZT, Zhang L, Meng WB, Zhu KX, Ding FH, Miao L, Yan J, Wang YP, Liu YQ, Zhou WC, Li X. Plasma microRNAs as potential new biomarkers for early detection of early gastric cancer. World J Gastroenterol 2019; 25(13): 1580-1591
- URL: https://www.wjgnet.com/1007-9327/full/v25/i13/1580.htm
- DOI: https://dx.doi.org/10.3748/wjg.v25.i13.1580


