Copyright
©The Author(s) 2019.
World J Gastroenterol. Mar 28, 2019; 25(12): 1465-1477
Published online Mar 28, 2019. doi: 10.3748/wjg.v25.i12.1465
Published online Mar 28, 2019. doi: 10.3748/wjg.v25.i12.1465
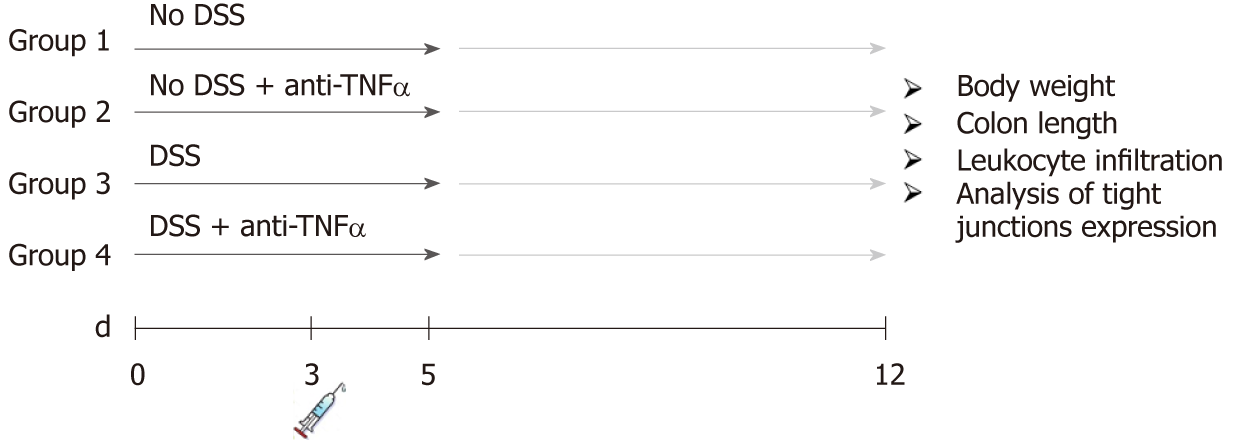
Figure 1 Experimental design of the dextran sulfate sodium colitis model.
Acute colitis was induced by administration of 3% dextran sulfate sodium (DSS) to drinking water (DSS) for 5 d. At 3rd d, one singular injections of an anti-tumor necrosis factor α was administrated. Each group counts 20 mice: 10 mice were sacrificed at day 5, 10 mice at day 12 after 1 wk of recovery post-DSS. DSS: Dextran sulfate sodium; TNFα: Tumor necrosis factor α.
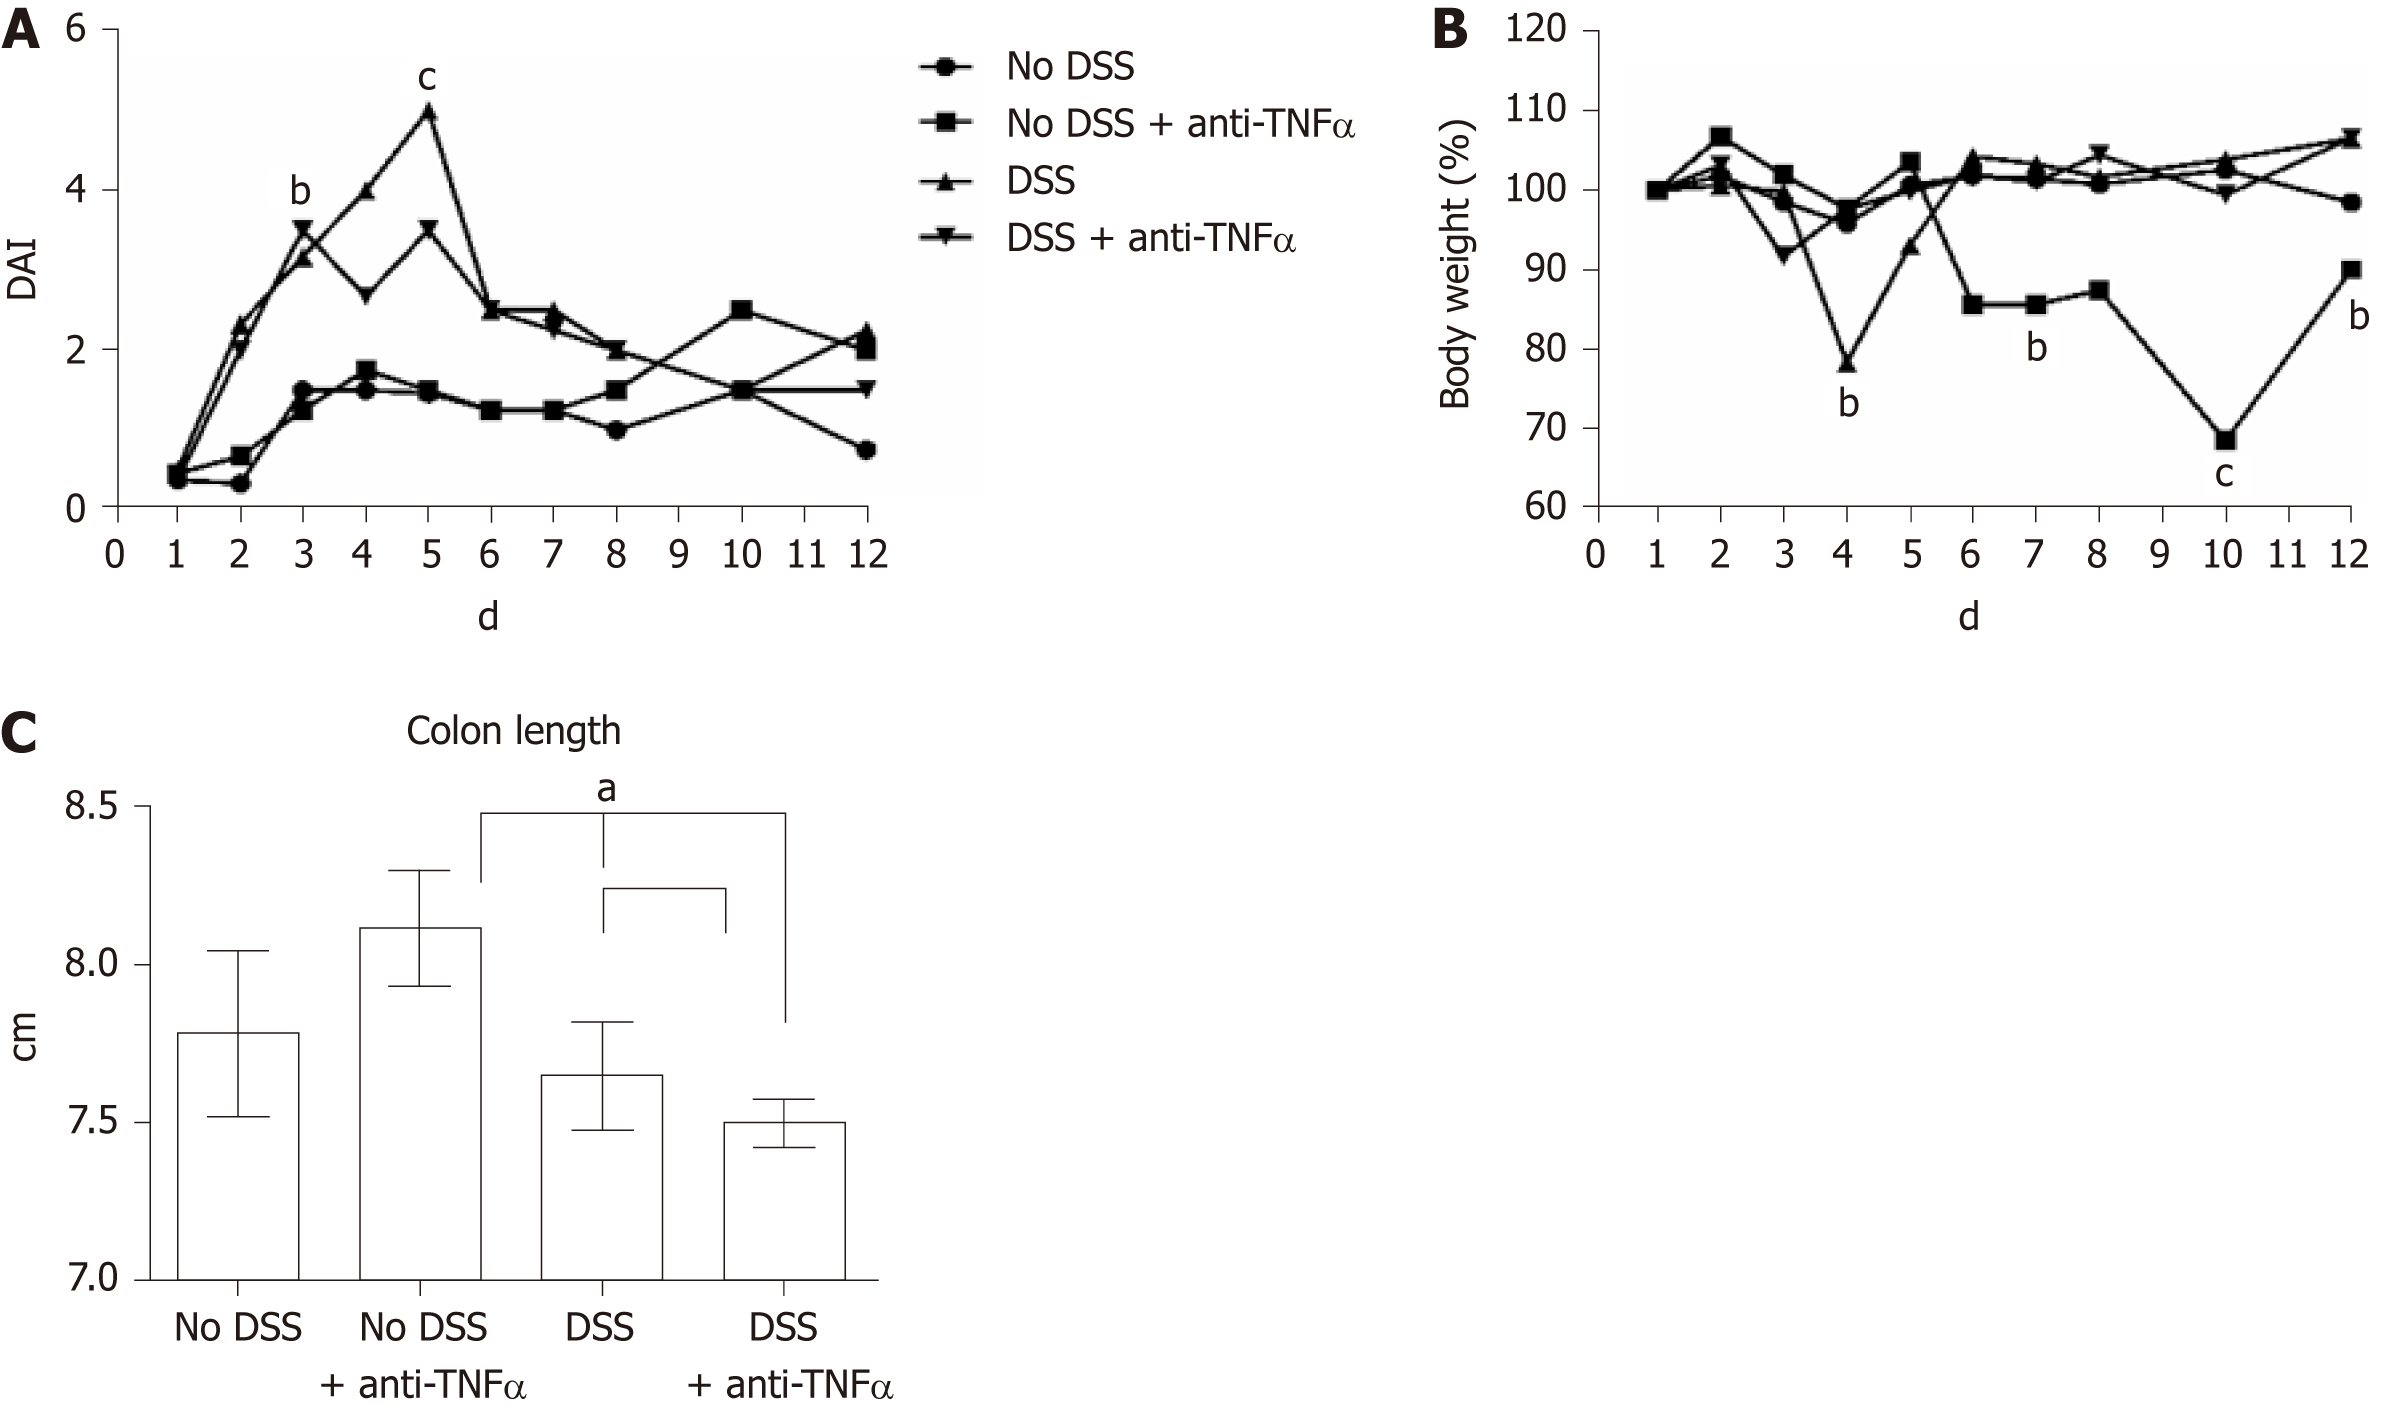
Figure 2 Estimation of clinical and morphological changes of dextran sulfate sodium-induced colitis.
A: The four-point disease activity index (DAI) was evaluated scoring daily body weight of mice, the percentage of body weight loss, the trait of the stool and the presence of occult blood in feces. B: Body weight, one of the DAI parameter, is also represented separately by percentage, where the mice weight at 1st d of experiment is equal to 100%. C: Colon length is another parameter to evaluate the healthy or disease state of the mice: the mean values in the 4 groups at day 5 are shown. aP < 0.05; bP < 0.01; cP < 0.0001. DSS: Dextran sulfate sodium; TNFα: Tumor necrosis factor α; DAI: Disease activity index.
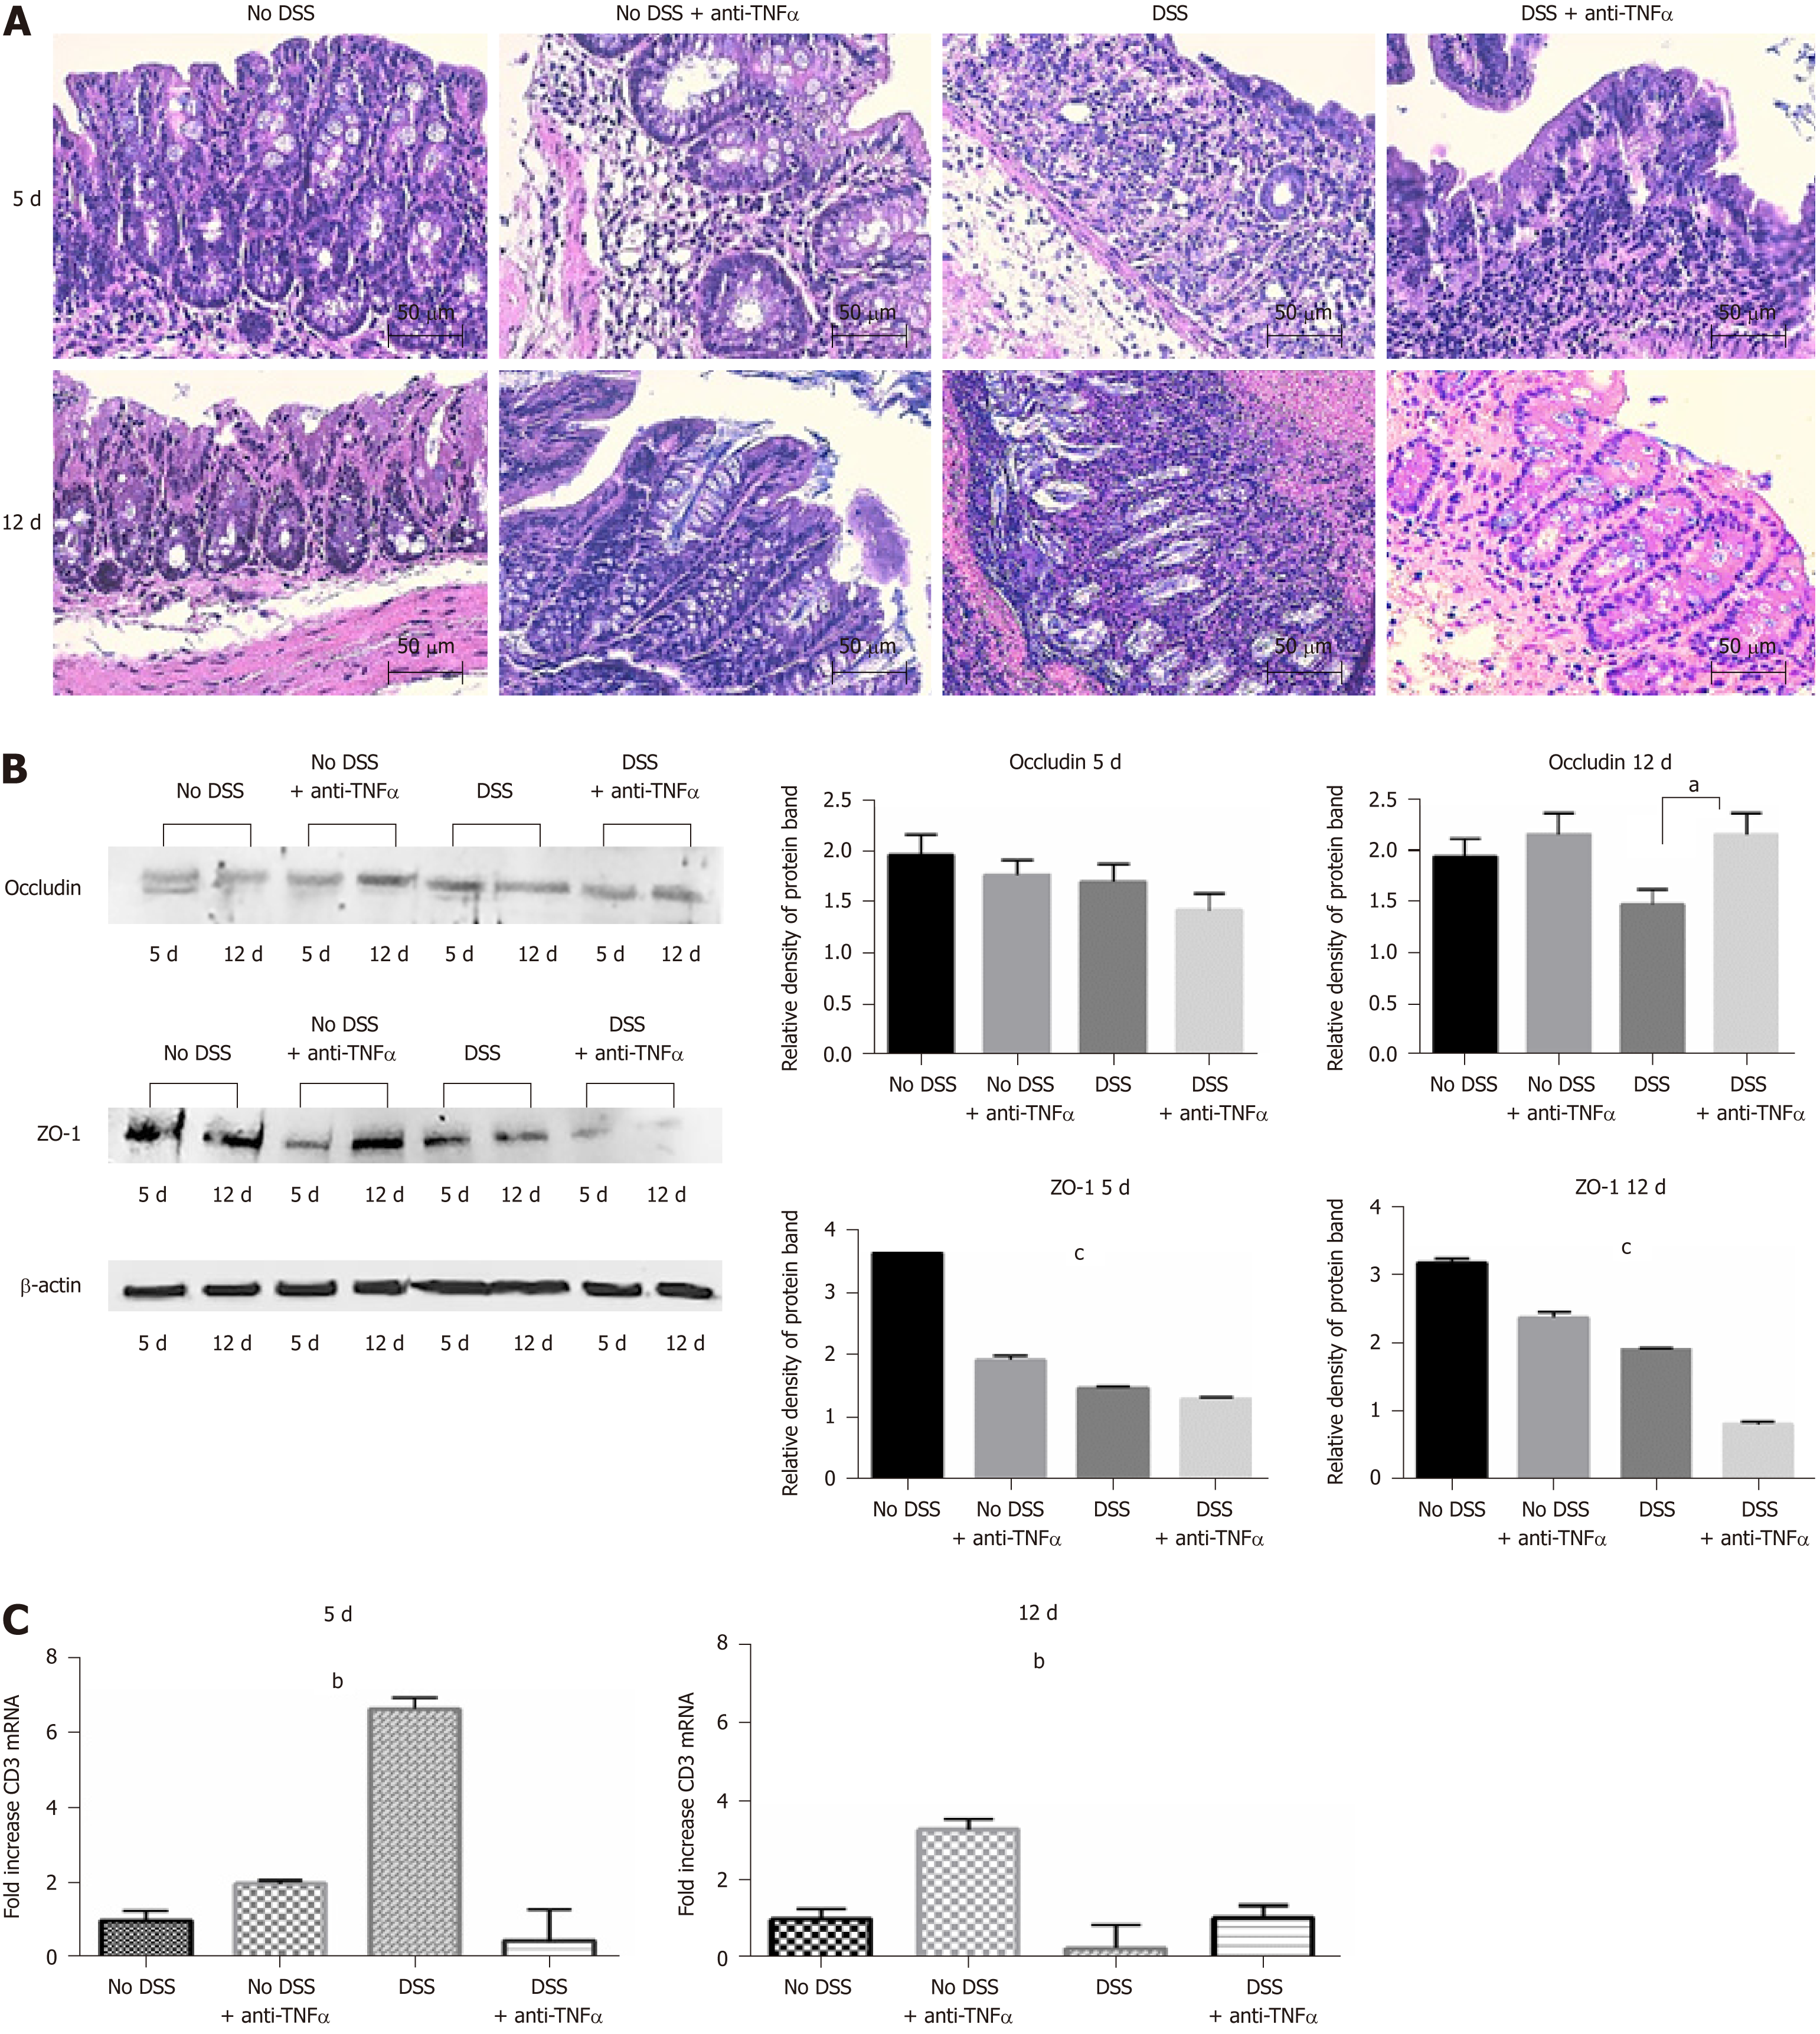
Figure 3 Histological analysis confirms the strength of the dextran sulfate sodium model.
A: Hematoxylin and eosin staining of colon sections of mice from 4 groups of treatment at day 5 and 12. Forty-fold magnification was used. B: Protein expression of tight junctions occludin and ZO-1 in colon tissue. Antibody anti-β-actin was used as endogenous control. On the right, the histograms represent the mean of densitometry values from 3 different experiments. C: CD3 infiltration in colon mucosa was assessed by quantitative PCR of CD3 mRNA. One-way ANOVA (and non-parametric) was calculated; aP < 0.05; bP < 0.01; cP < 0.0001. DSS: Dextran sulfate sodium; TNFα: Tumor necrosis factor α.
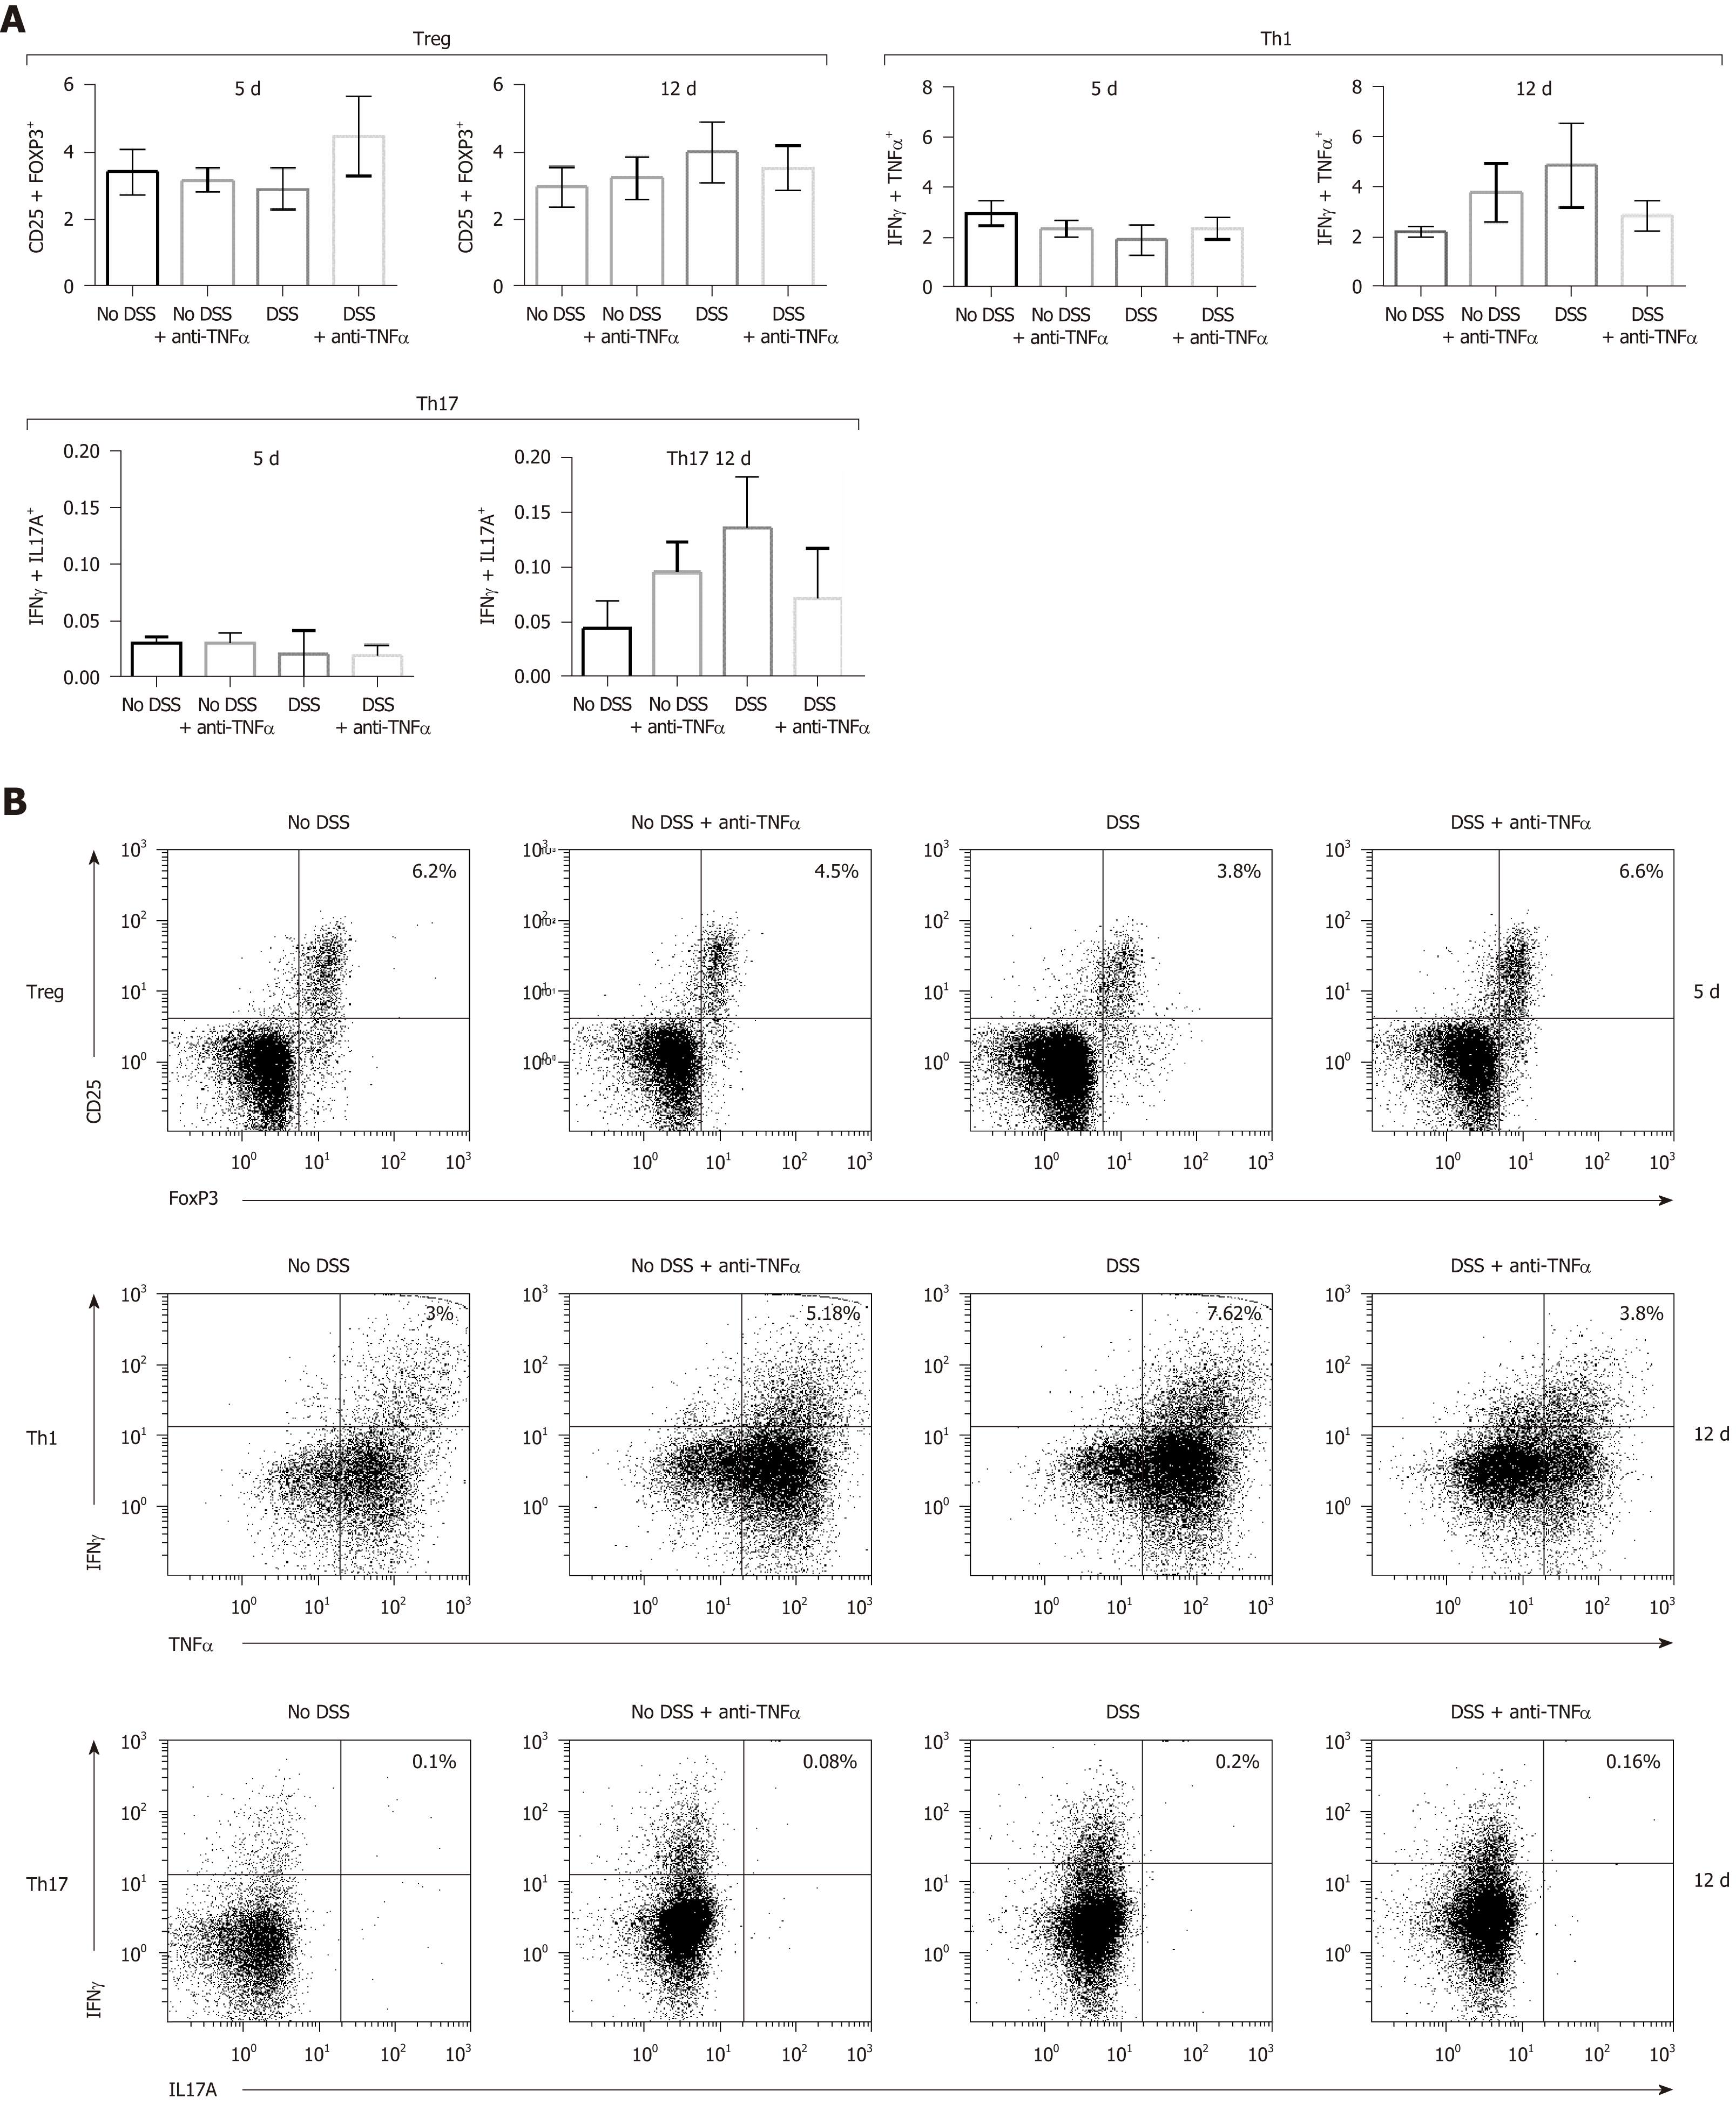
Figure 4 T cells subsets characterization in presence of an anti-tumor necrosis factor α agent.
T cells were isolated from mesenteric lymphnode of mice and CD4+ cells were studied by flow cytometry. In particular, CD4+ regulatory T lymphocytes characterization was possible through the use of anti-CD25 and anti–FoxP3 antibodies (B); type 1 helper T lymphocytes expressed interferon (IFN)γ and tumor necrosis factor α (C); IFNγ+ and interleukin 17+ cells identified the type 17 helper T lymphocytes cluster (D). In each panel (B), (C) and (D) the cells in the upper right quadrant were the double staining cells. Treg: CD4+ regulatory T lymphocytes; Th1: Type 1 helper T lymphocytes; Th17: Type 17 helper T lymphocytes; DSS: Dextran sulfate sodium; TNFα: Tumor necrosis factor α; IFNγ: Interferon γ; IL: Interleukin.
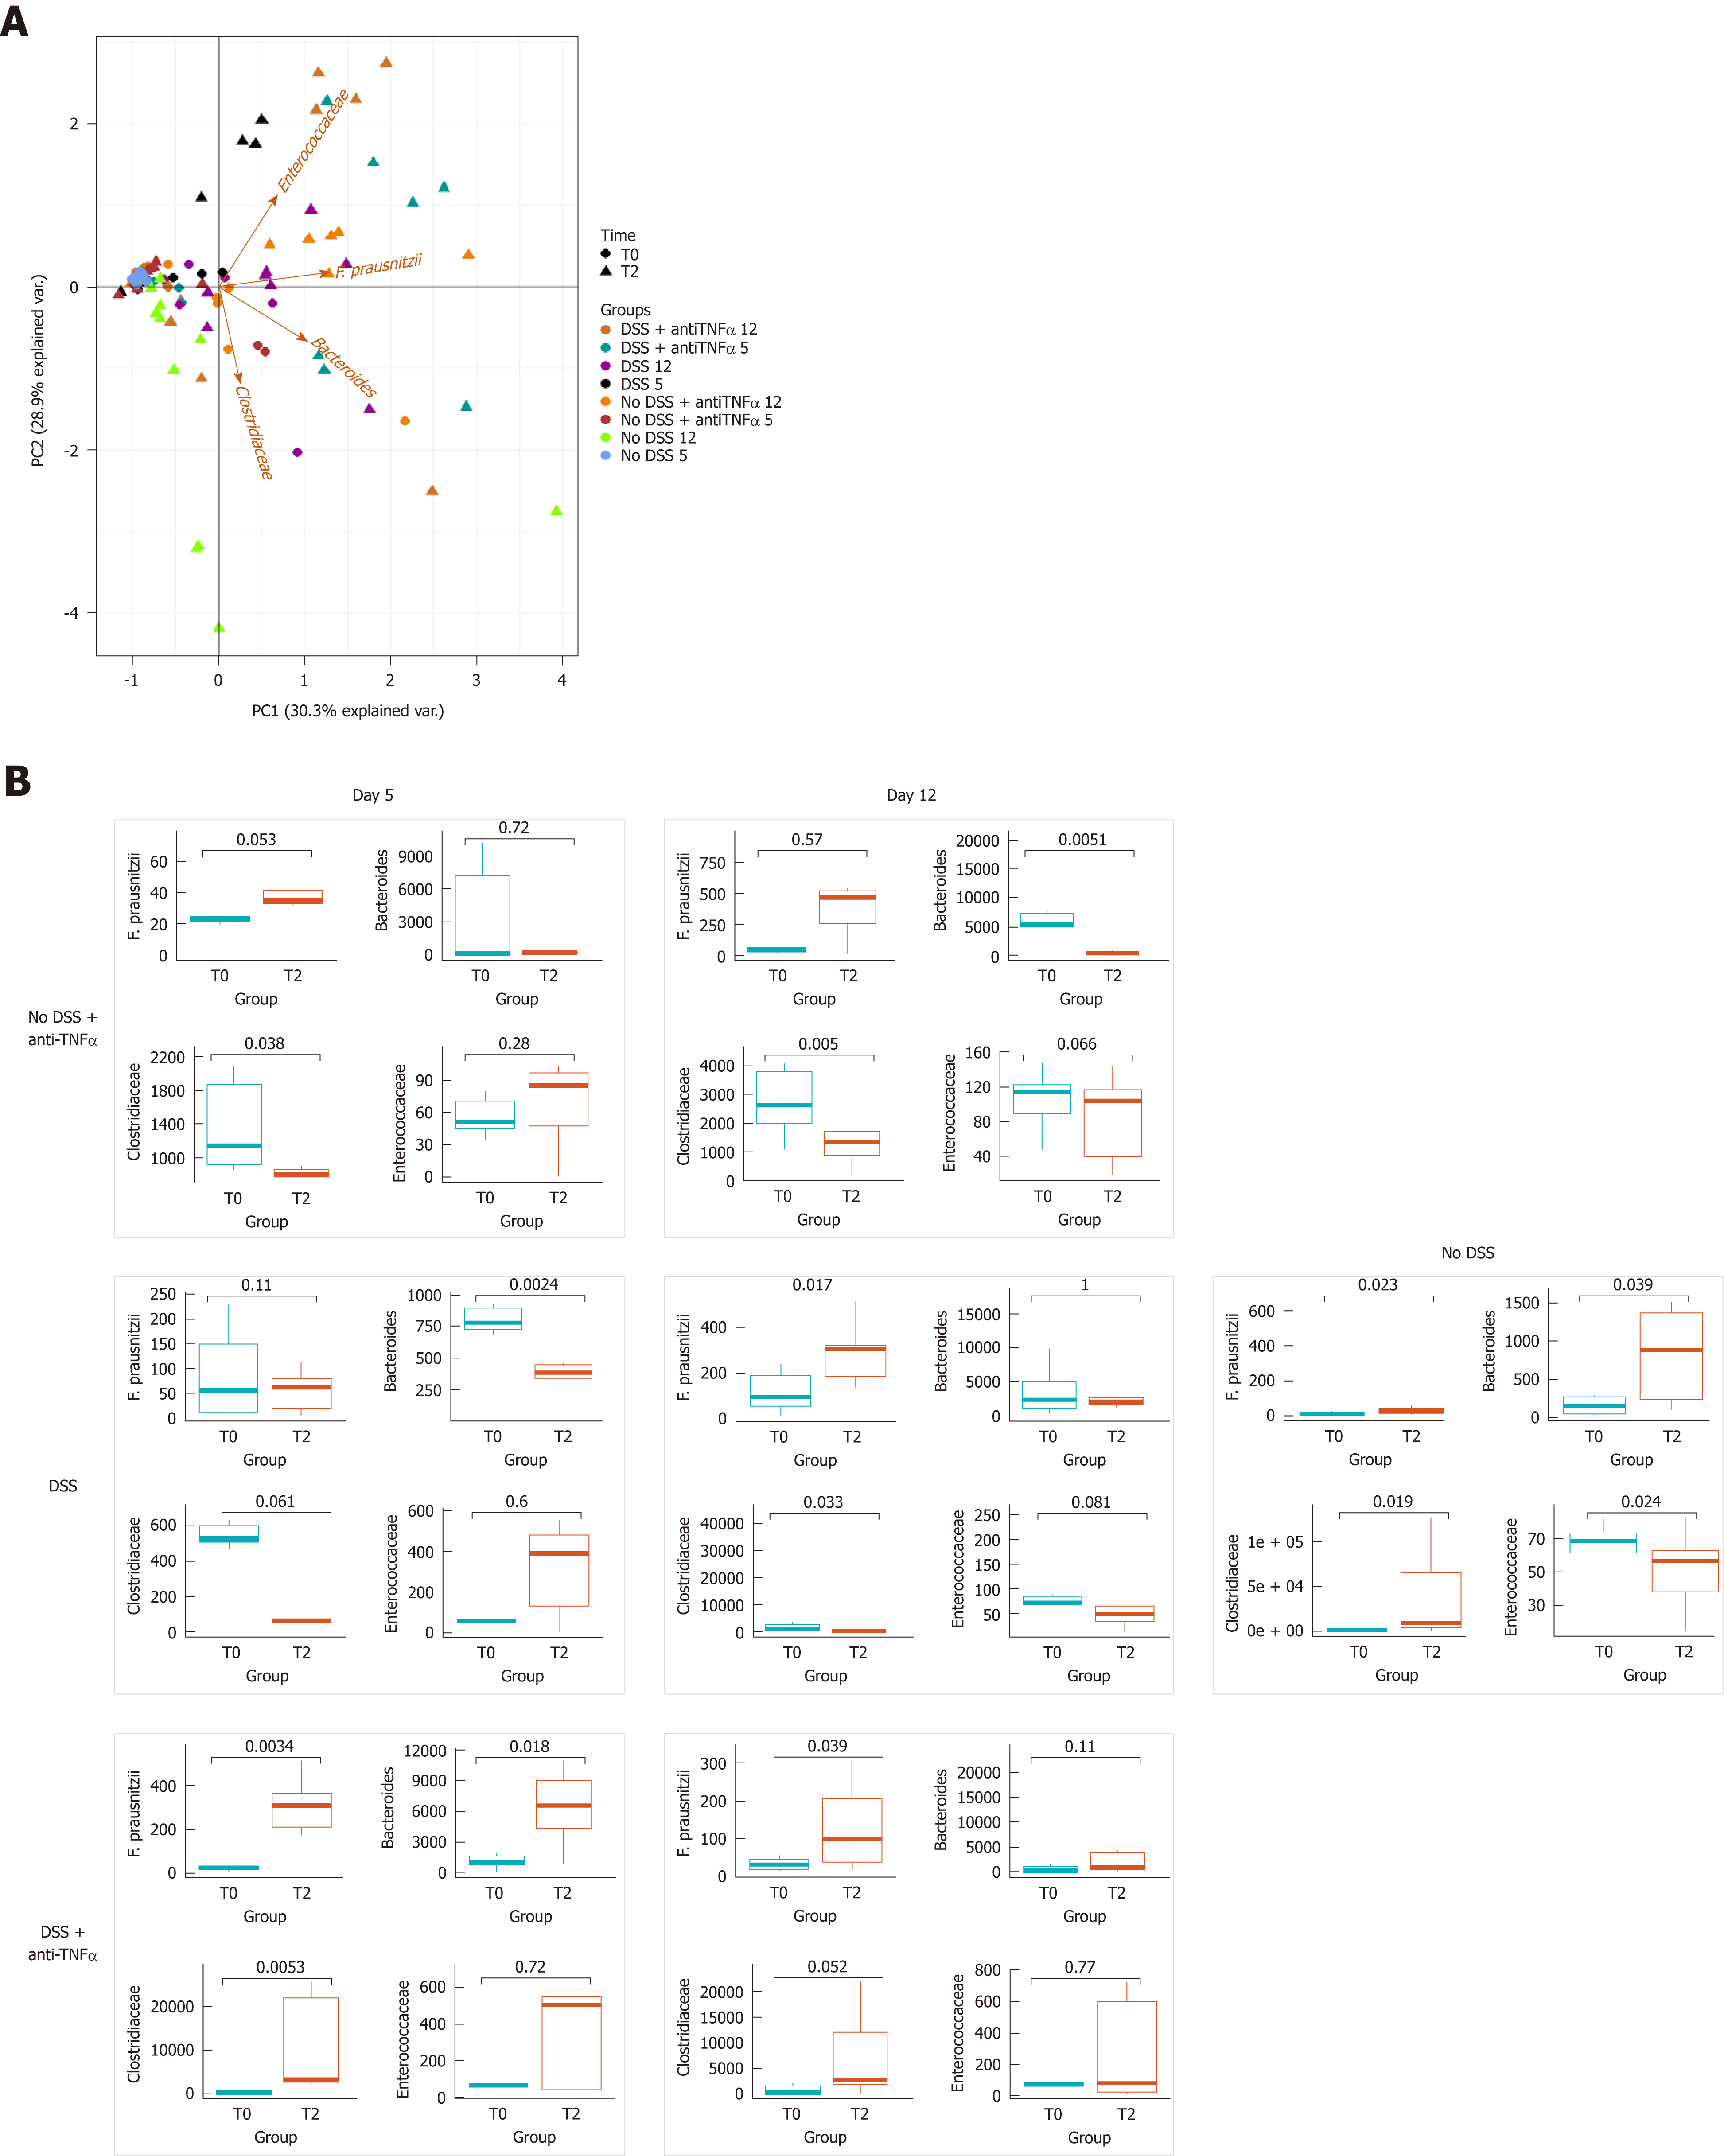
Figure 5 Bacterial genera and species characterization in presence of an anti- tumor necrosis factor α agent.
A: Principal component analysis was represented by a biplot, where the variability among samples and bacterial weight in the variability were expressed. B: Dot plot represents the distribution of bacteria at the beginning of the experiment and at the moment of sacrifice; in the case of “No DSS” mice, the samples from day 5 and 12 are collected together, since no significant changes occurred between day 5 and 12. In left panel, the results were distinguished based on the day of the end of experiment. DSS: Dextran sulfate sodium; TNFα: Tumor necrosis factor α.
- Citation: Petito V, Graziani C, Lopetuso LR, Fossati M, Battaglia A, Arena V, Scannone D, Quaranta G, Quagliariello A, Del Chierico F, Putignani L, Masucci L, Sanguinetti M, Sgambato A, Gasbarrini A, Scaldaferri F. Anti-tumor necrosis factor α therapy associates to type 17 helper T lymphocytes immunological shift and significant microbial changes in dextran sodium sulphate colitis. World J Gastroenterol 2019; 25(12): 1465-1477
- URL: https://www.wjgnet.com/1007-9327/full/v25/i12/1465.htm
- DOI: https://dx.doi.org/10.3748/wjg.v25.i12.1465


