Copyright
©The Author(s) 2019.
World J Gastroenterol. Mar 14, 2019; 25(10): 1224-1237
Published online Mar 14, 2019. doi: 10.3748/wjg.v25.i10.1224
Published online Mar 14, 2019. doi: 10.3748/wjg.v25.i10.1224
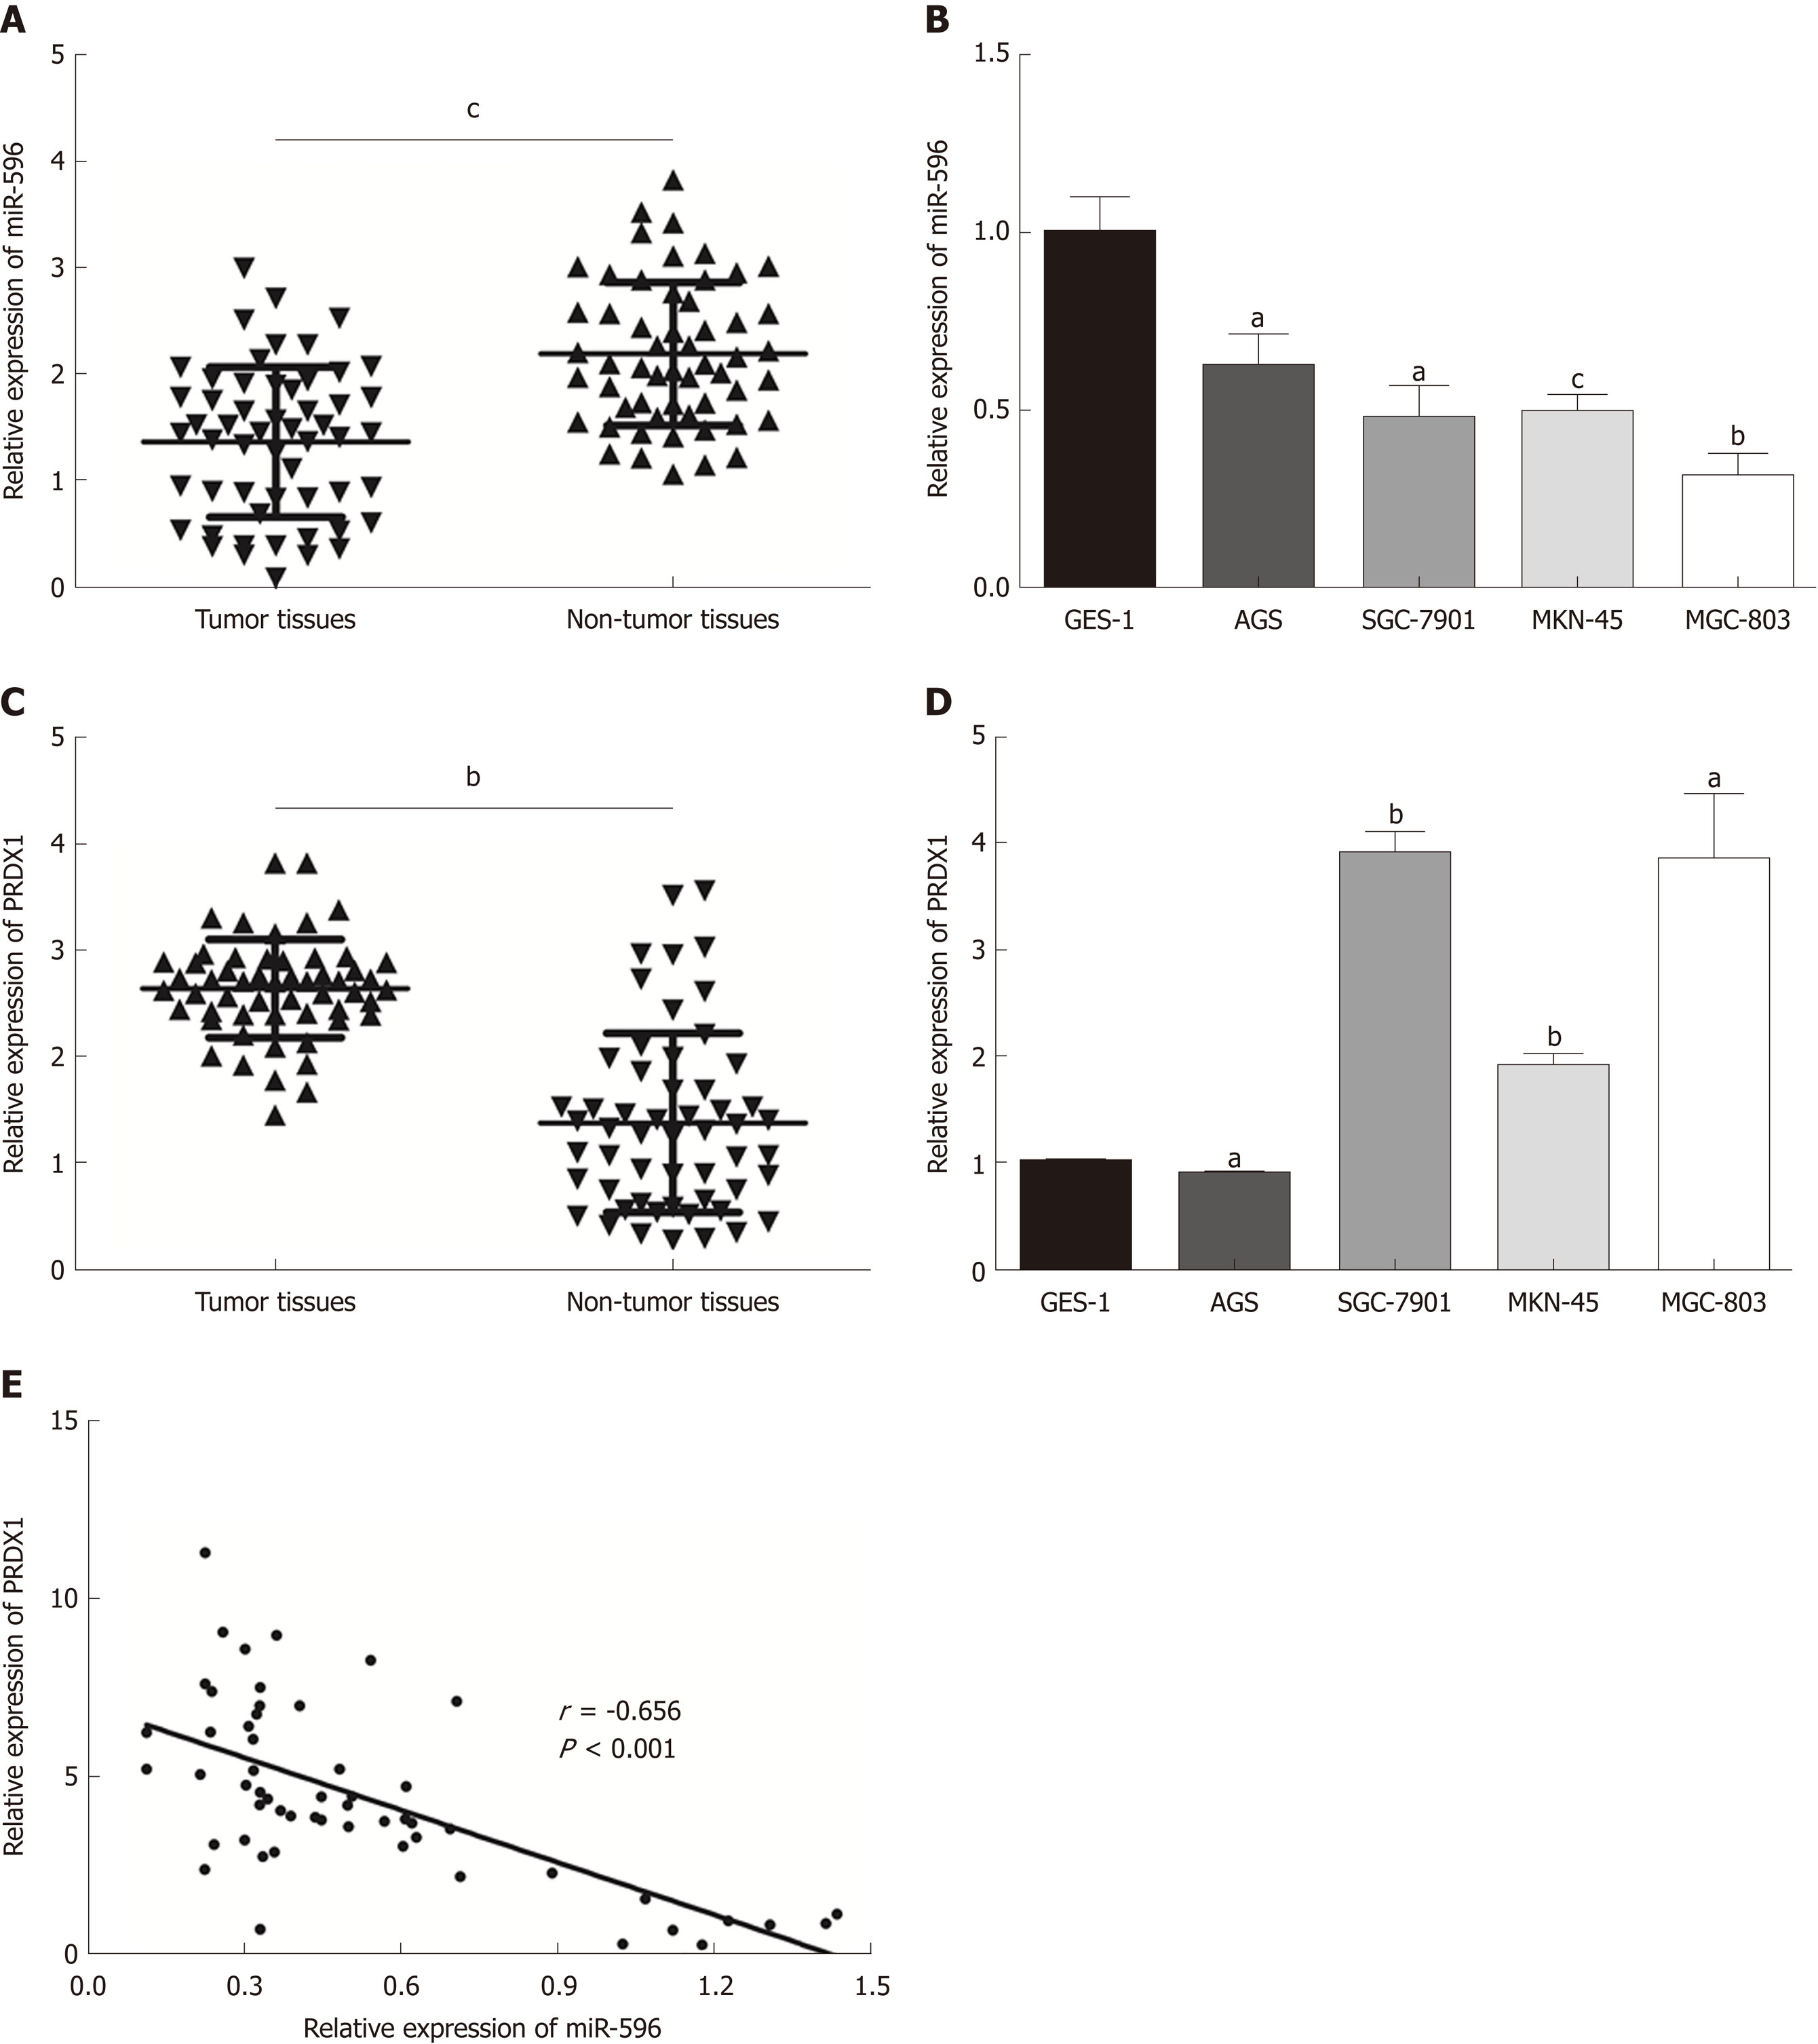
Figure 1 MicroRNA-596 is downregulated and peroxiredoxin 1 upregulated in gastric cancer tissues and cell lines.
A and B: Expression of miR-596 in 55 pairs of gastric cancer (GC) and non-tumor tissues (A) and human GC cells (B). C and D: Expression of peroxiredoxin 1 (PRDX1) mRNA in 55 GC samples and corresponding non-tumor tissues (C) and human GC cells (D). E: Pearson's correlation analysis of the relative expression levels of miR-596 and the relative PRDX1 mRNA expression levels in the same set of patients. β-actin was used as an internal control. aP < 0.05, bP < 0.01, cP < 0.001 vs non-tumor tissues or GES-1. PRDX1: Peroxiredoxin 1; MiR-596: MicroRNA-596.
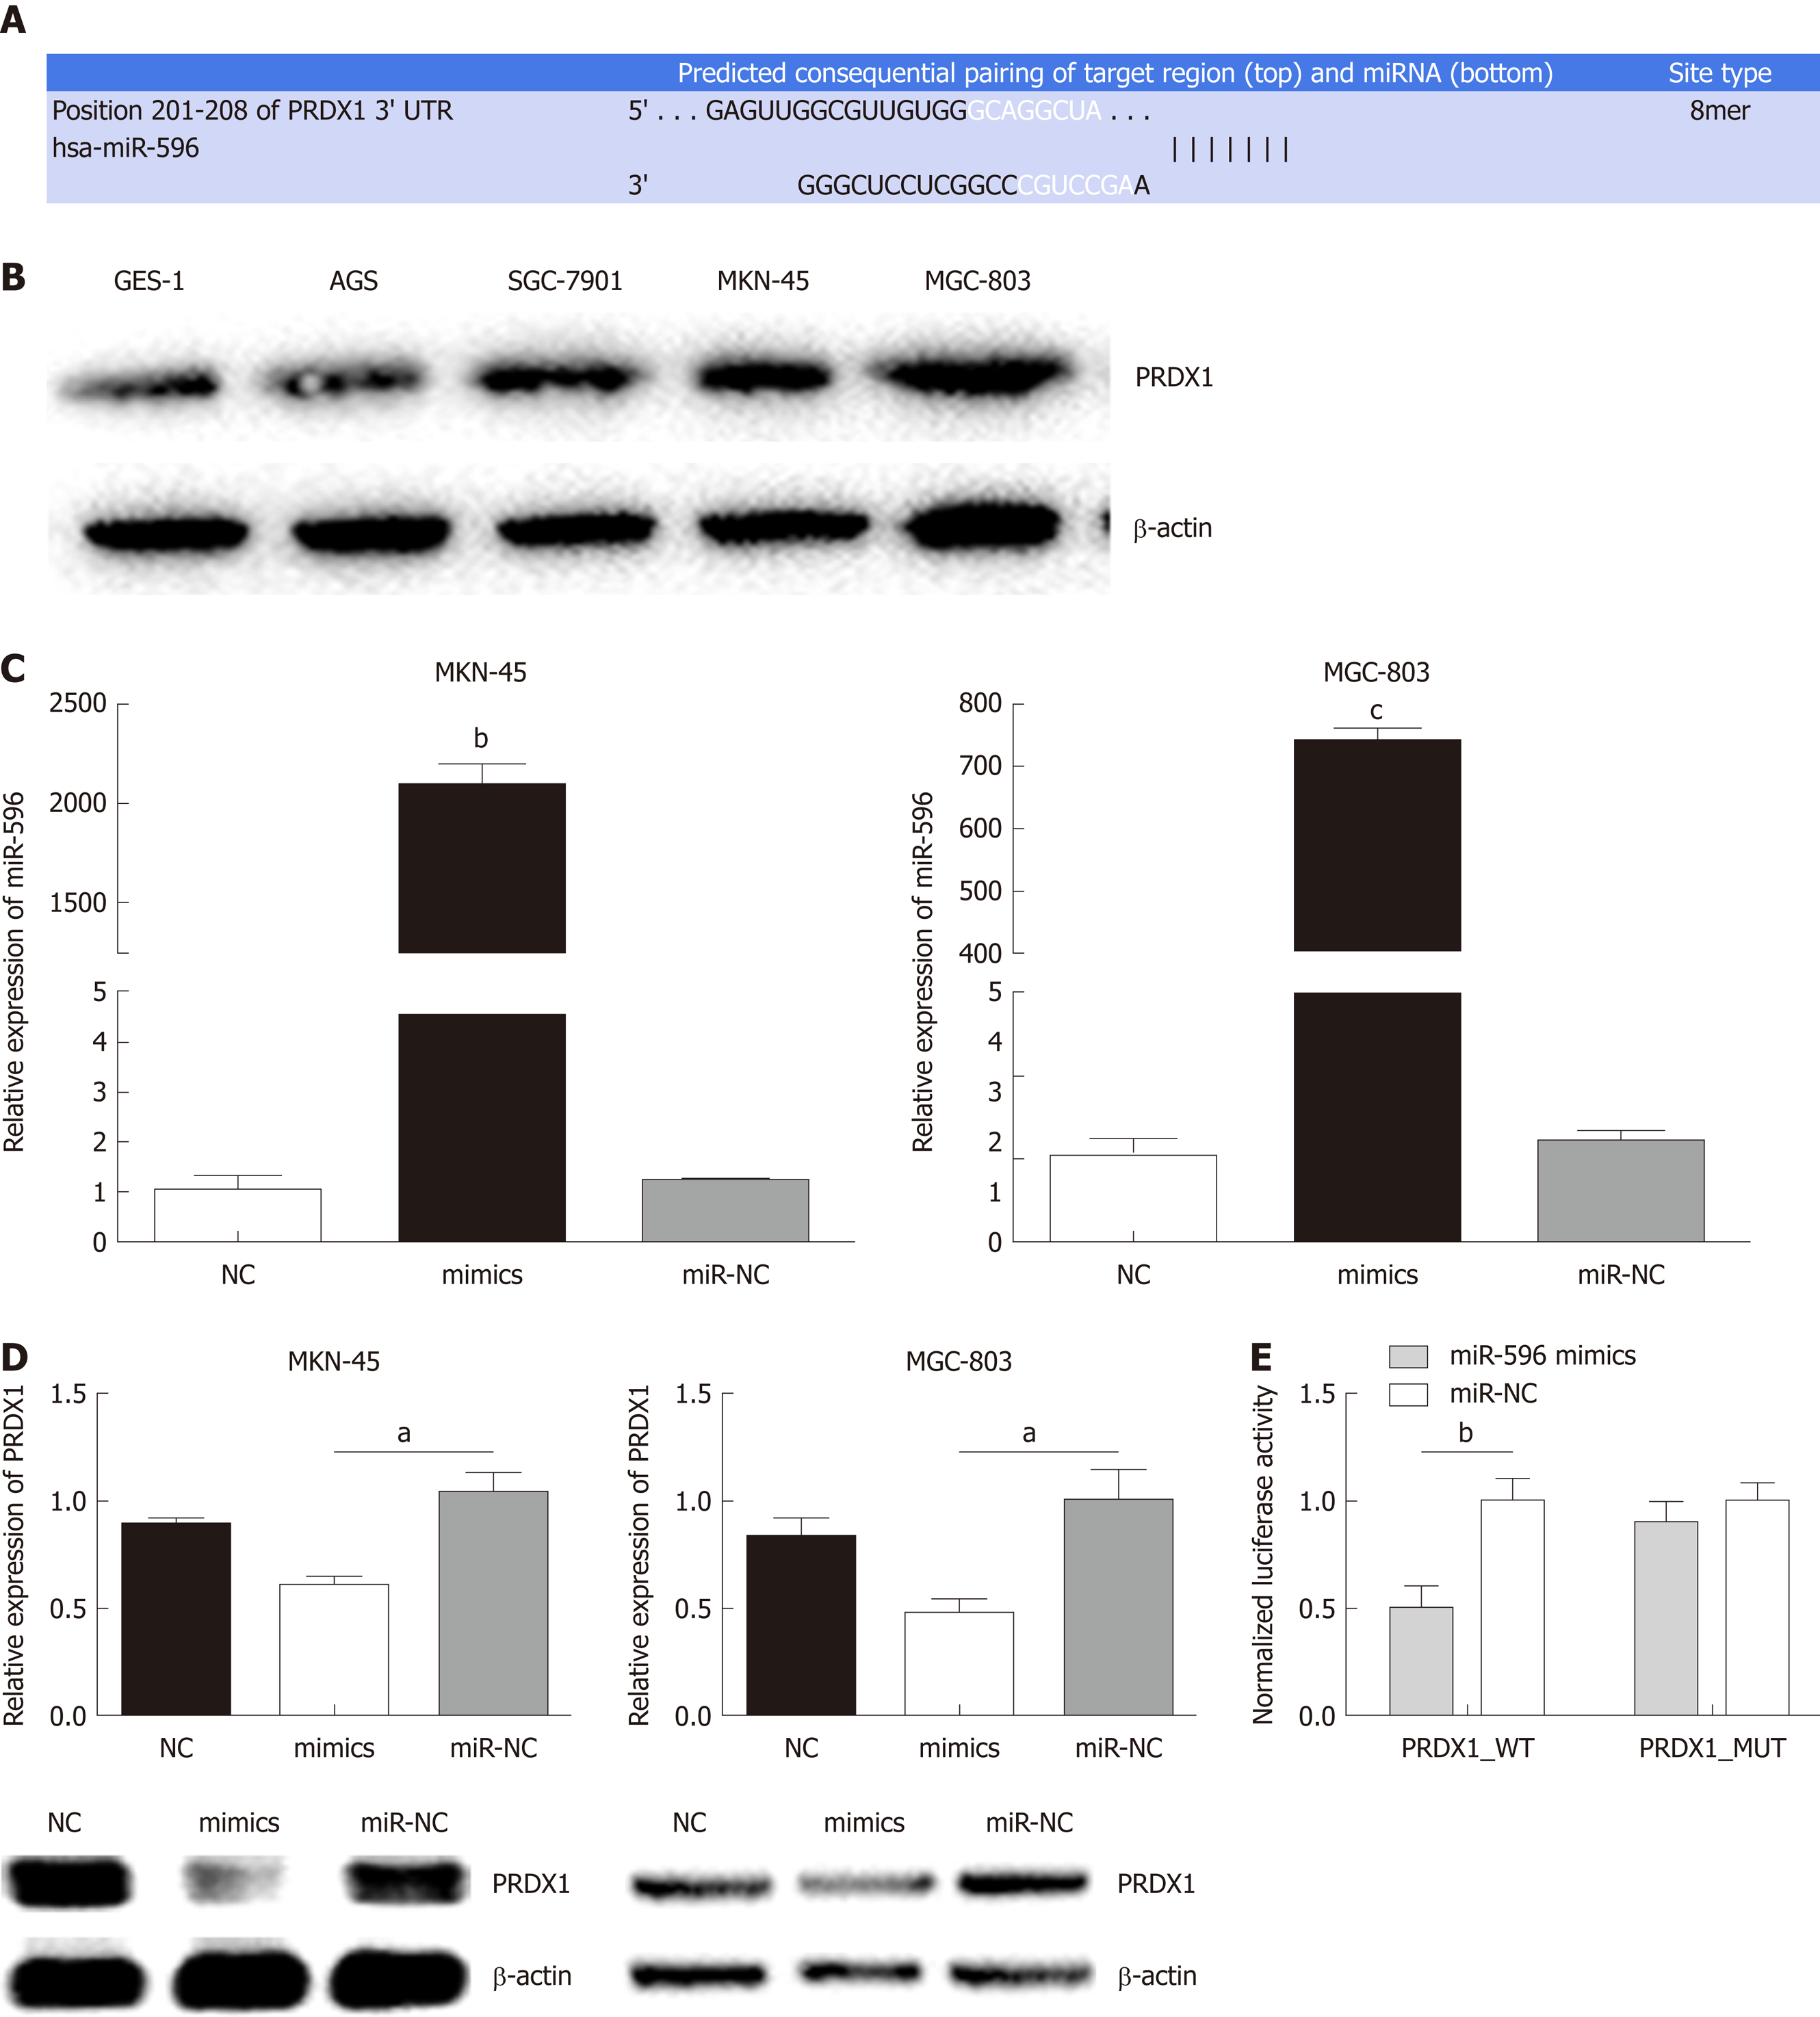
Figure 2 Peroxiredoxin 1 as a putative target of microRNA-596 in gastric cancer cells.
A: The predicted binding sites for microRNA-596 (miR-596) in the 3'-UTR of peroxiredoxin 1 (PRDX1). B: Expression of PRDX1 protein in human gastric cancer (GC) cells. C: Quantitative real-time PCR (qRT-PCR) for determining miR-596 expression in MKN-45 and MGC-803 cells transfected with miR-NC or miR-596 mimics. D: PRDX1 mRNA and protein expression in MKN-45 and MGC-803 cells transfected with miR-NC or miR-596 mimics. β-actin was used as an internal control. E: Relative luciferase activity of PRDX1 in wild-type (WT-UTR) or mutant (MUT-UTR). aP < 0.05, bP < 0.01, cP < 0.001 vs miR-NC. PRDX1: Peroxiredoxin 1; MiR-596: MicroRNA-596.
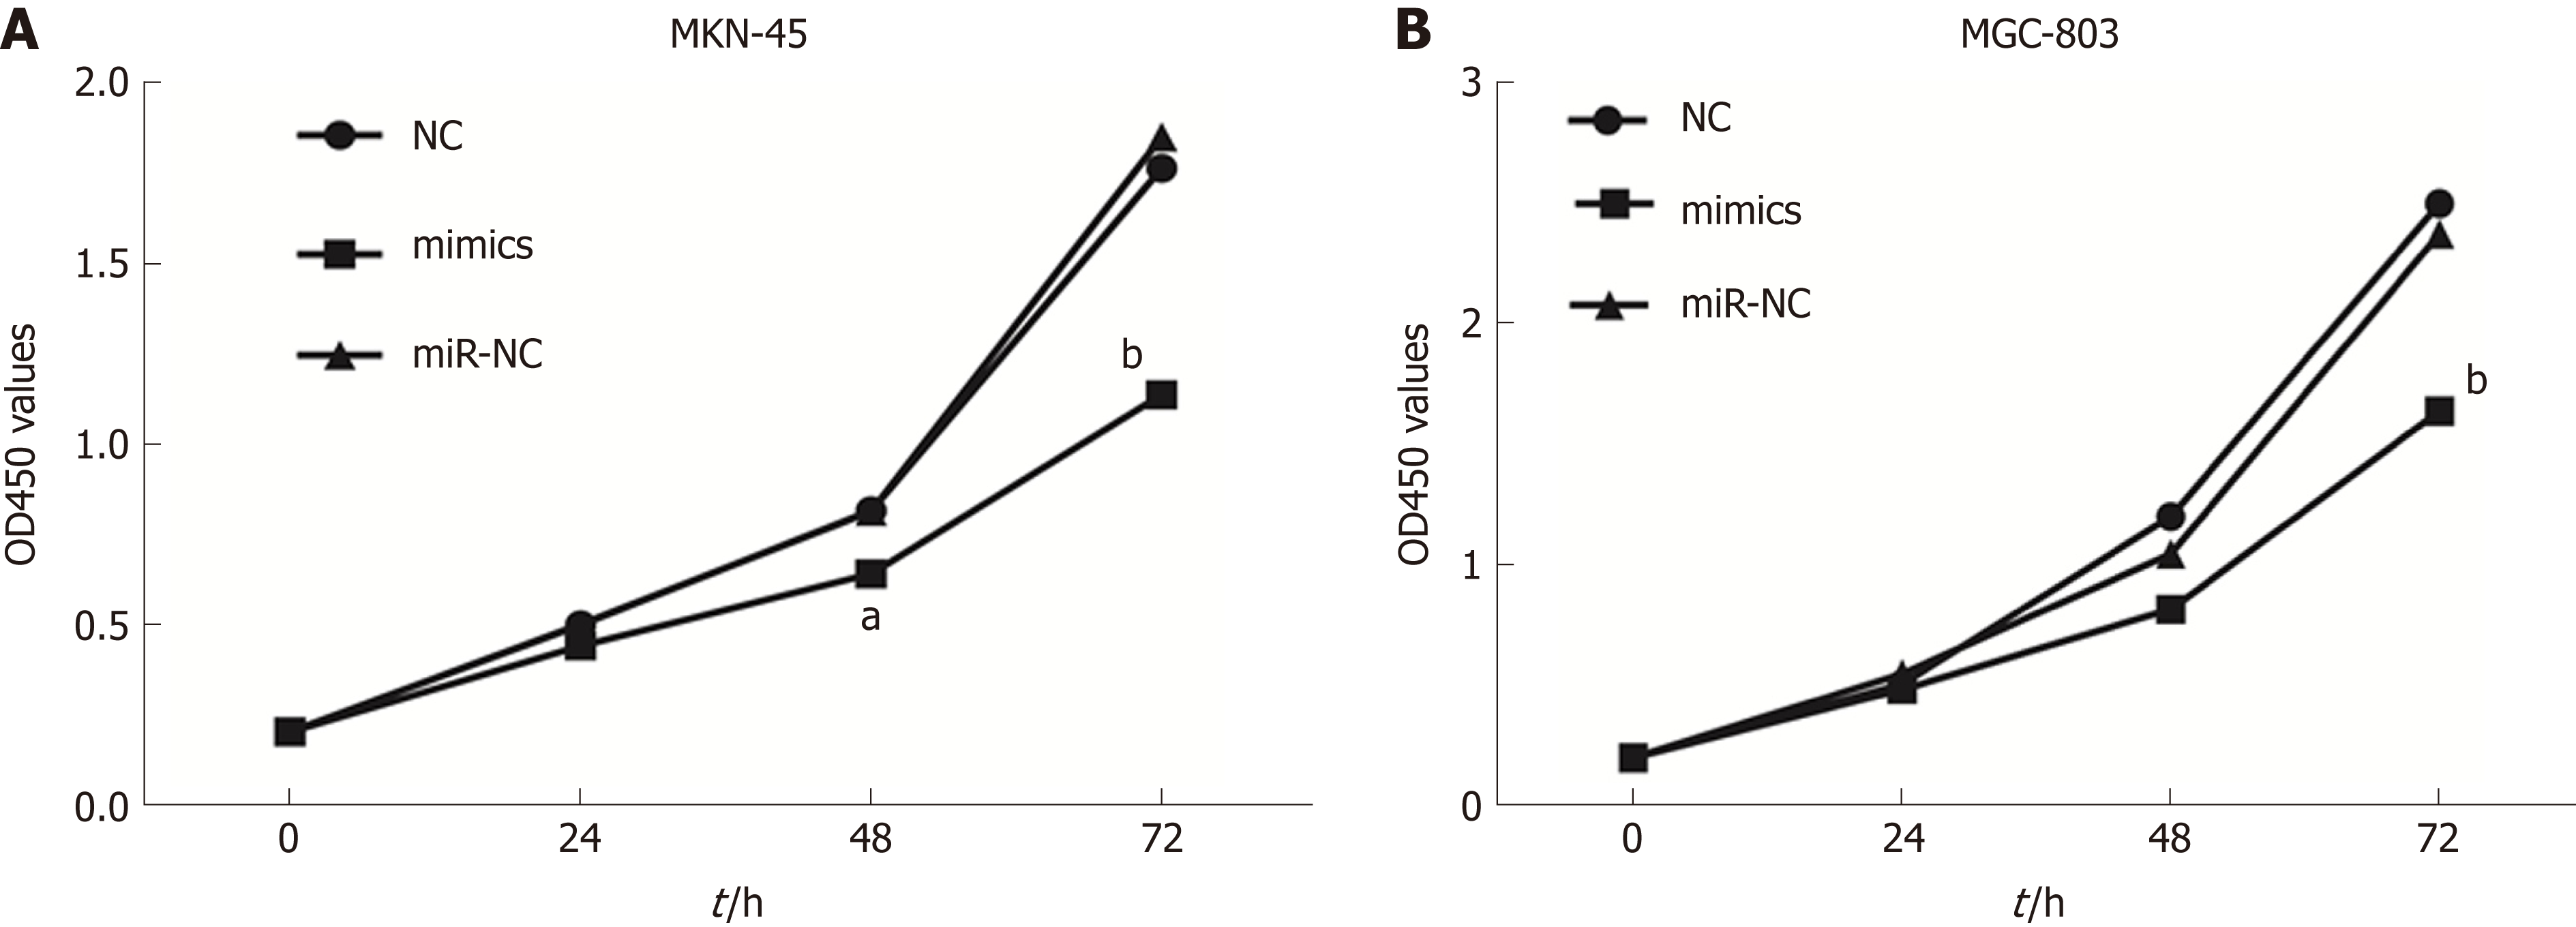
Figure 3 MicroRNA-596 suppresses gastric cancer cell proliferation.
NC, miR-NC, or miR-596 mimics was transfected into MKN-45 (A) and MGC-803 (B) cells. The cell growth rate was determined by measuring Cell Counting Kit-8 absorbance at 450 nm every 24 h (aP < 0.05, bP < 0.01 vs miR-NC).
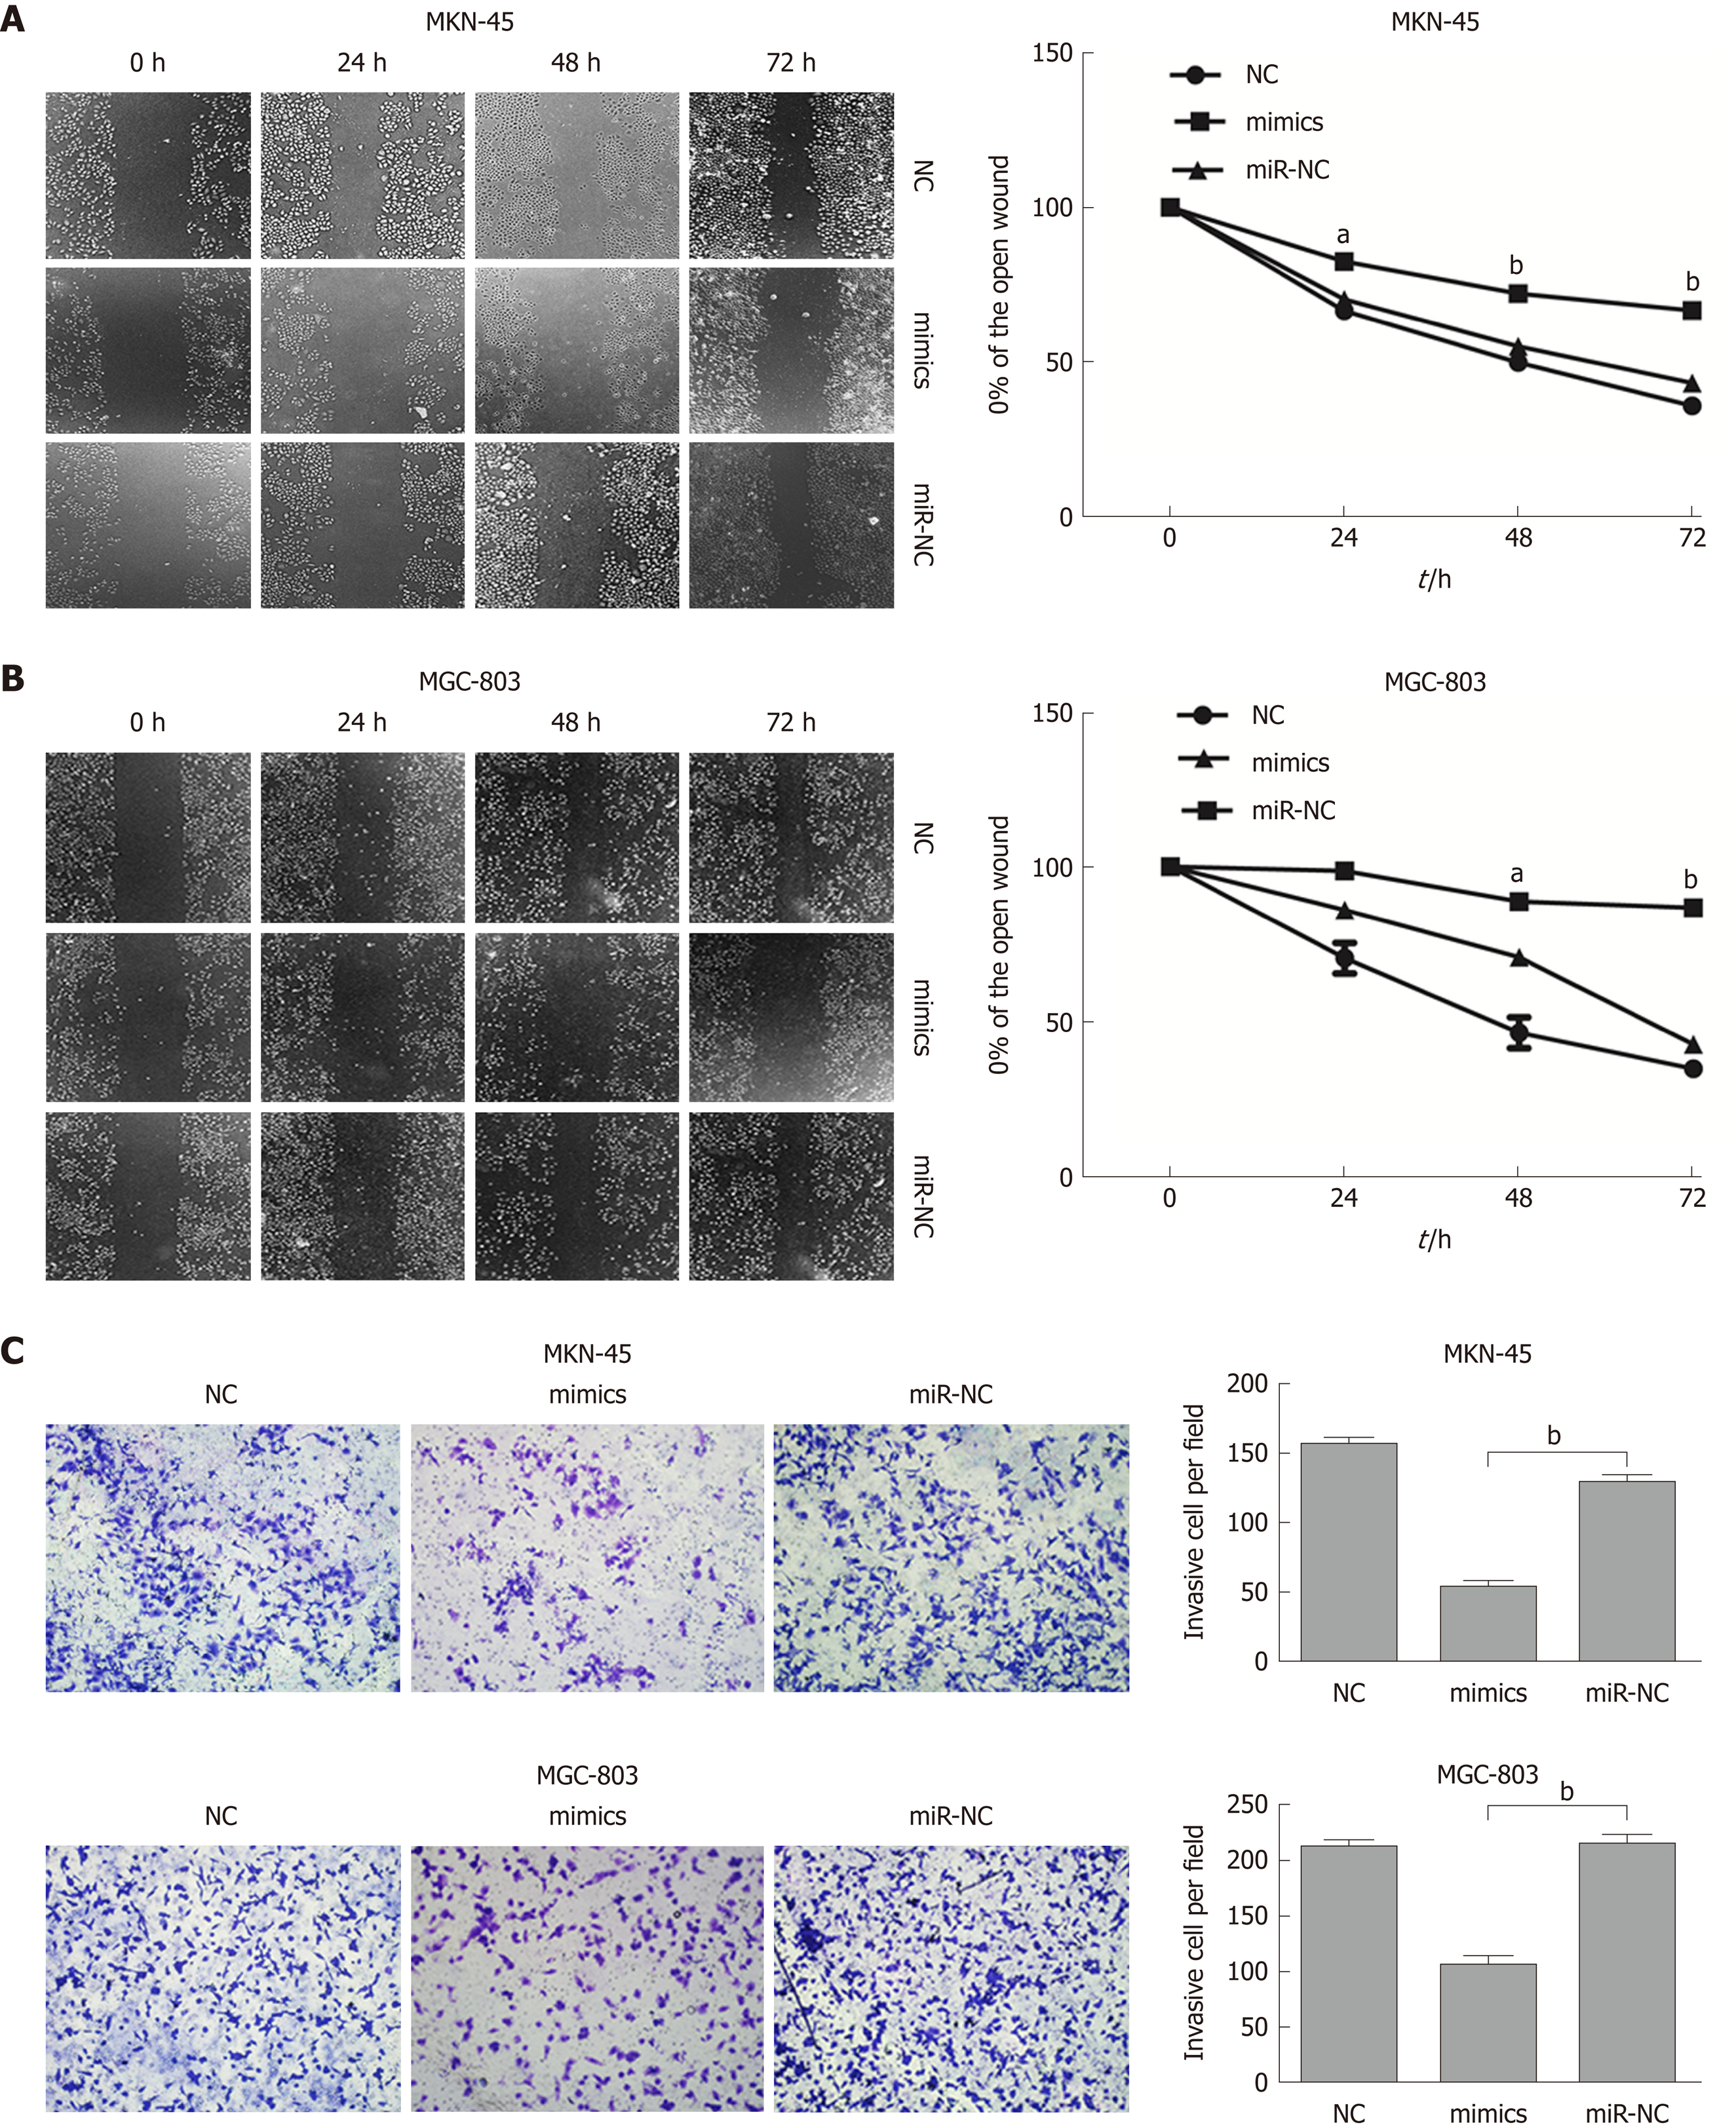
Figure 4 MicroRNA-596 inhibits gastric cancer cell migration and invasion.
A and B: The wound healing assay for detecting cell migration in MKN-45 (A) and MGC-803 (B) cells transfected with miR-NC or microRNA-596 (miR-596) mimics. C: The Transwell invasion assay for detecting cell invasion in MKN-45 and MGC-803 cells transfected with miR-NC or miR-596 mimics. aP < 0.05, bP < 0.01 vs miR-NC.
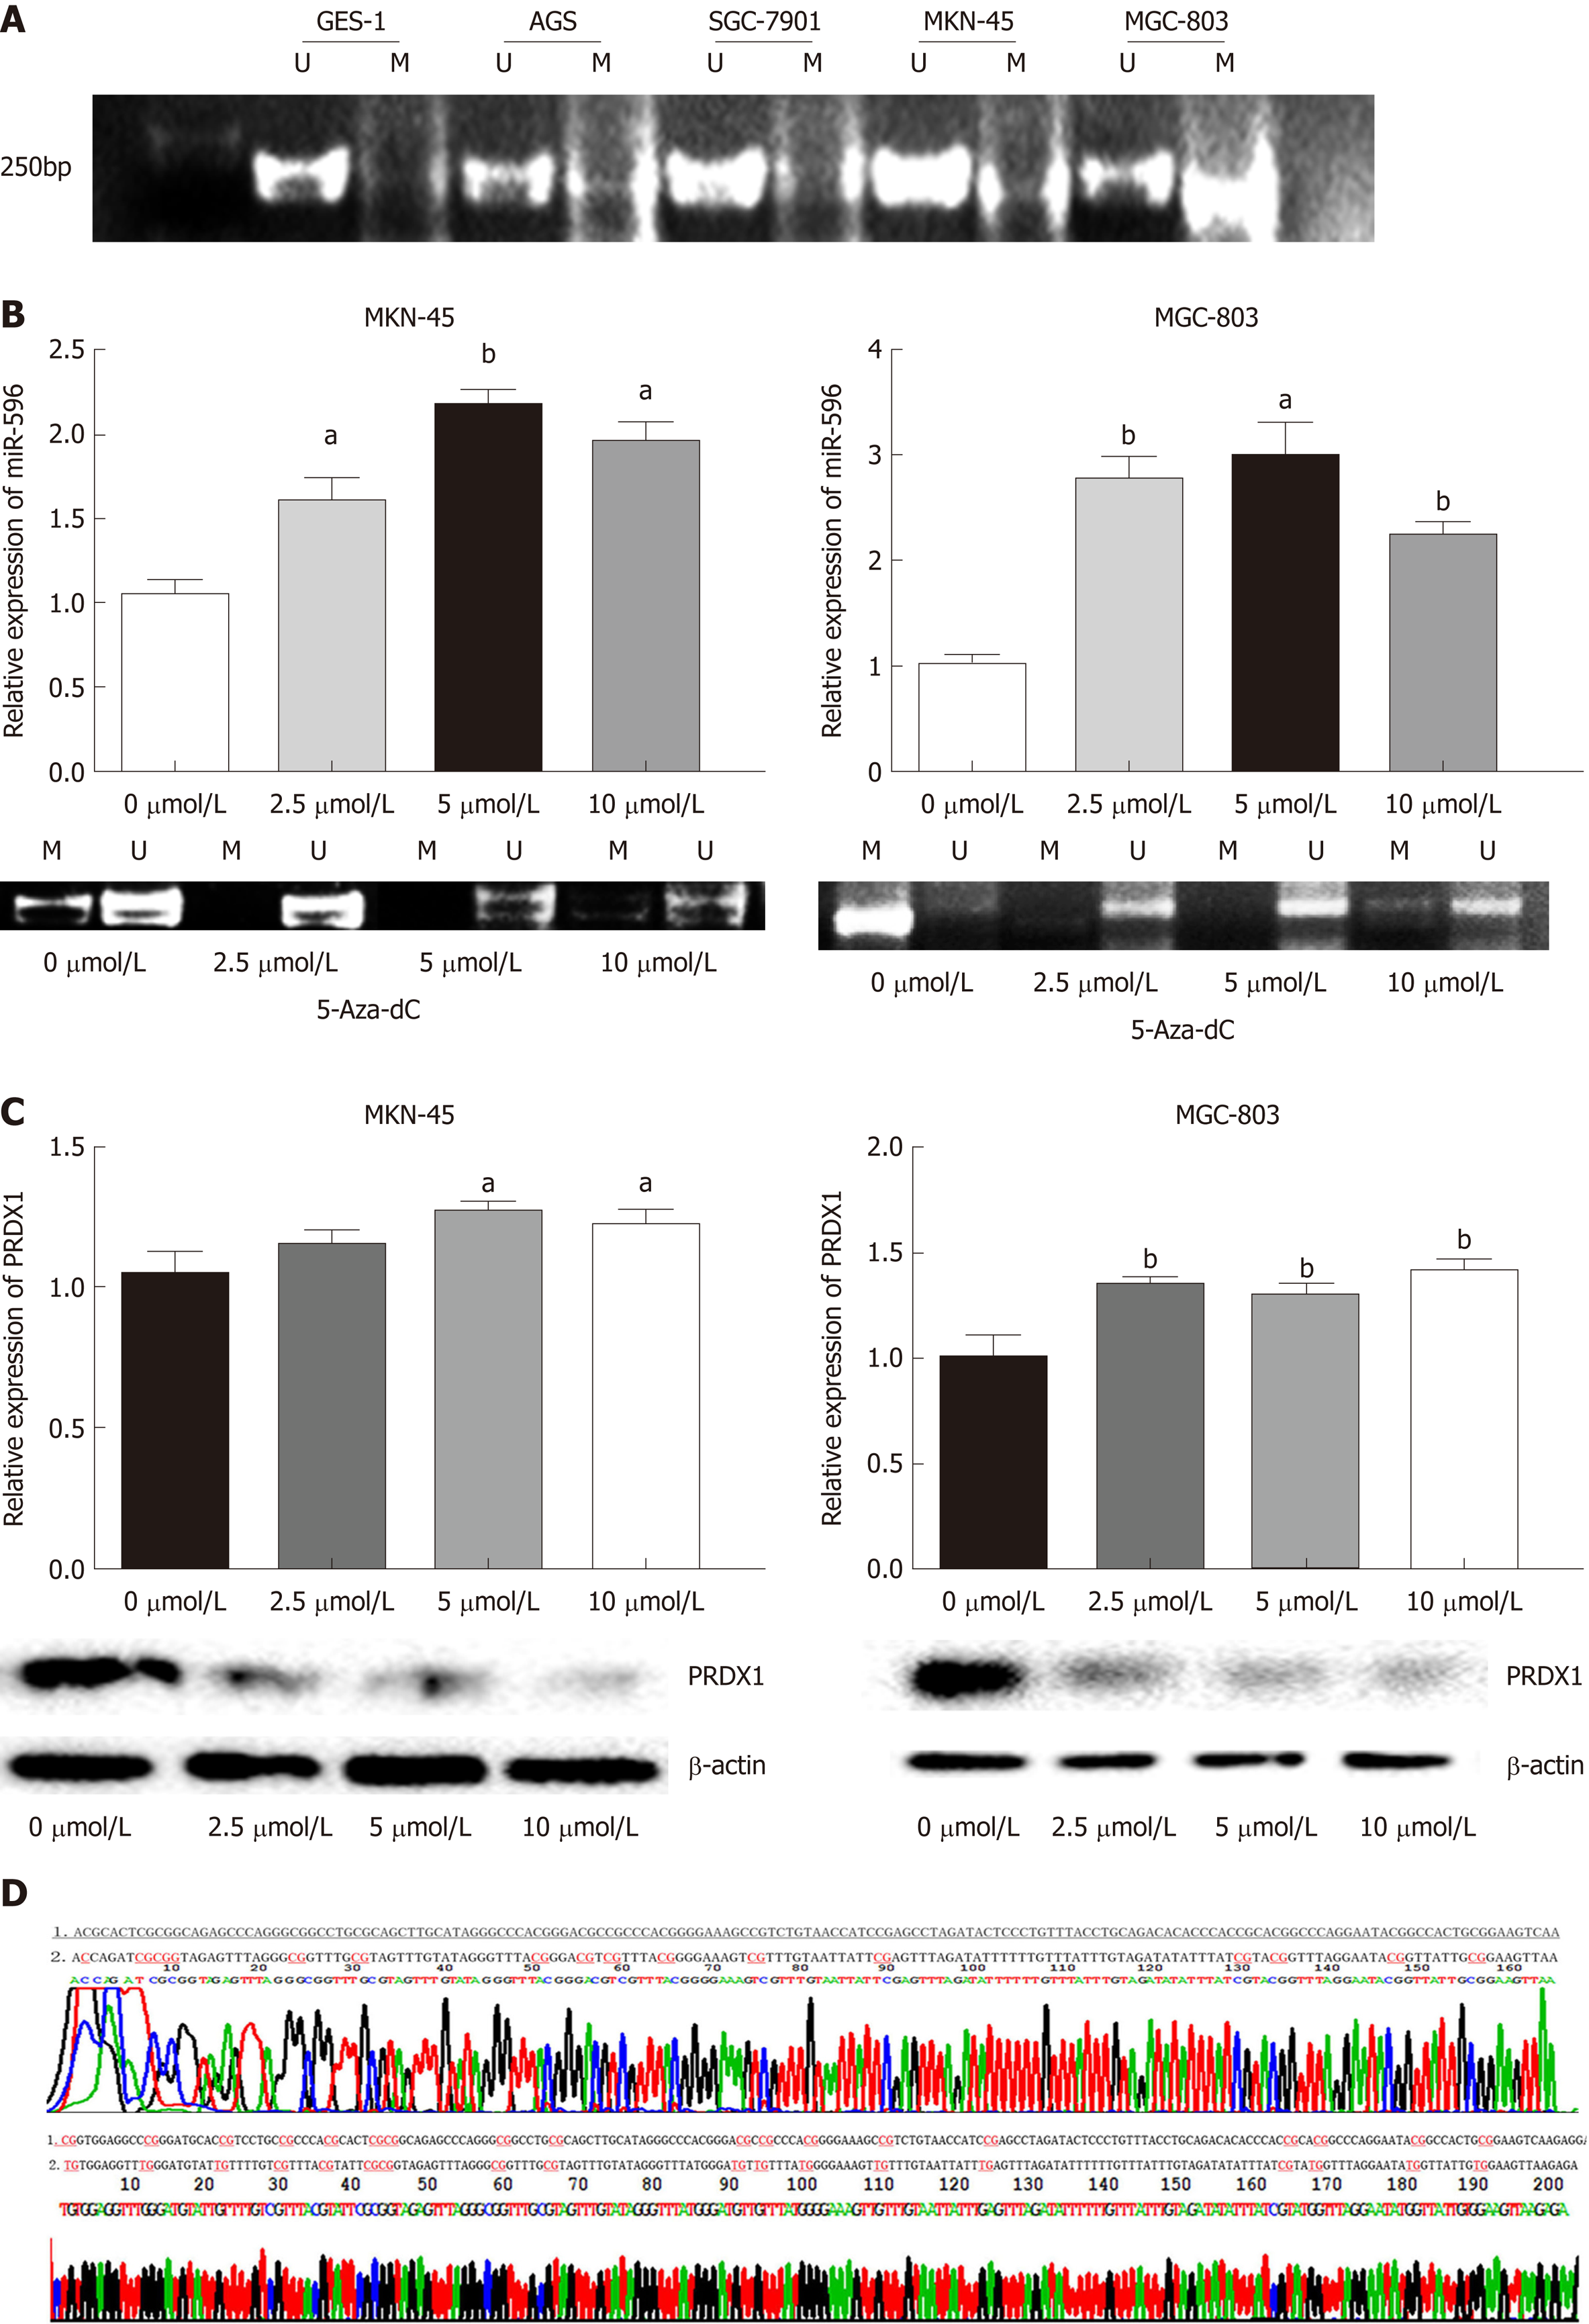
Figure 5 MicroRNA-596 is regulated by epigenetic mechanisms in gastric cancer.
A: Methylation-specific PCR (MSP) analysis of microRNA-596 (miR-596) promoter region methylation in gastric cancer (GC) cell lines. B: Quantitative real-time PCR (qRT-PCR) and MSP analysis of miR-596 expression after treatment with 5-Aza-2’-deoxycytidine (5-Aza-dC) (2.5, 5, or 10 µmol/L) in MKN-45 and MGC-803 cells, aP < 0.05, bP < 0.01 vs control cells. C: qRT-PCR and Western blot analysis of PRDX1 expression after treatment with 5-Aza-dC (2.5, 5 or 10 µmol/L) in MKN-45 and MGC-803 cells, aP < 0.05, bP < 0.01 vs control cells. D: The promoter sequence of miR-596 after treatment with sodium bisulfate. Unmethylation of cytosine was transformed to uracil, but methylated cytosine remained unchanged. 1: DNA sequence of miR-596 promoter; 2: Sequence after sodium bisulfate modification; U: Unmethylation lane; M: Methylation lane; PRDX1: Peroxiredoxin 1; MiR-596: MicroRNA-596; 5-Aza-dC: 5-Aza-2’-deoxycytidine.
Figure 6 5-Aza-2’-deoxycytidine treatment decreases proliferation in the MKN-45 (A) and MGC-803 (B) cells.
Inhibition rate (%) = (ODuntreated control - ODtreated) / ODuntreated control × 100%. 5-Aza-dC: 5-Aza-2’-deoxycytidine.
- Citation: Zhang Z, Dai DQ. MicroRNA-596 acts as a tumor suppressor in gastric cancer and is upregulated by promotor demethylation. World J Gastroenterol 2019; 25(10): 1224-1237
- URL: https://www.wjgnet.com/1007-9327/full/v25/i10/1224.htm
- DOI: https://dx.doi.org/10.3748/wjg.v25.i10.1224


