Copyright
©The Author(s) 2018.
World J Gastroenterol. Mar 7, 2018; 24(9): 982-991
Published online Mar 7, 2018. doi: 10.3748/wjg.v24.i9.982
Published online Mar 7, 2018. doi: 10.3748/wjg.v24.i9.982
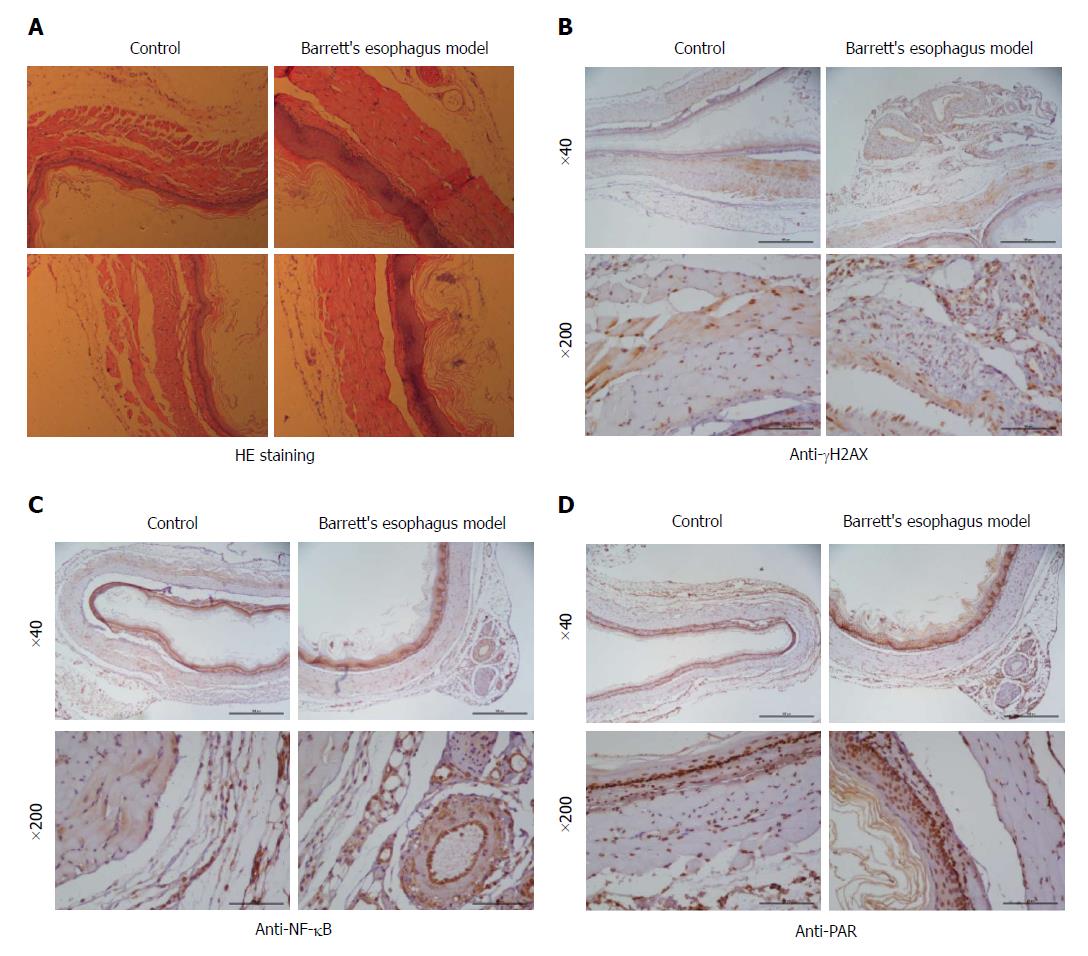
Figure 1 Establishment of a Barrett’s esophagus mouse model.
A: HE staining; B: γH2AX staining; C: NF-κB staining; D: Poly(ADP-ribose) staining.
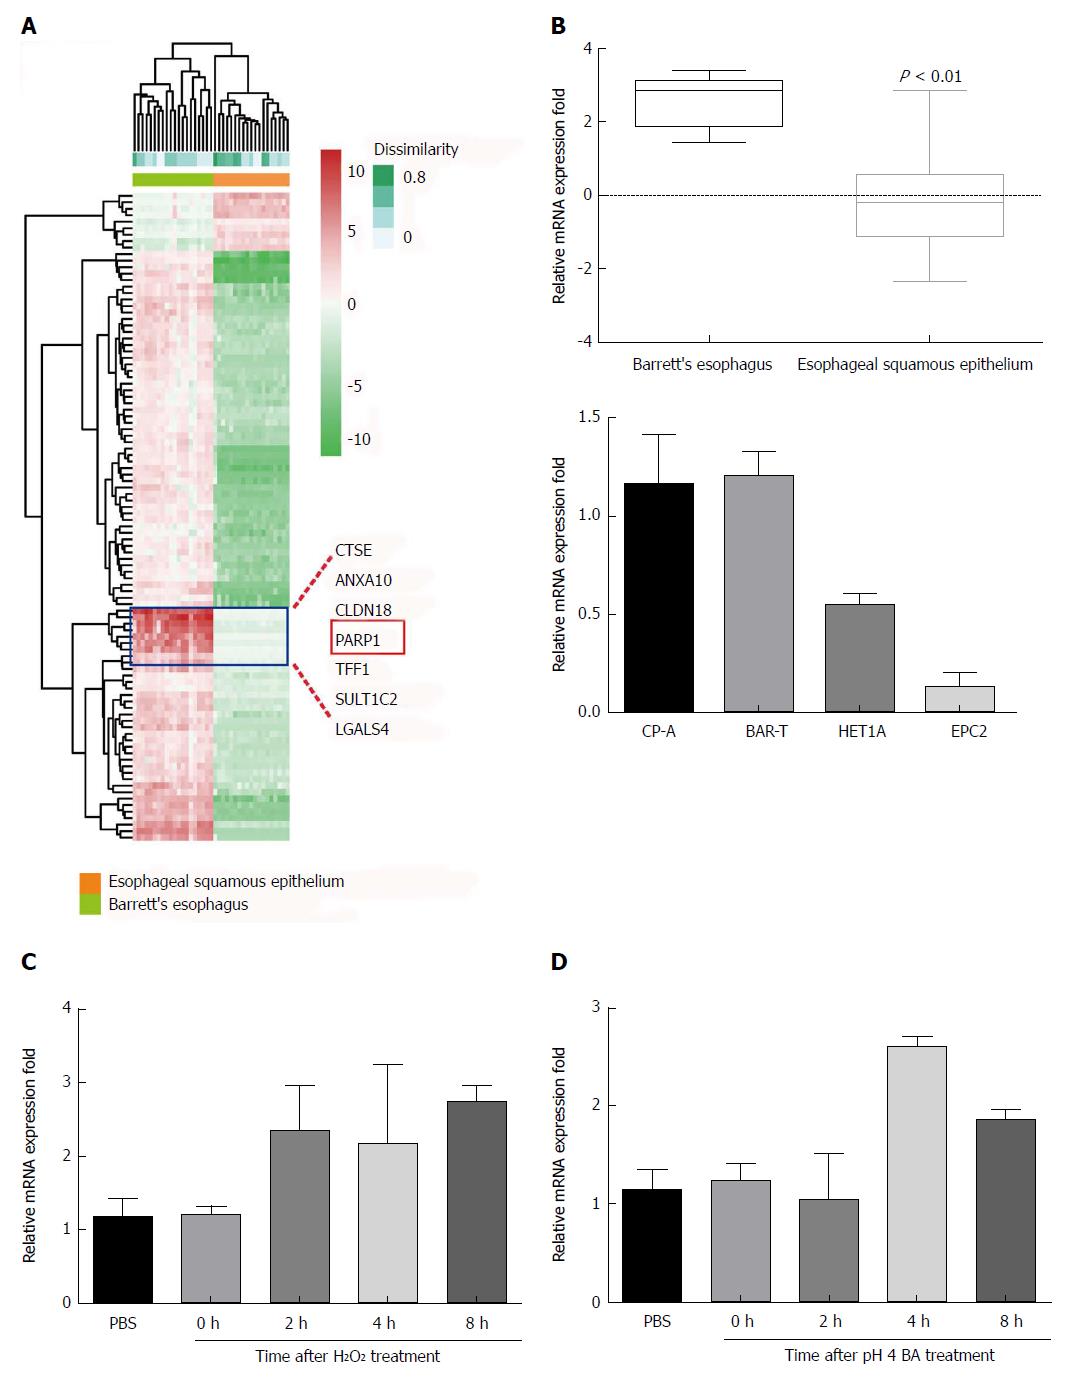
Figure 2 PARP1 is aberrantly expressed in Barrett's esophagus.
A: Microarray profiling of gene expression between esophageal squamous epithelium and Barrett's esophagus; B: PARP1 is overexpressed in Barrett's esophagus and Barrett's esophagus cell lines; C: H2O2 increased PARP1 expression; D: BAs (pH 4) increased PARP1 expression.
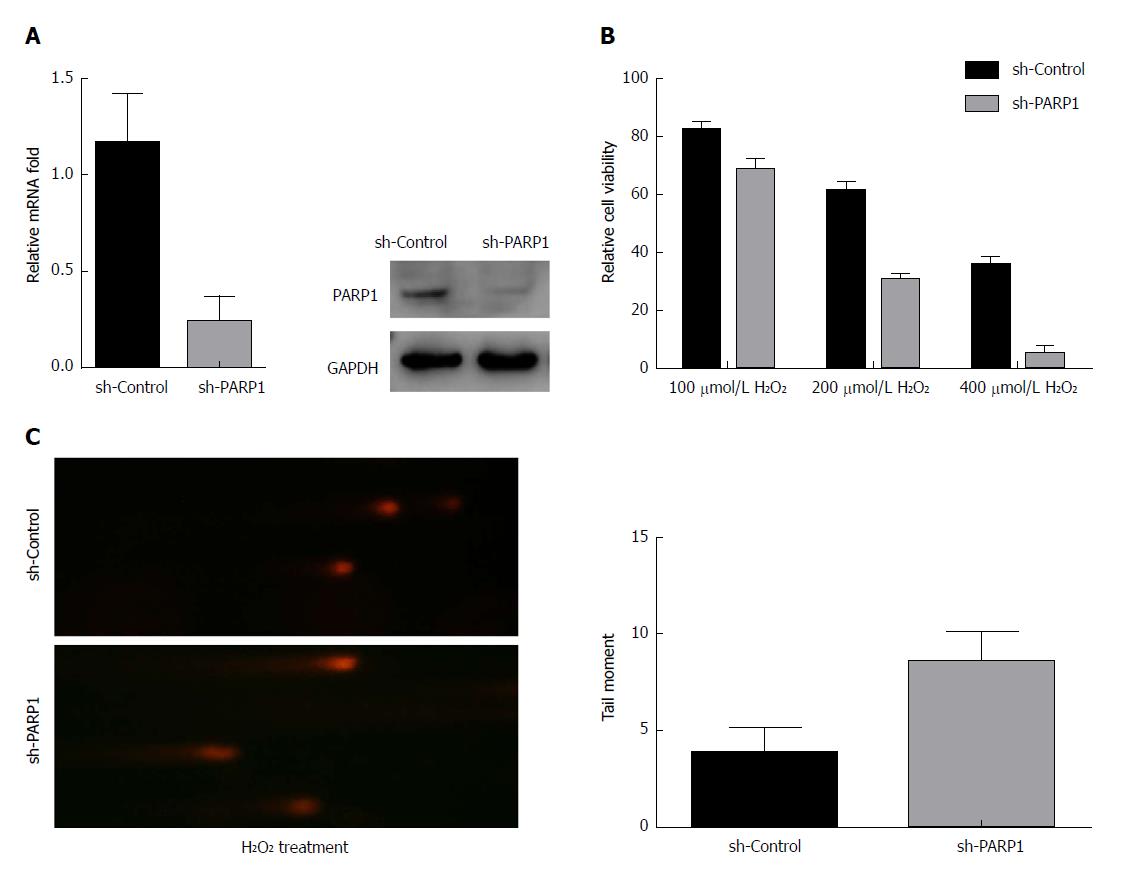
Figure 3 PARP1 protects Barrett's esophagus cells from H2O2-induced oxidative damage.
A: Knockdown of PARP1 in BAR-T cells; B: BAR-T cells were more sensitive to H2O2-induced cell death after PARP1 knockdown; C: BAR-T cells were more sensitive to H2O2-induced DNA damage after PARP1 knockdown.
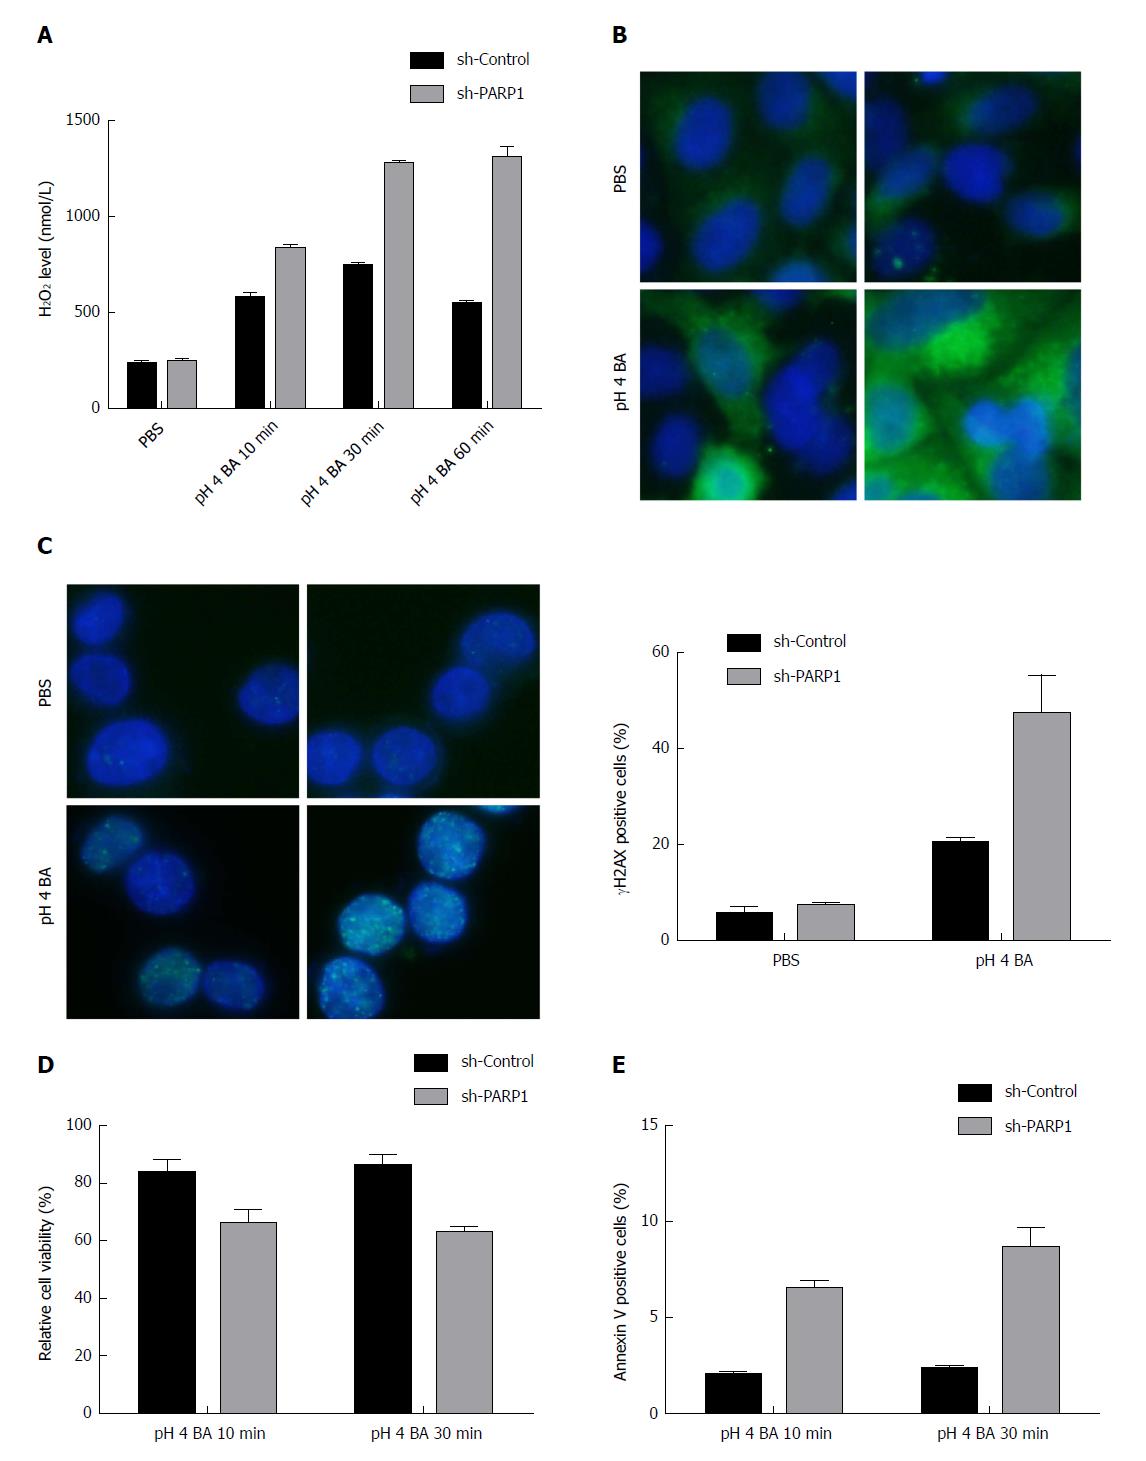
Figure 4 PARP1 protects Barrett's esophagus cells from BA (pH 4)-induced oxidative damage.
A: H2O2 levels in PARP1-depleted BAR-T cells; B: 8-OXOG staining in PARP1-depleted BAR-T cells; C: γH2AX staining in PARP1- depleted BAR-T cells; D and E: Decreased cell viability in PARP1-depleted BAR-T cells.
- Citation: Zhang C, Ma T, Luo T, Li A, Gao X, Wang ZG, Li F. Dysregulation of PARP1 is involved in development of Barrett’s esophagus. World J Gastroenterol 2018; 24(9): 982-991
- URL: https://www.wjgnet.com/1007-9327/full/v24/i9/982.htm
- DOI: https://dx.doi.org/10.3748/wjg.v24.i9.982


