Copyright
©The Author(s) 2018.
World J Gastroenterol. Feb 28, 2018; 24(8): 929-940
Published online Feb 28, 2018. doi: 10.3748/wjg.v24.i8.929
Published online Feb 28, 2018. doi: 10.3748/wjg.v24.i8.929
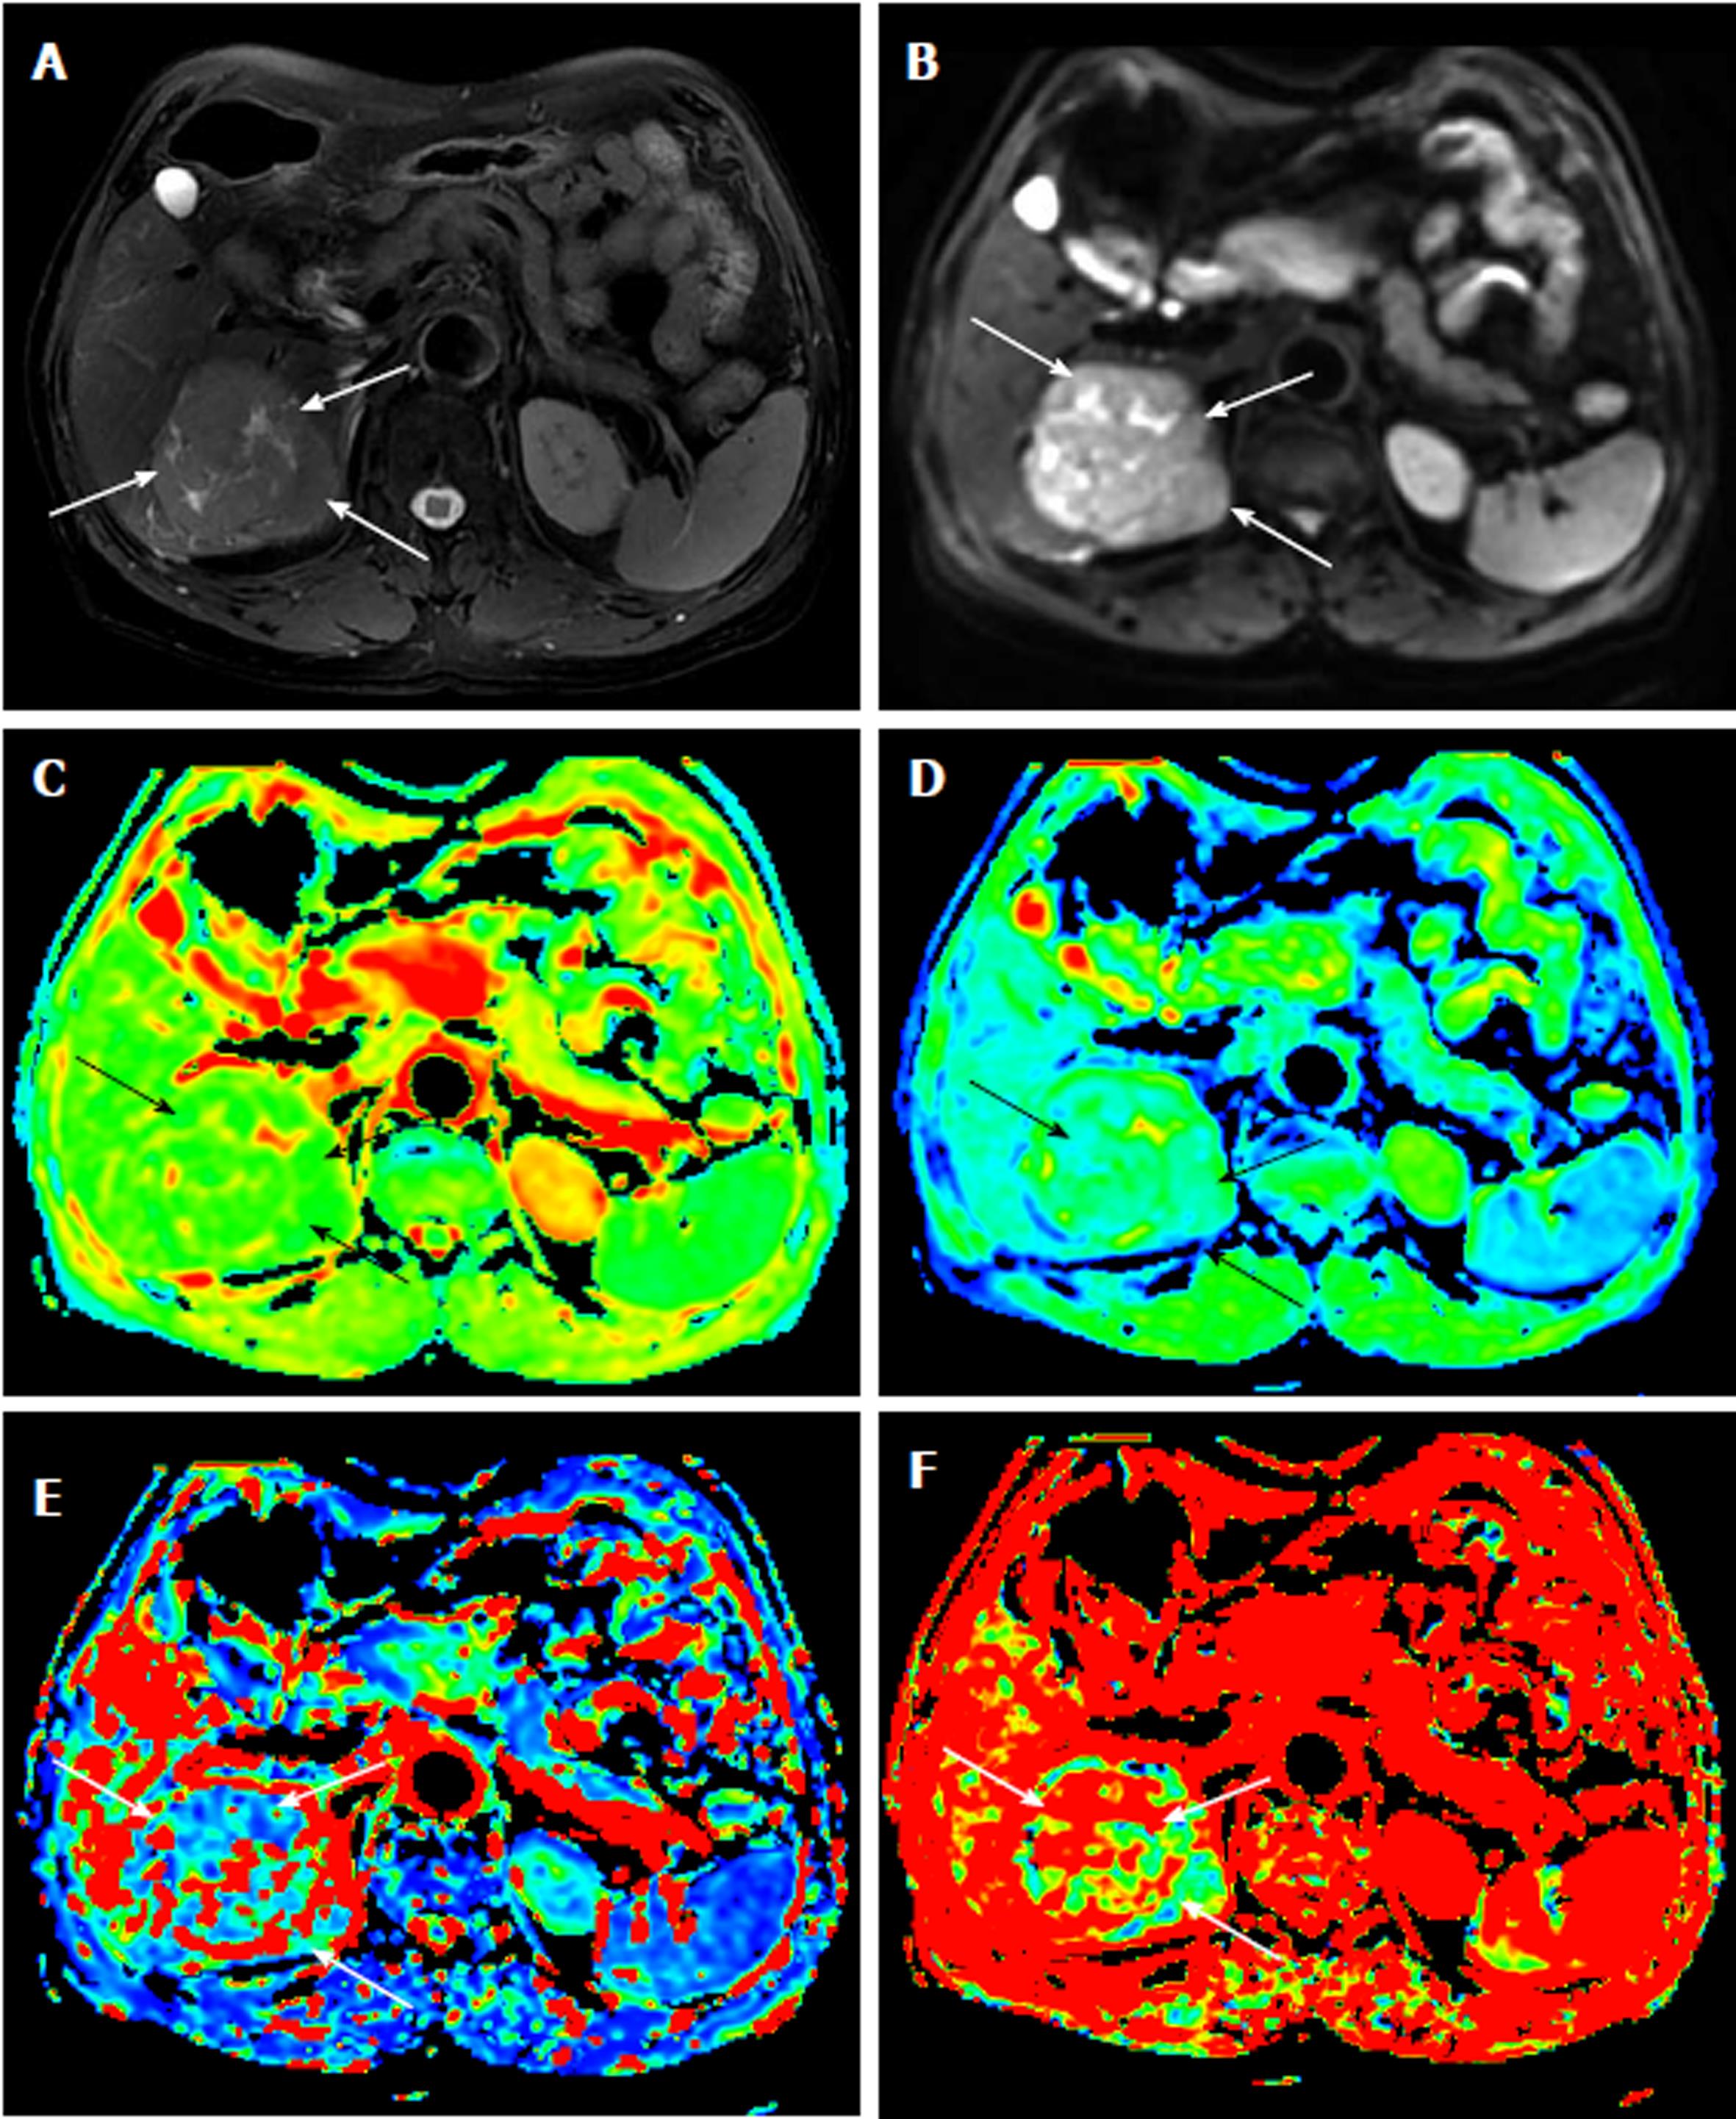
Figure 1 Magnetic resonance images of a 65-year-old man with an 8-cm surgically verified hepatocellular carcinoma with an Edmondson-Steiner grade 1.
A: T2-weighted image; B: Diffusion-weighted image with a b value of 10 s/mm2; C-F: Parametric maps (ADC, D, D*, and f, respectively) calculated from the IVIM diffusion-weighted imaging data. The tumor (white arrow) demonstrates a slightly high signal intensity on the T2-weighted image and a high signal intensity on the DWI image. The values of ADC, D, D*, and f for the ROIs of the HCC were 1.550 × 10⁻³ mm2/s, 1.110 × 10⁻³ mm2/s, 6.55 × 10⁻³ mm2/s, and 0.387, respectively, which indicated an Edmondson-Steiner grade 1 HCC. HCC: Hepatocellular carcinoma; IVIM: Intravoxel incoherent motion; DWI: Diffusion-weighted imaging.
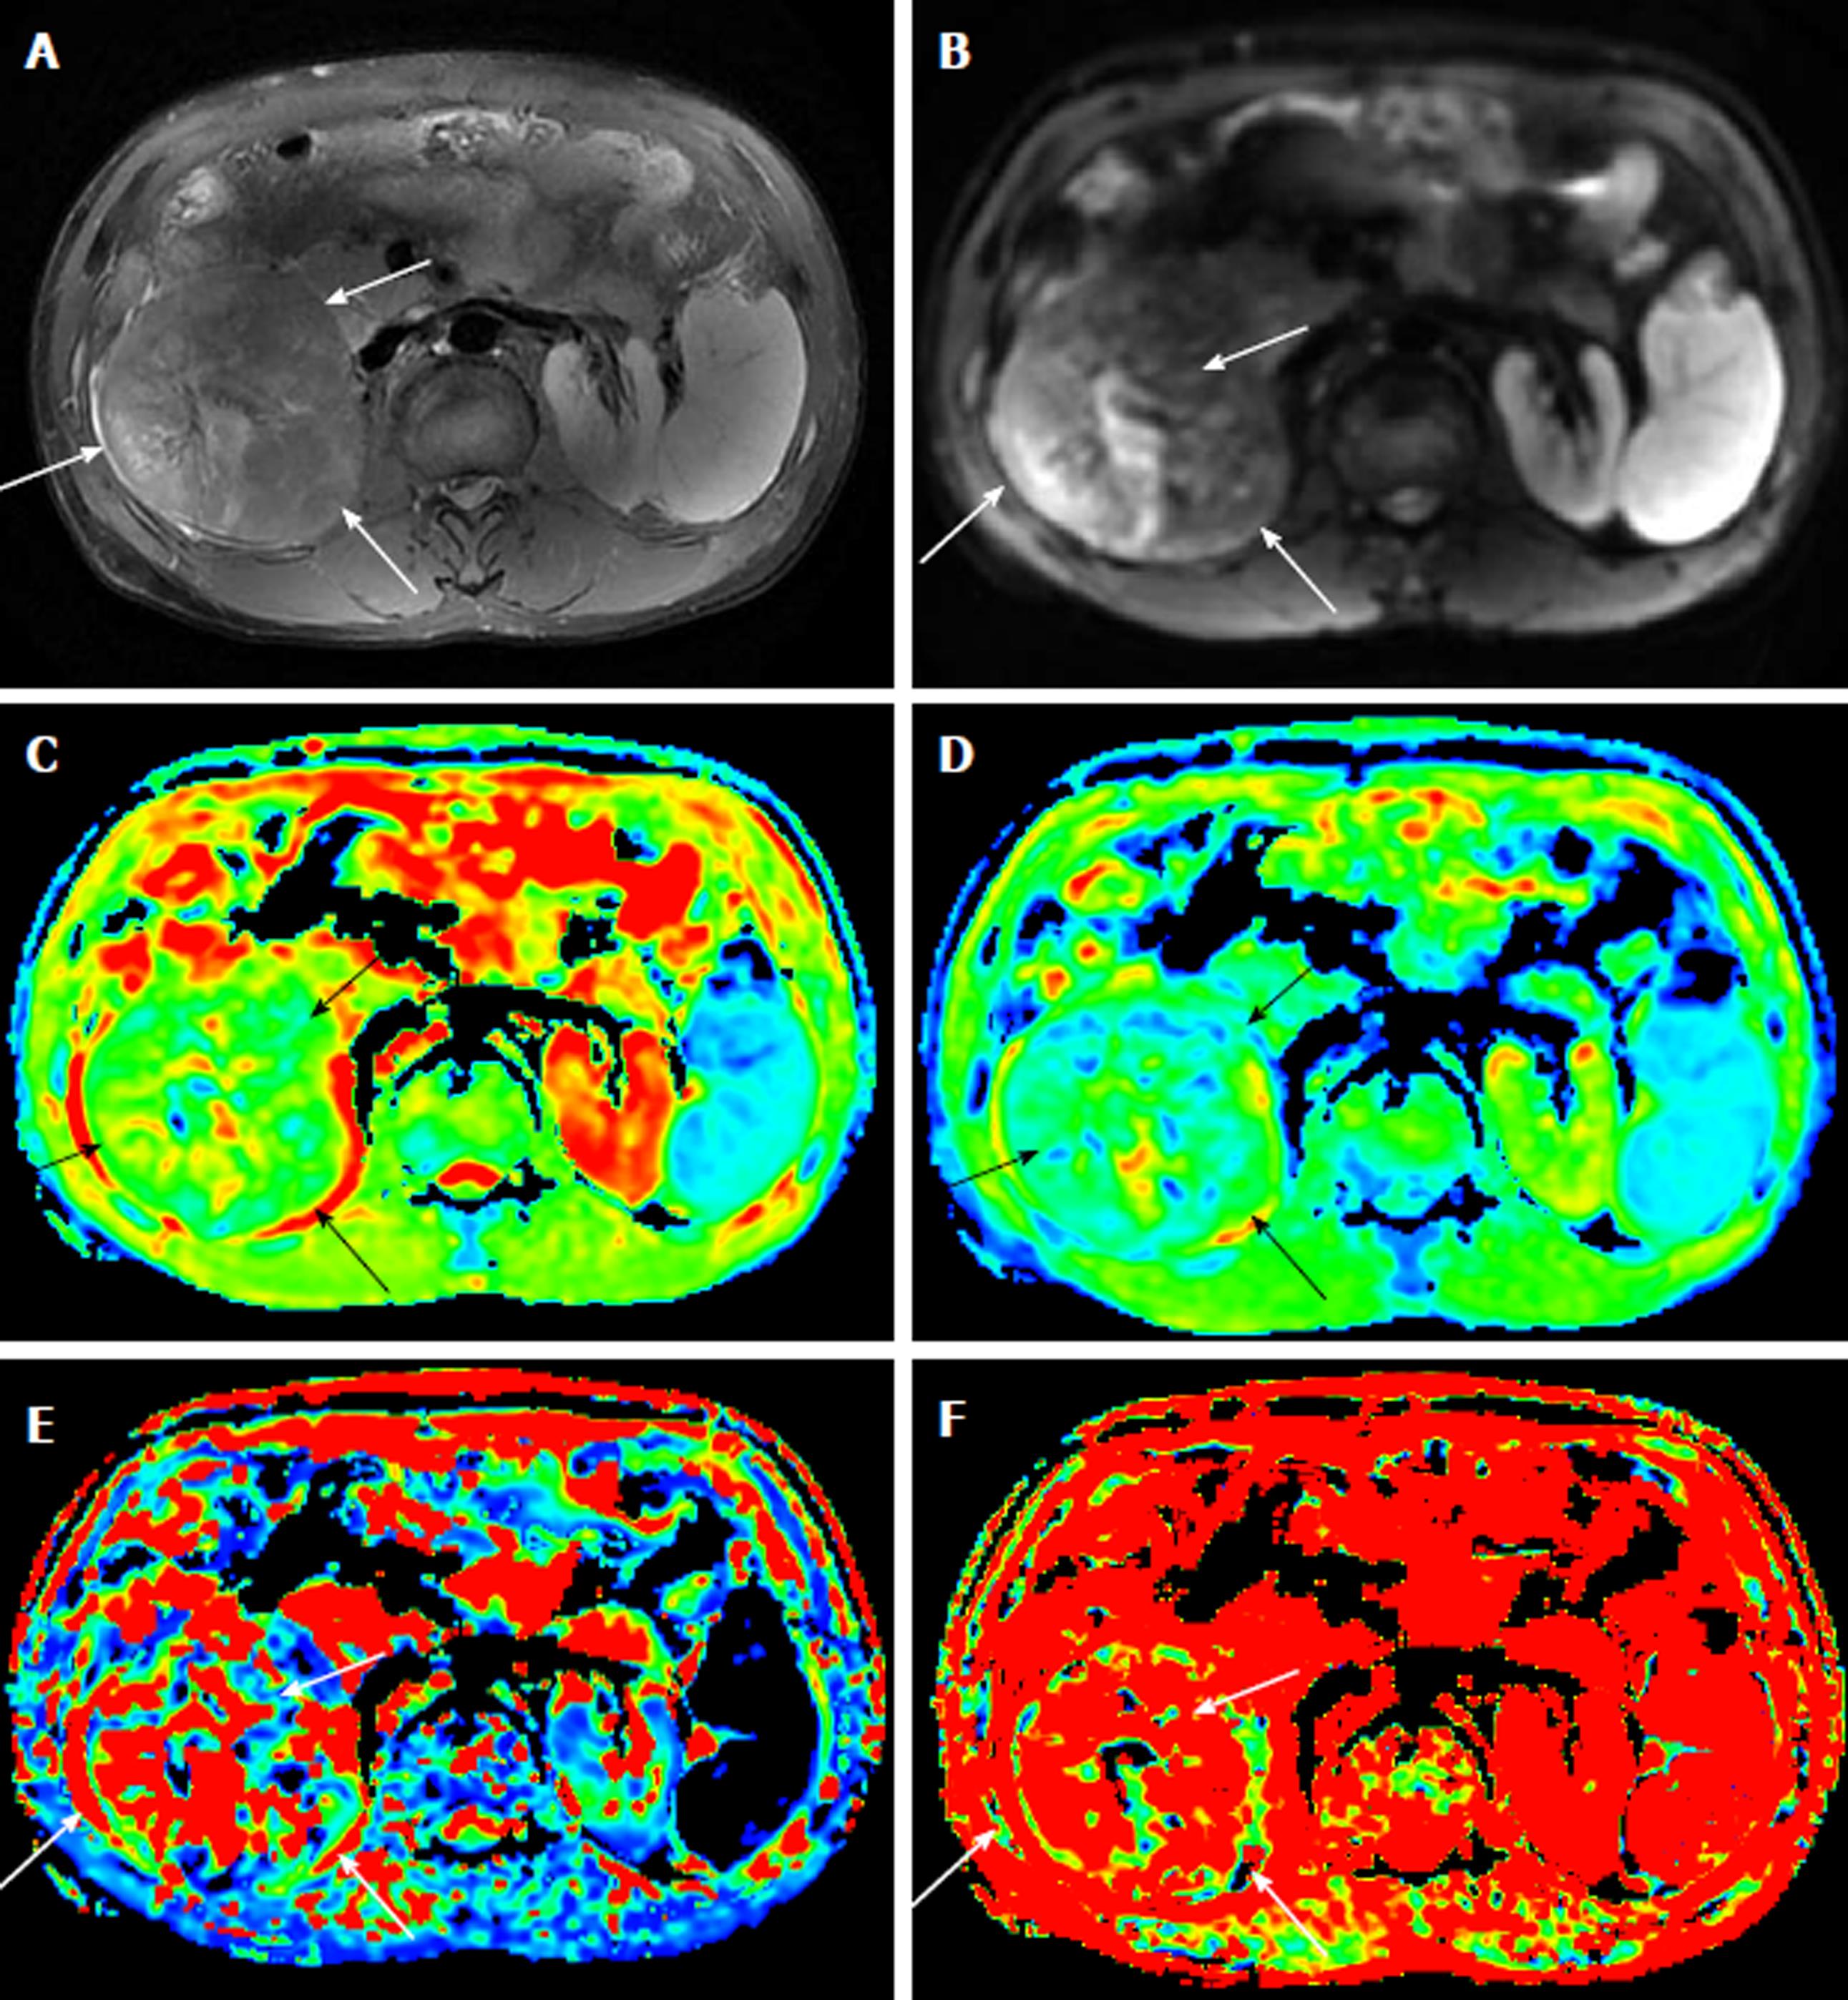
Figure 2 Magnetic resonance images of a 47-year-old man with a 10-cm surgically verified hepatocellular carcinoma of with an Edmondson-Steiner grade 2.
A: T2-weighted image; B: Diffusion-weighted image with a b value of 10 s/mm2; C-F: Parametric maps (ADC, D, D*, and f, respectively) calculated from the IVIM diffusion-weighted imaging data. The tumor (white arrow) demonstrates a slightly high signal intensity on the T2-weighted image and a high signal intensity on the DWI image. The values of the ADC, D, D*, and f for the ROIs of the HCC were 1.310 × 10⁻³ mm2/s, 0.885 × 10⁻³ mm2/s, 27.8 × 10⁻³ mm2/s, and 0.450, respectively, which indicated an Edmondson-Steiner grade 2 HCC. HCC: Hepatocellular carcinoma; IVIM: Intravoxel incoherent motion; DWI: Diffusion-weighted imaging.
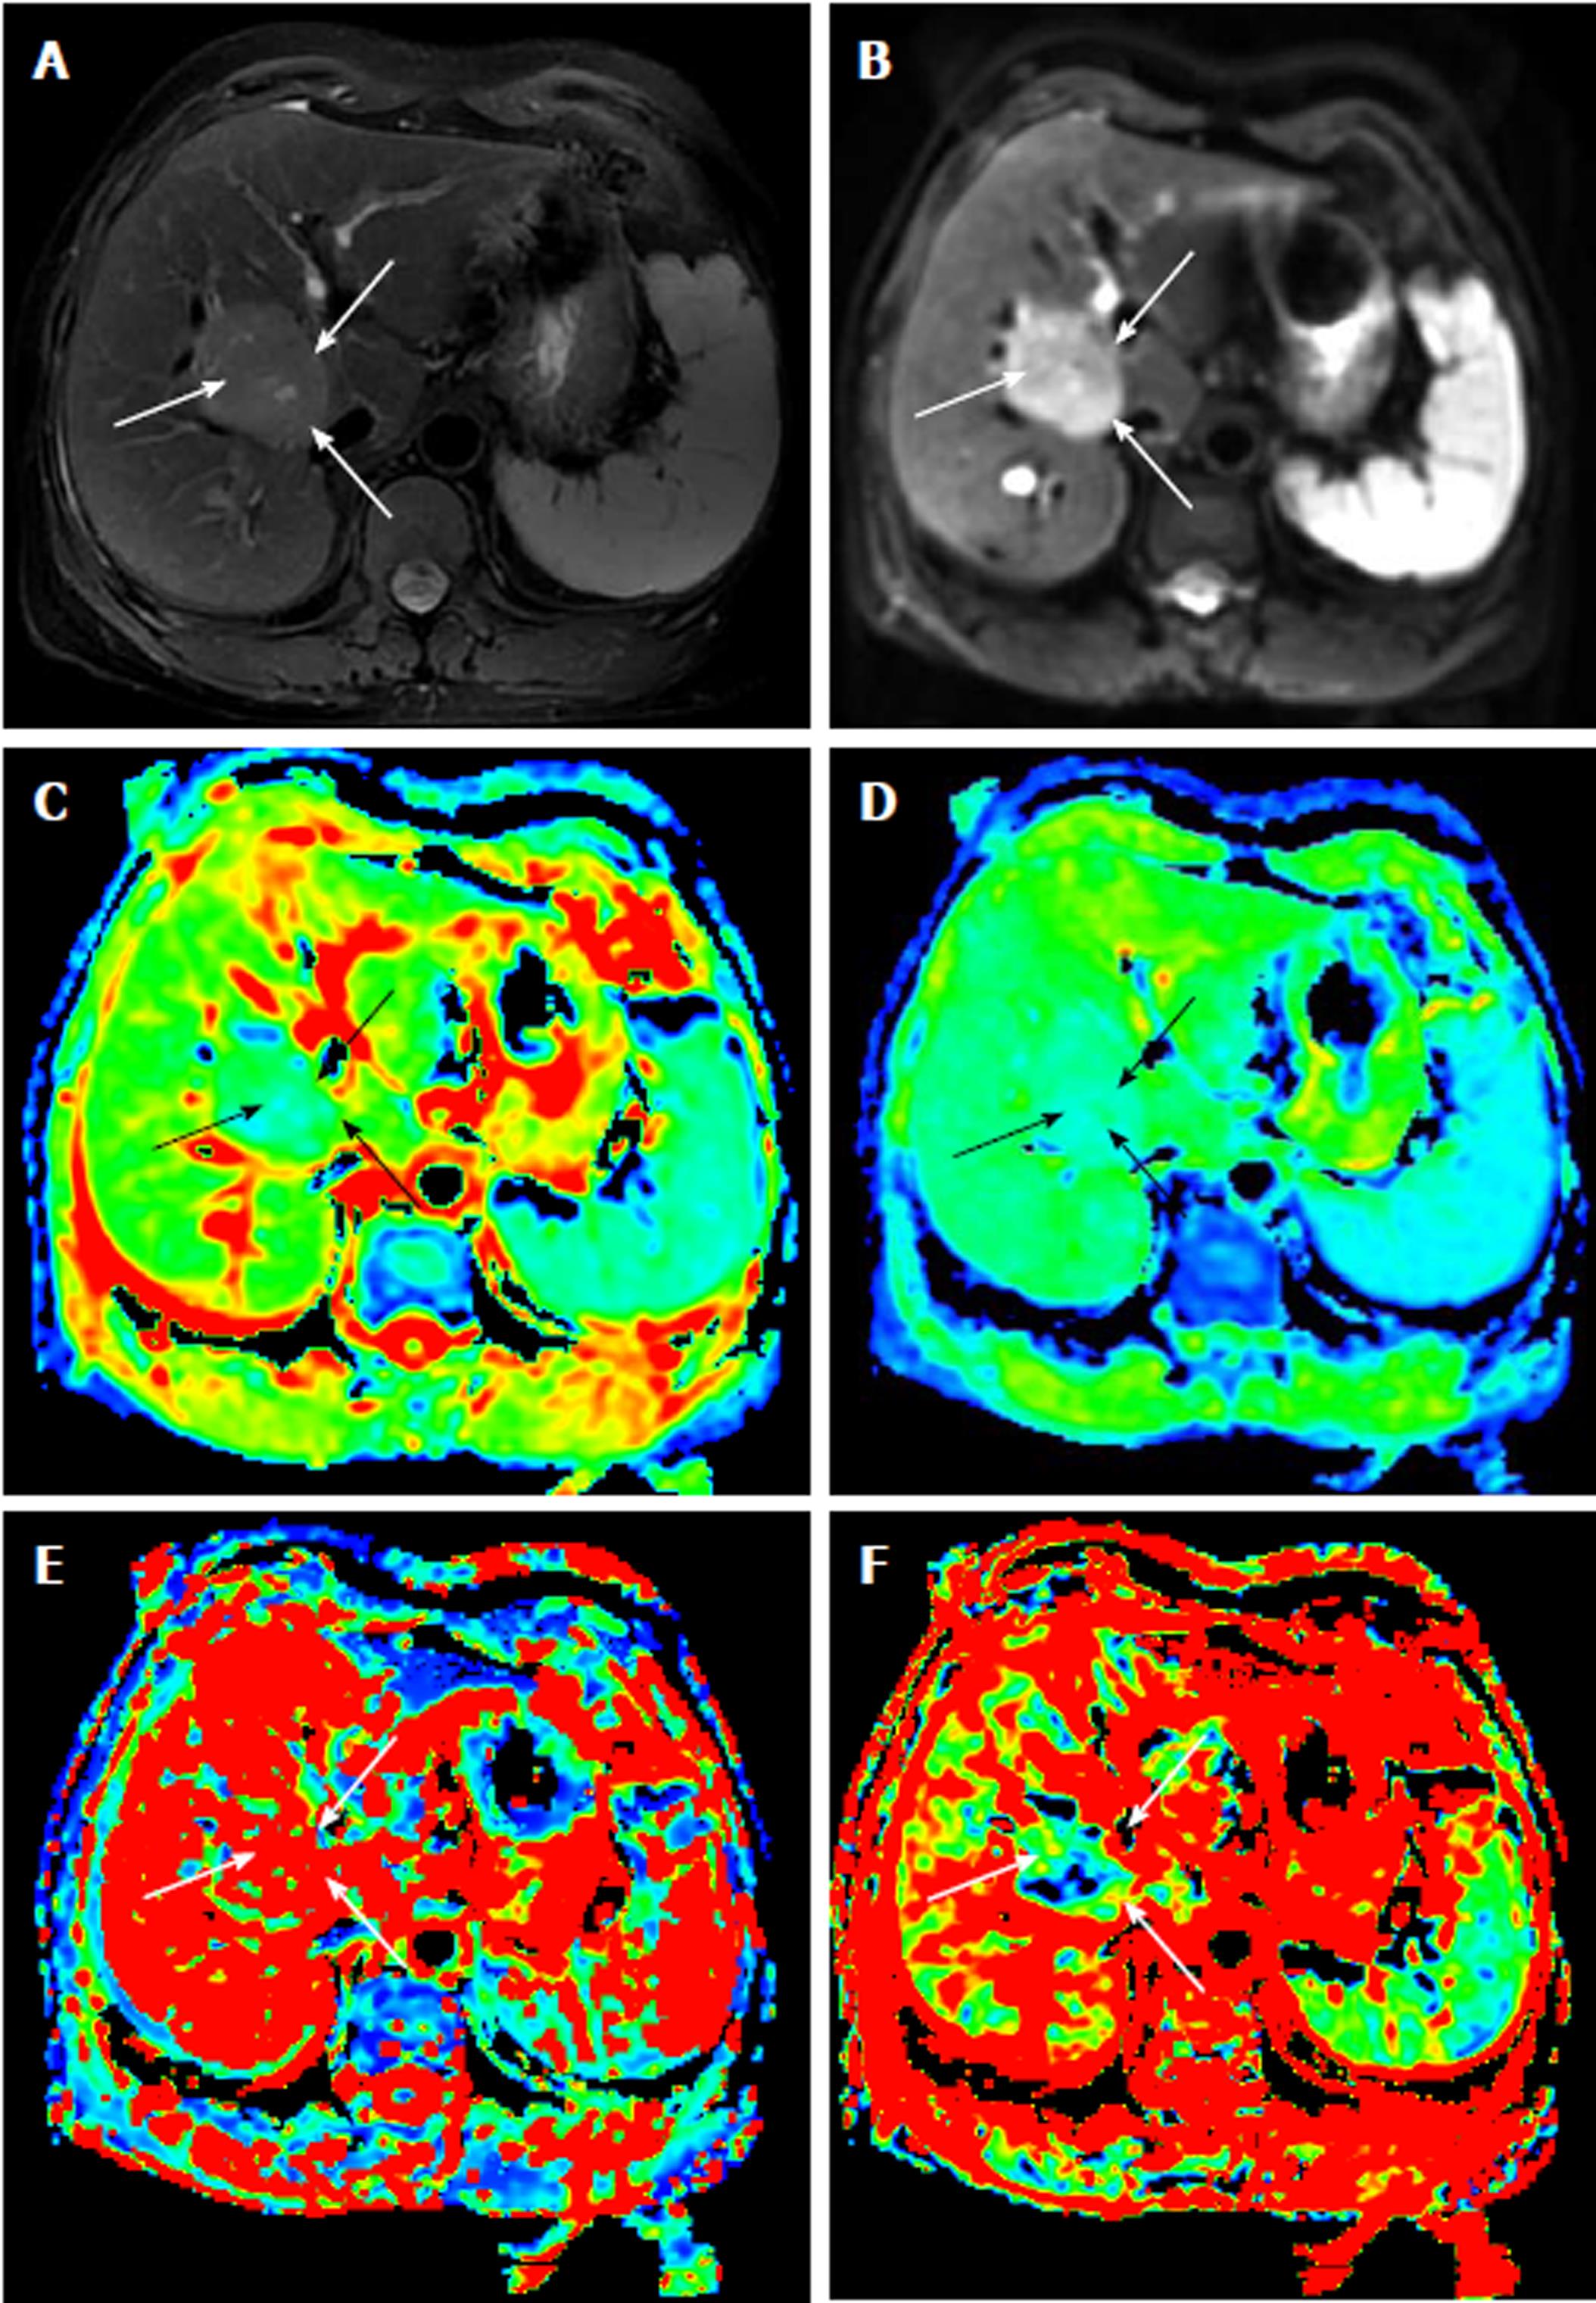
Figure 3 Magnetic resonance images of a 43-year-old woman with a 5-cm surgically verified hepatocellular carcinoma with an Edmondson-Steiner grade 3.
A: T2-weighted image, B: Diffusion-weighted image with a b value of 10 s/mm2; C-F: Parametric maps (ADC, D, D*, and f, respectively) calculated from the IVIM diffusion-weighted imaging data. The tumor (white arrow) demonstrates a slightly high signal intensity on the T2-weighted image and a high signal intensity on the DWI image. The values of the ADC, D, D*, and f for the ROIs of the HCC were 1.060 × 10⁻³ mm2/s, 0.659 × 10⁻³ mm2/s, 12.1 × 10⁻³ mm2/s, and 0.109, respectively, which indicated an Edmondson-Steiner grade 3 HCC. HCC: Hepatocellular carcinomas; IVIM: Intravoxel incoherent motion; DWI: Diffusion-weighted imaging.
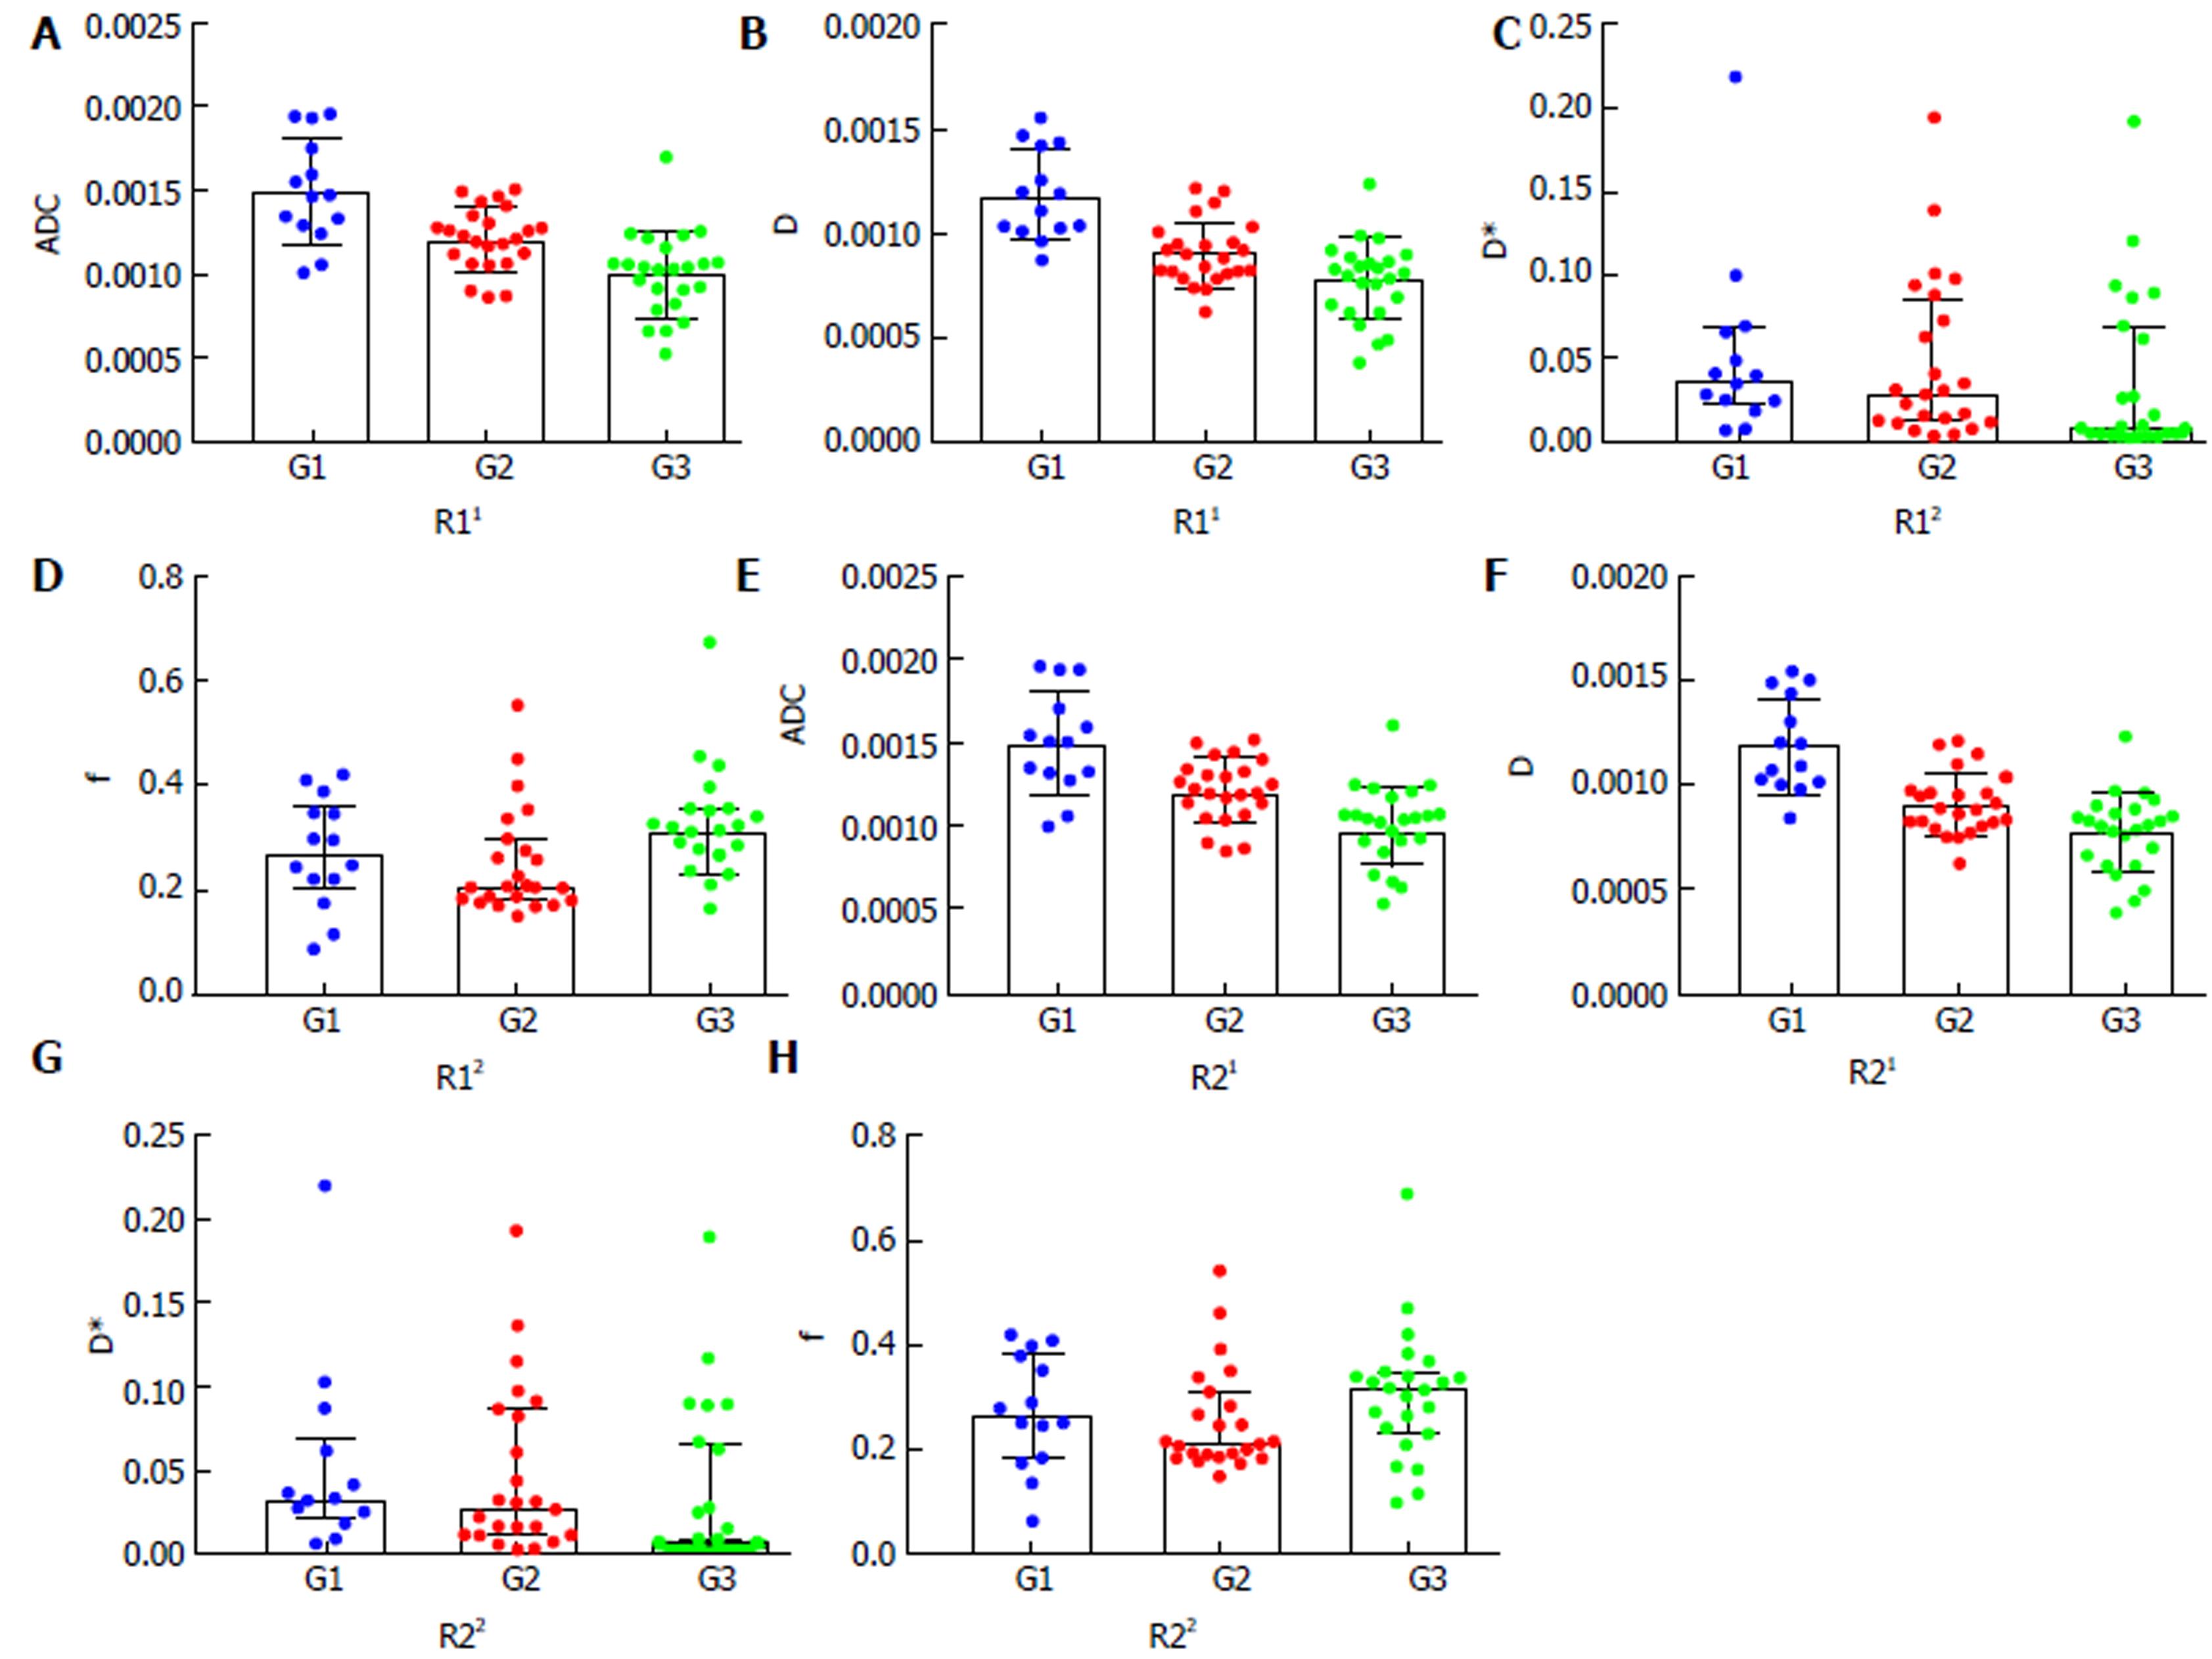
Figure 4 Column and scatter plot diagrams reporting the quantitative comparison of the differences in the intravoxel incoherent motion and conventional diffusion-weighted imaging parameters among the three groups of hepatocellular carcinoma.
A-D: Quantitative comparison of the differences among the three groups in the ADC, D, D*, and f values, respectively, by radiologist 1; E and F: Quantitative comparison of the differences among the three groups in the ADC, D, D*, and f values, respectively, by radiologist 2. The differences in the ADC and D values among the different grades were statistically significant (P < 0.001); the differences between the G1 and G2, G1 and G3, and G2 and G3 were all statistically significant (P < 0.05). No statistical significance was found for the D* or the f values (P > 0.05). ADC, D, and D* are in units of mm2/s; f is in unit of 100%. 1Mean with SD; 2median with interquartile range. R1: Radiologist 1; R2: Radiologist 2; HCC: Hepatocellular carcinomas; IVIM: Intravoxel incoherent motion; DWI: Diffusion-weighted imaging, ADC: Apparent diffusion coefficient.
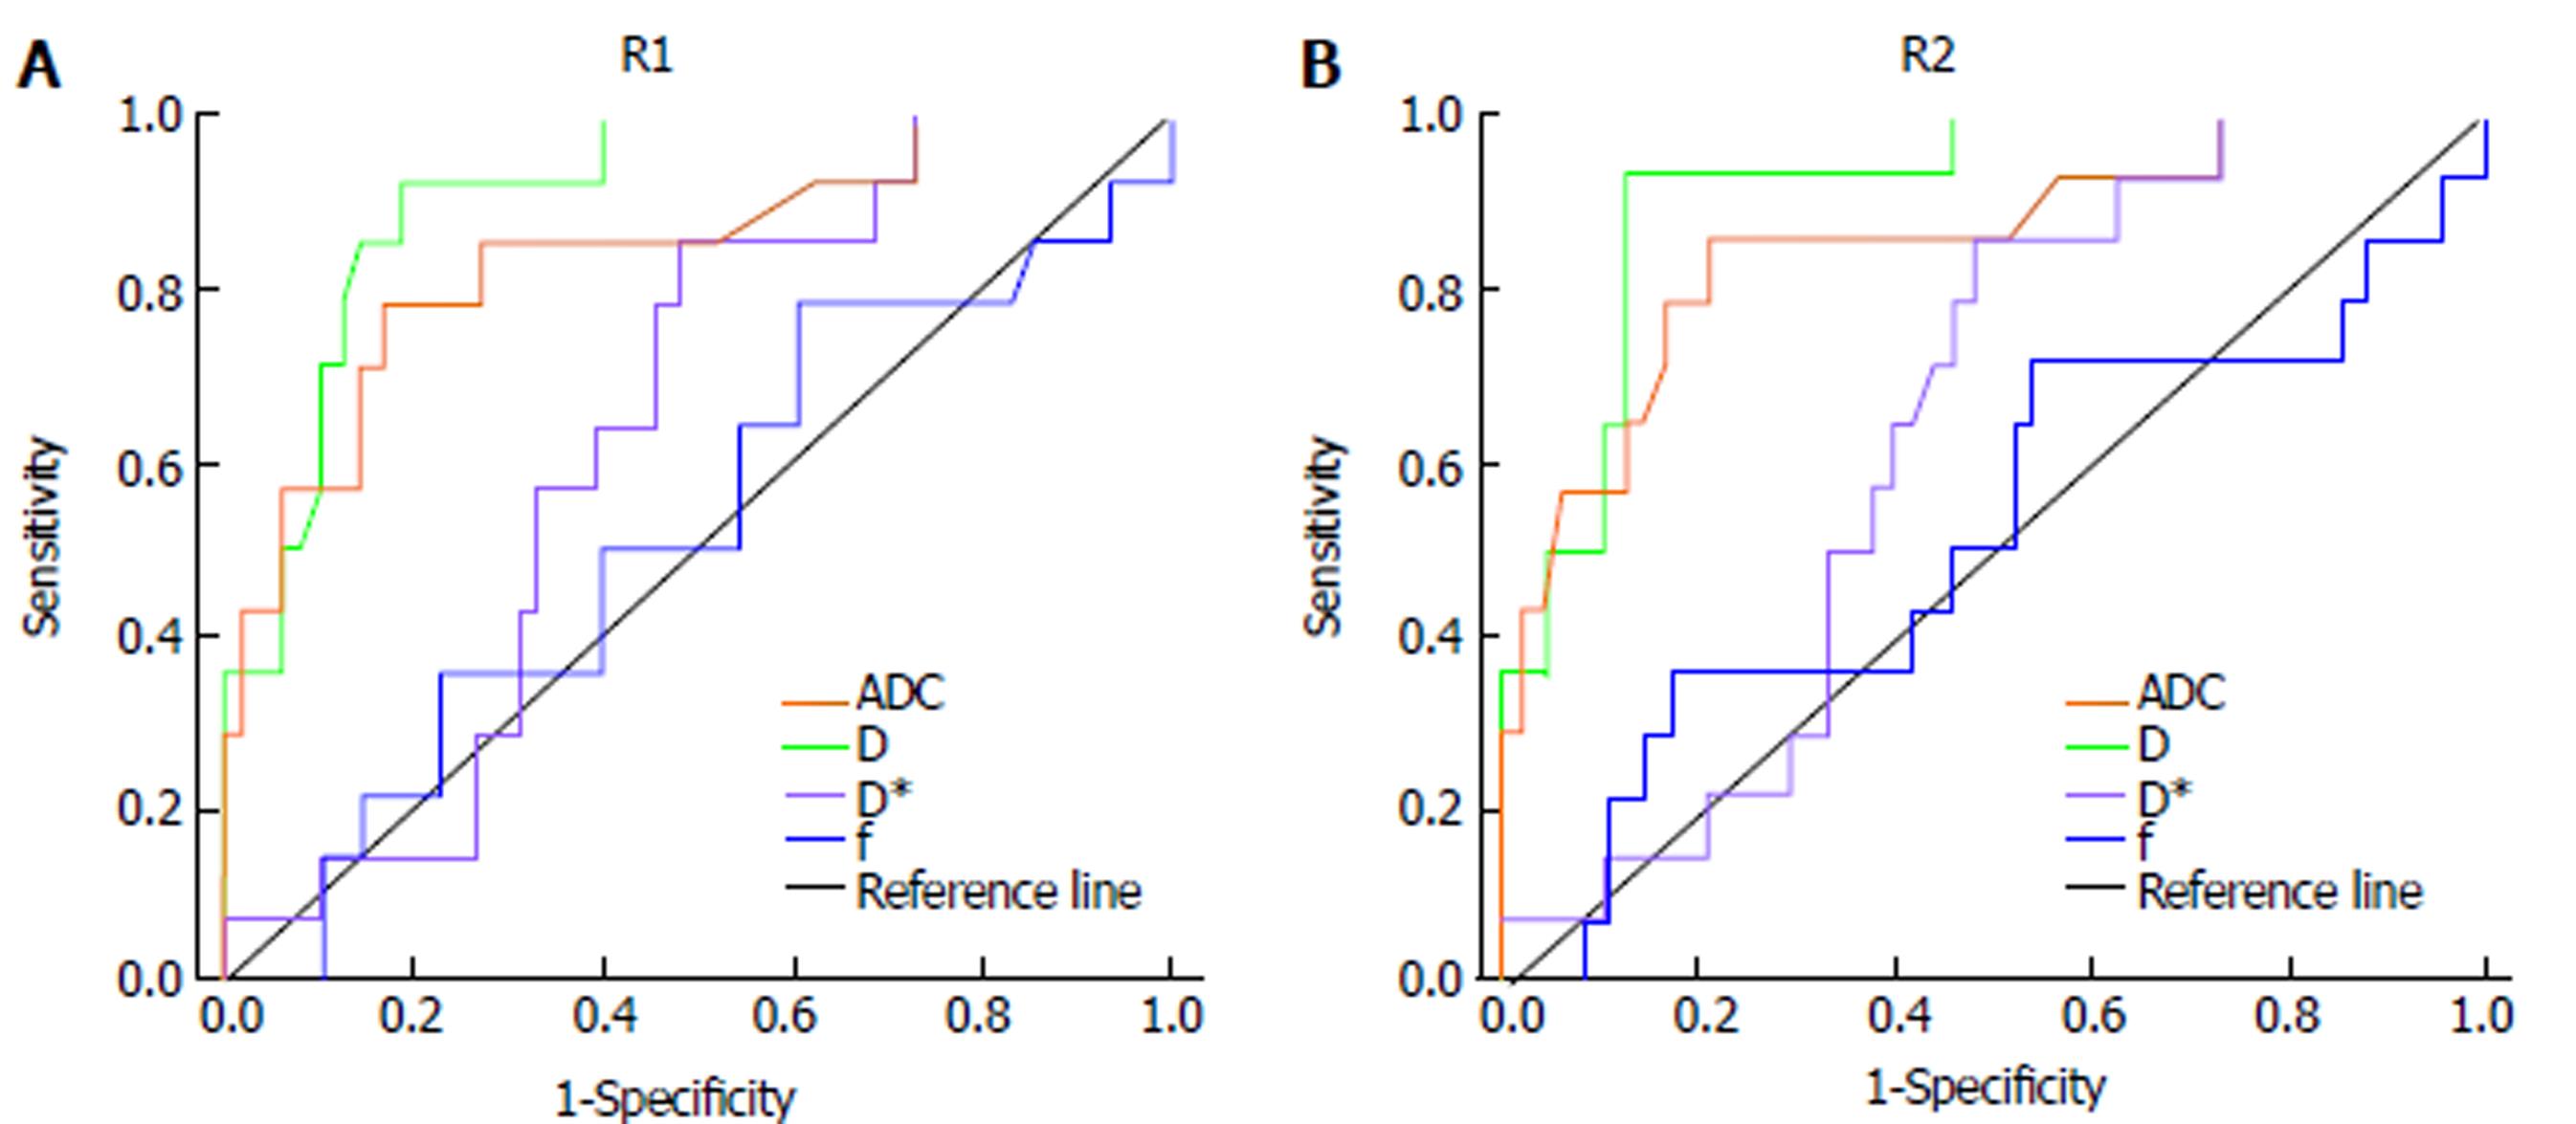
Figure 5 Graphs showing that receiver operating characteristic curves of the intravoxel incoherent motion- diffusion-weighted imaging and conventional diffusion-weighted imaging parameters of hepatocellular carcinoma for differentiating the low-grade group from the high-grade groups, as measured by the two radiologists.
A: ROC curves of the parameters of HCC by radiologist 1; B: ROC curves of the parameters of HCC by radiologist 2. The area under curve (AUC) for D was the largest of all the parameters obtained by the two radiologists. R1: Radiologist 1; R2: Radiologist 2; HCC: Hepatocellular carcinomas; IVIM: Intravoxel incoherent motion; DWI: Diffusion-weighted imaging, ADC: Apparent diffusion coefficient; D: Pure diffusion coefficient; D*: Pseudo-diffusion coefficient; f: Perfusion fraction.
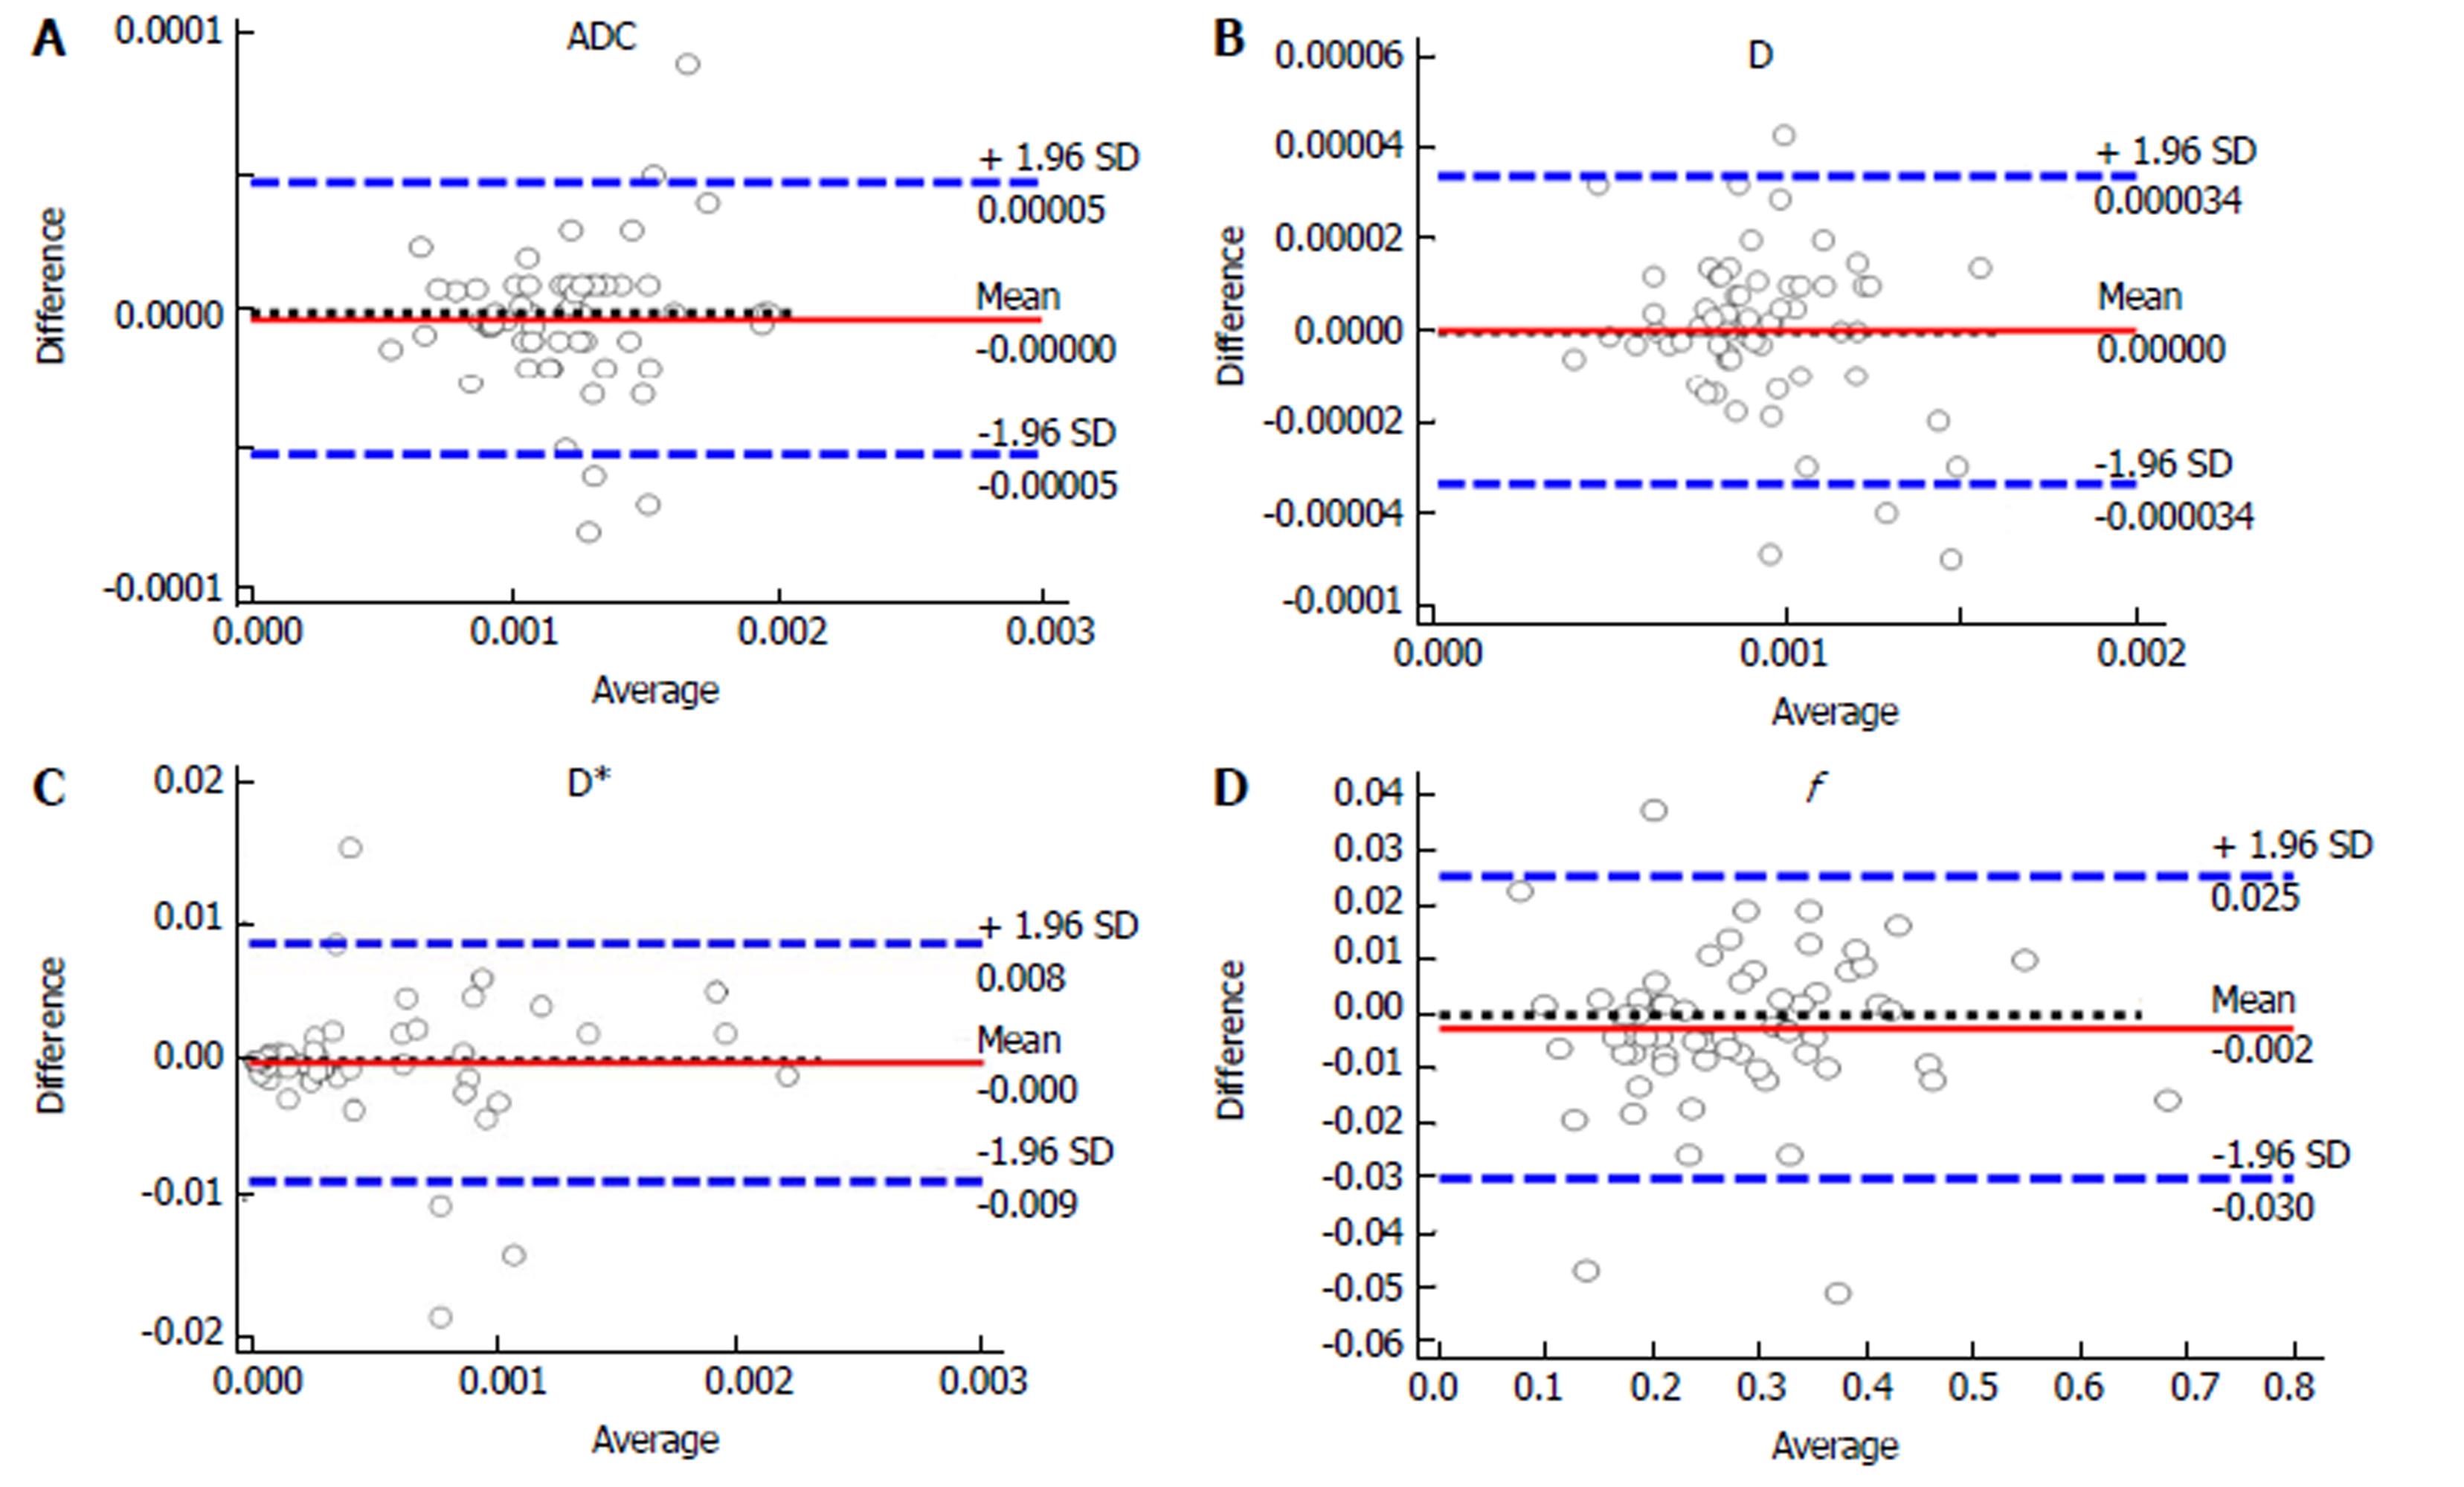
Figure 6 Bland-Altman plots showing the distribution of the differences of the intravoxel incoherent motion diffusion-weighted imaging and conventional diffusion-weighted imaging parameters between the two radiologists.
A-D: The distribution of the differences of the ADC, D, D*, and f values, respectively. The differences between measurements by the two radiologists regarding the parameters were relatively small. ±1.95 SD indicates 95% limits of agreement, mean, and mean difference, ADC: Apparent diffusion coefficient.
- Citation: Zhu SC, Liu YH, Wei Y, Li LL, Dou SW, Sun TY, Shi DP. Intravoxel incoherent motion diffusion-weighted magnetic resonance imaging for predicting histological grade of hepatocellular carcinoma: Comparison with conventional diffusion-weighted imaging. World J Gastroenterol 2018; 24(8): 929-940
- URL: https://www.wjgnet.com/1007-9327/full/v24/i8/929.htm
- DOI: https://dx.doi.org/10.3748/wjg.v24.i8.929


