Copyright
©The Author(s) 2018.
World J Gastroenterol. Feb 21, 2018; 24(7): 794-809
Published online Feb 21, 2018. doi: 10.3748/wjg.v24.i7.794
Published online Feb 21, 2018. doi: 10.3748/wjg.v24.i7.794
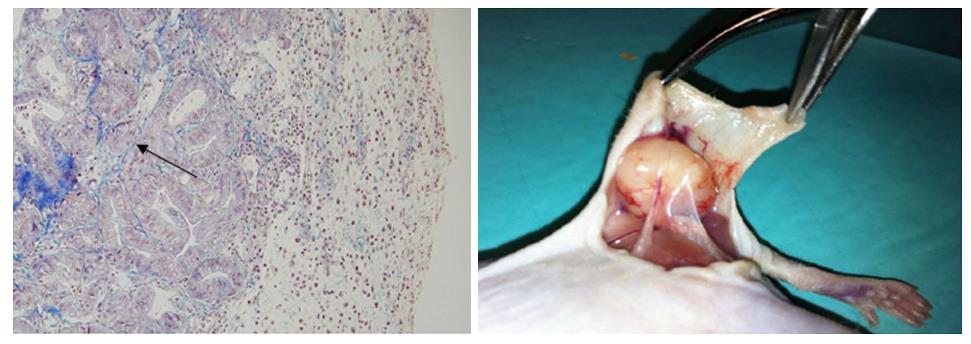
Figure 1 Masson’s trichrome staining of a F2 subcutaneous model (magnification × 500).
Black arrow shows the decreased fibrosis between the tumour glands.
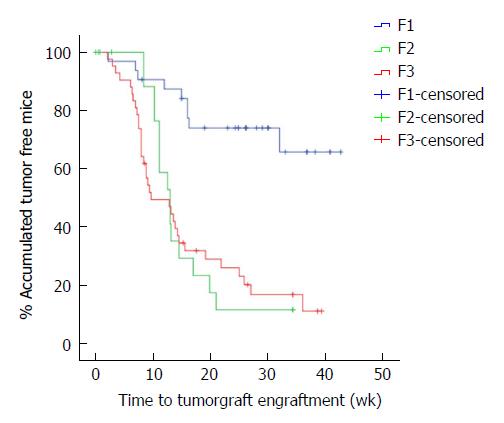
Figure 2 Time until tumour engraftment for successive re-implants.
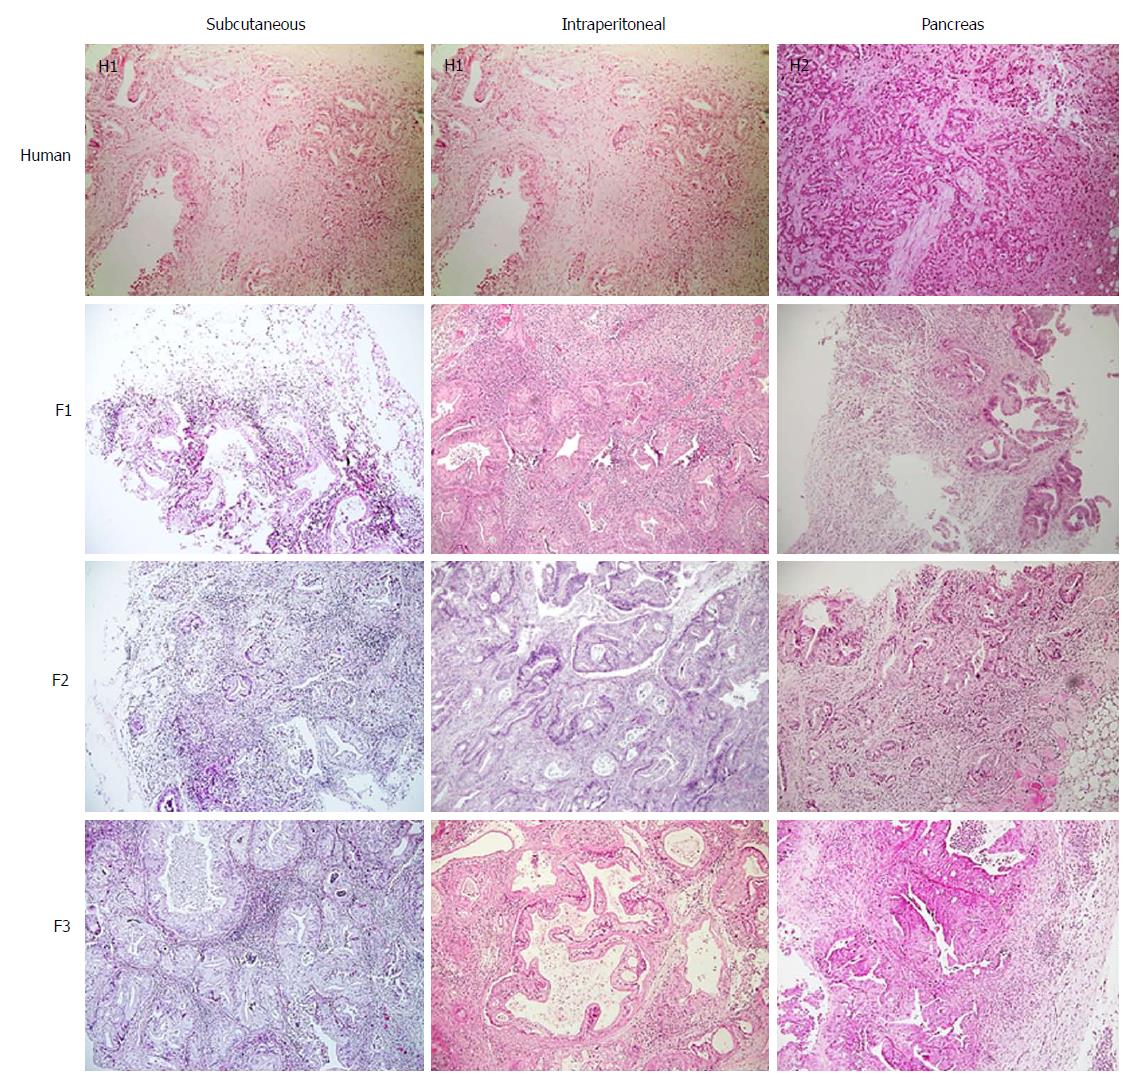
Figure 3 Haematoxylin-eosin staining through successive generations and PDX models.
Tumour differentiation was maintained with successive re-implants and in the three PDX models (magnification × 500). H1: Sample from Human 1; H2: Sample from Human 2.
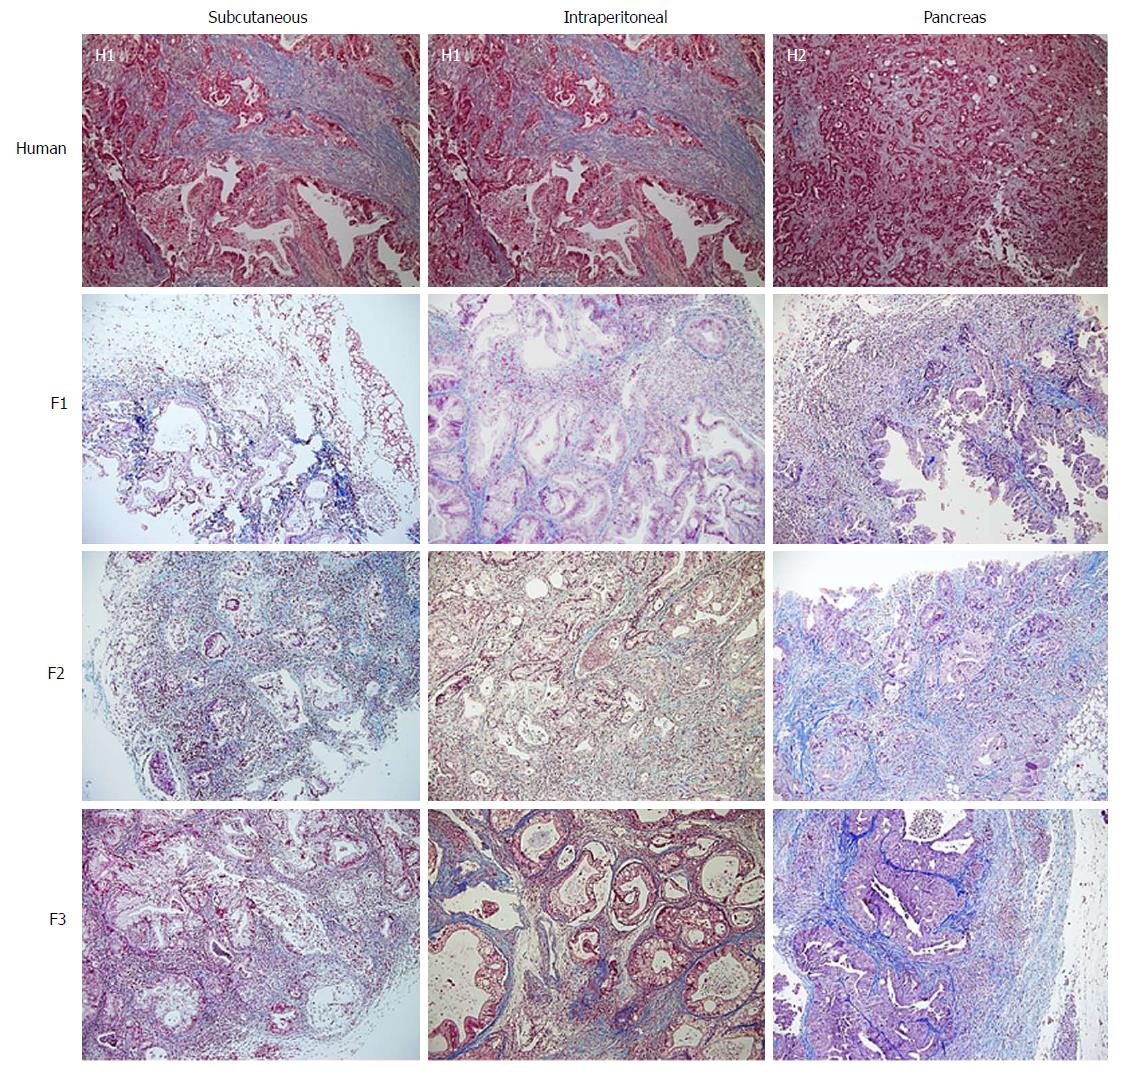
Figure 4 Masson’s trichrome staining through successive generations and PDX models.
The human samples showed higher fibrosis than the mice samples. Tumour stromal tissue was maintained in the three PDX models (magnification × 500). H1: Sample from Human 1; H2: Sample from Human 2.
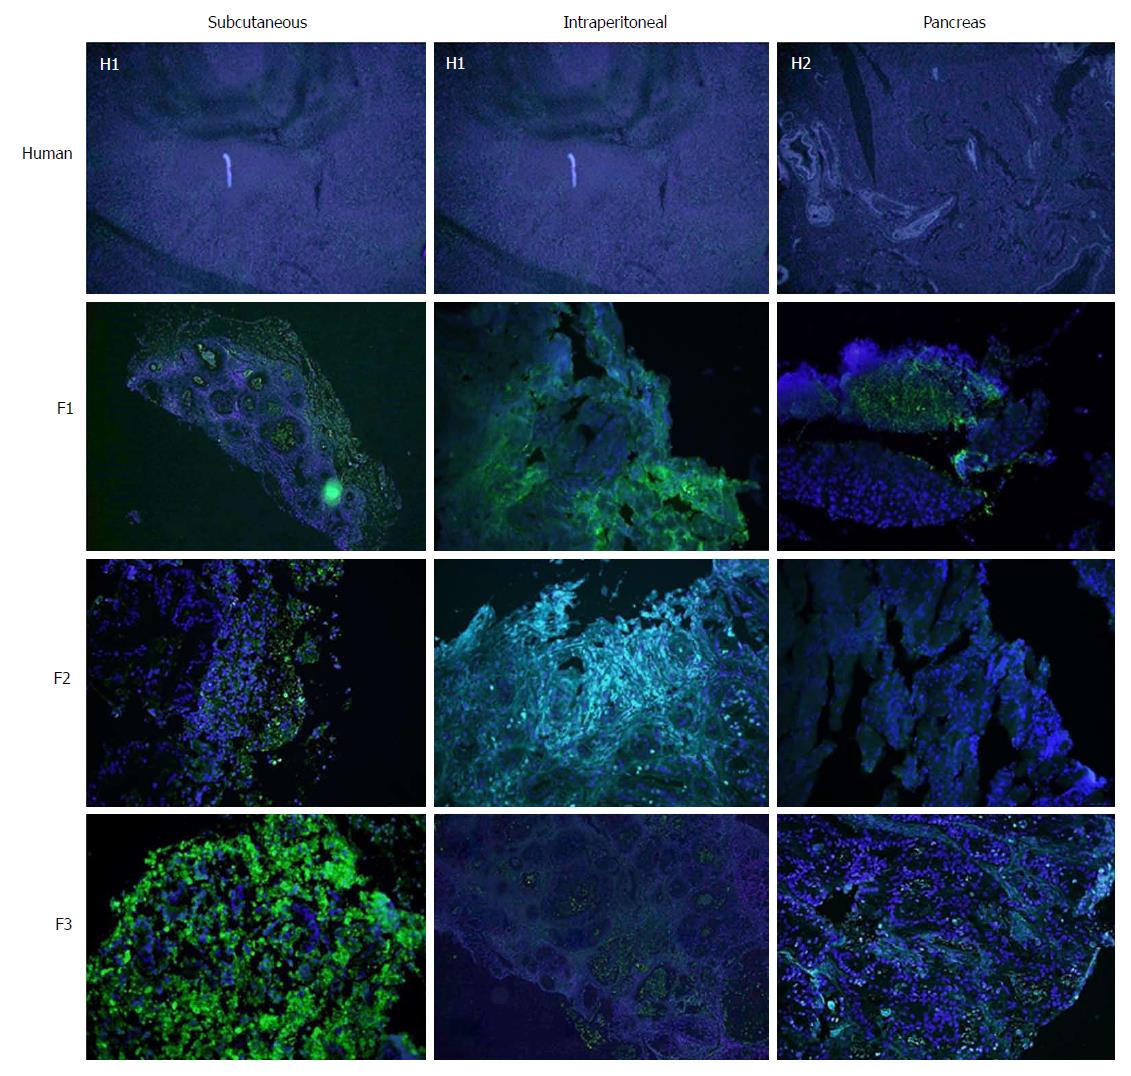
Figure 5 Immunohistochemical staining of Ki67 through successive generations and PDX models.
Green fluorescence identifies Ki67-positive cells related to proliferation. Blue fluorescence identifies cell nuclei. The Ki67 expression was maintained with successive re-implants and in the three PDX models (magnification × 500). H1: Sample from Human 1; H2: Sample from Human 2.
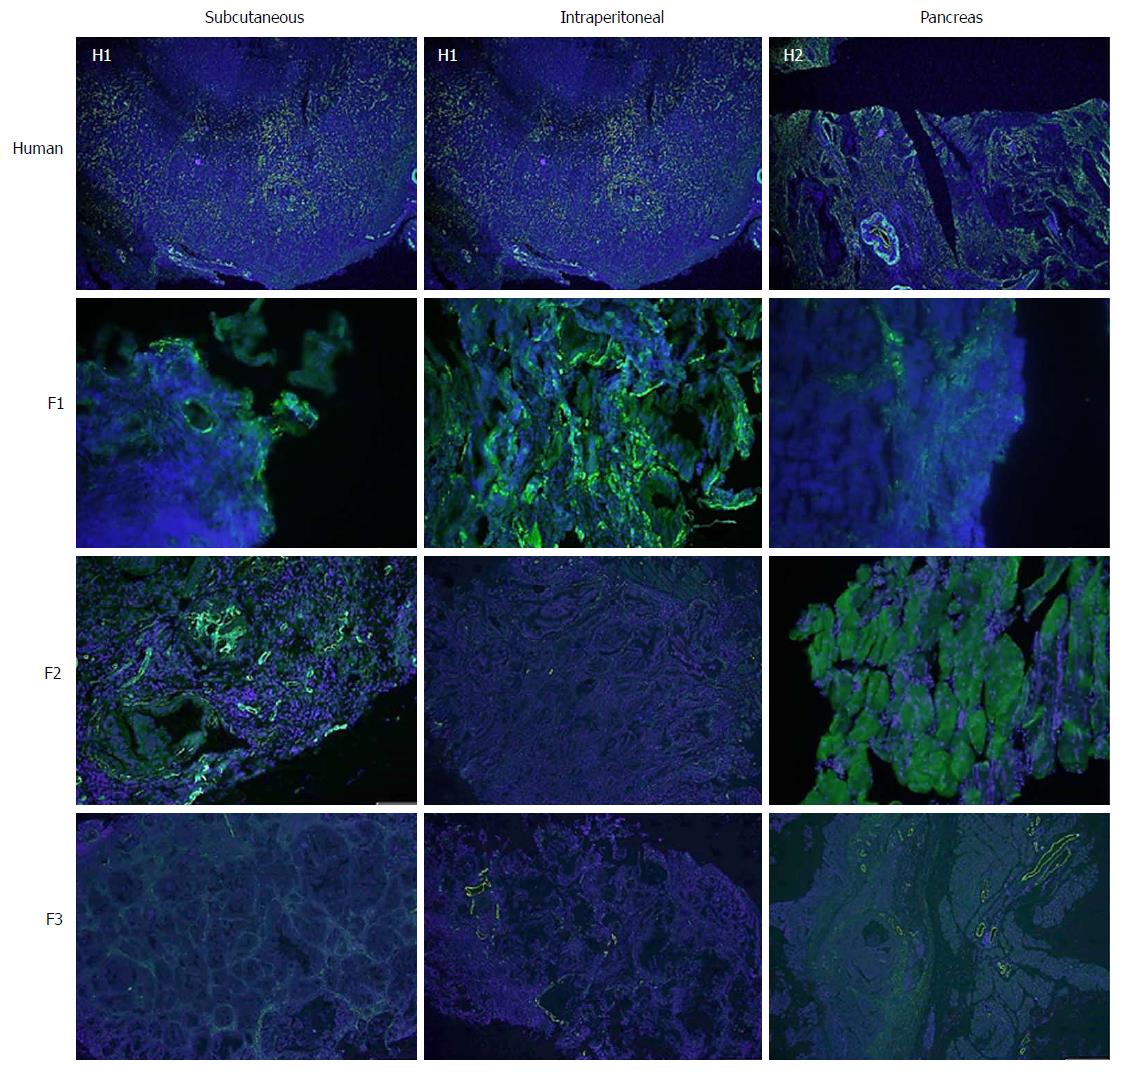
Figure 6 Immunohistochemical staining of alpha-SMA through successive generations.
Green fluorescence identifies alpha-SMA -positive cells related to fibrogenesis. Blue fluorescence identifies cell nuclei. The alpha-SMA expression was visibly reduced with successive re-implants in all three models, which was more remarkable in the pancreatic model (magnification × 500).
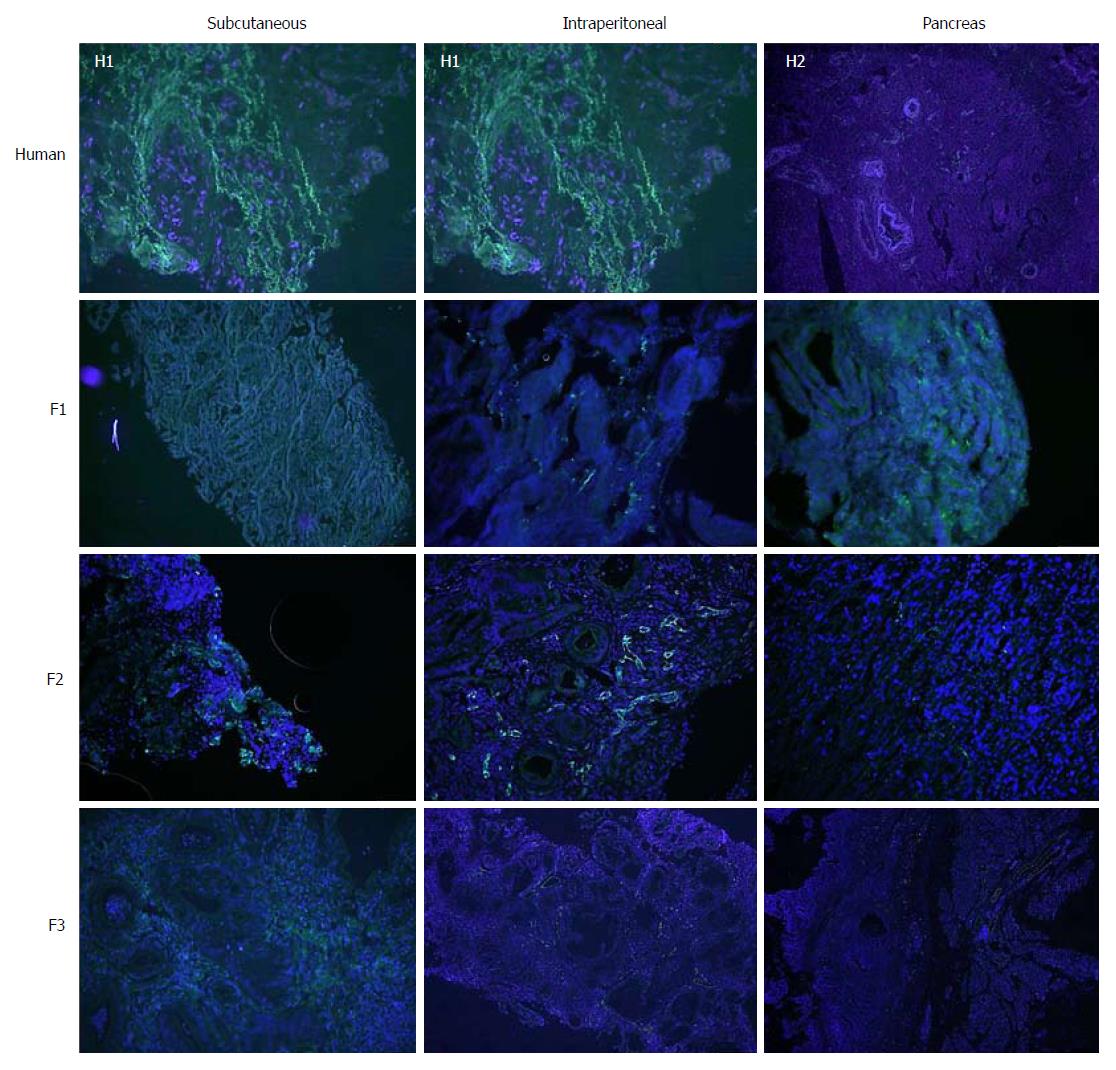
Figure 7 Immunohistochemical staining of CD31 through successive generations.
Green fluorescence identifies CD31-positive cells related to angiogenesis. Blue fluorescence identifies cell nuclei. The CD31 expression was visibly reduced with successive re-implants (magnification × 500). H1: Sample from Human 1; H2: Sample from Human 2.
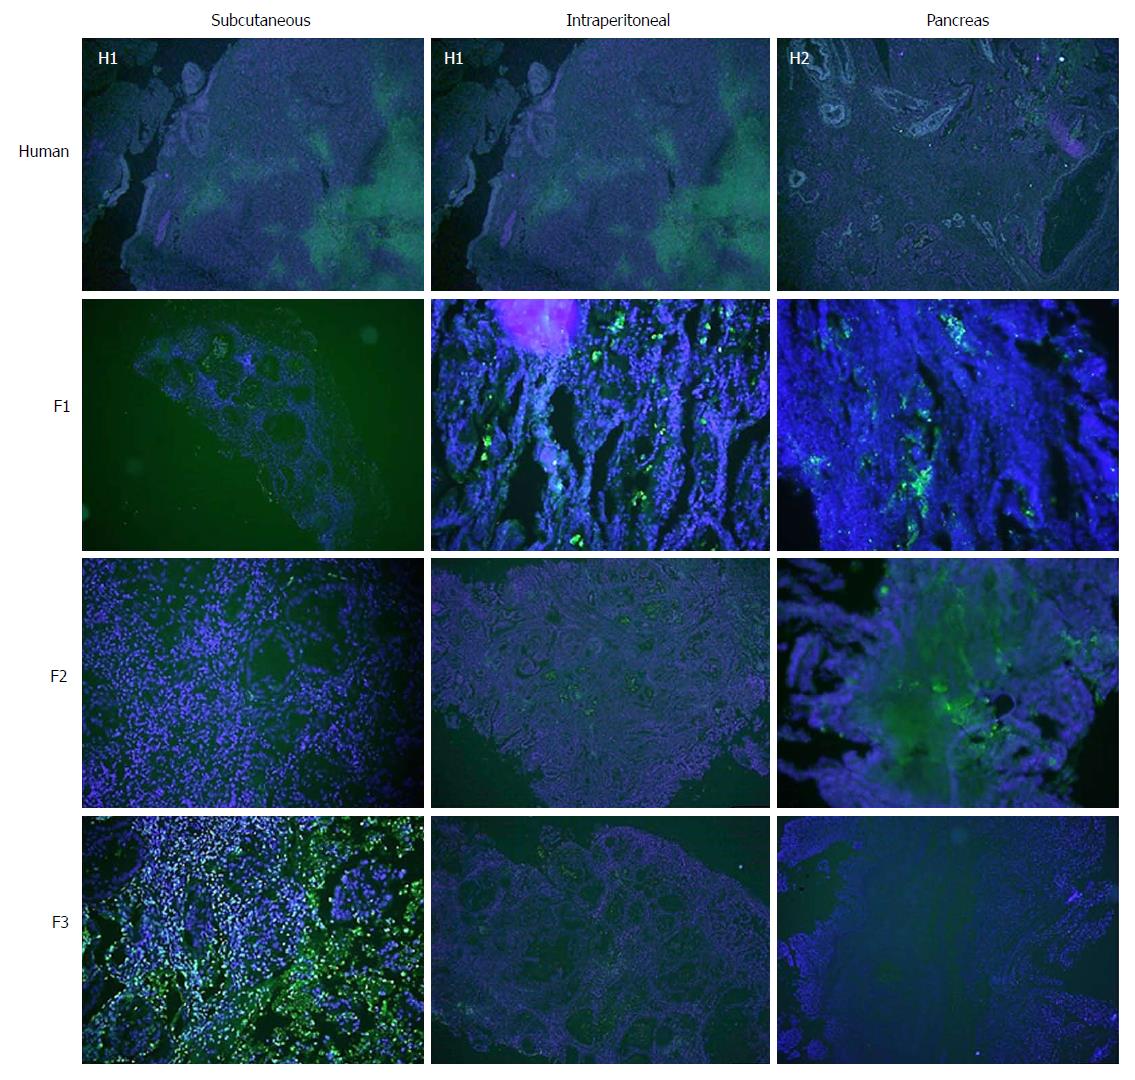
Figure 8 Immunohistochemical staining of TUNEL through successive generations.
Green fluorescence identifies TUNEL-positive cells related to apoptosis. Blue fluorescence identifies cell nuclei. TUNEL expression was reduced with subsequent re-implants for all three experimental models, which was more remarkable in the intraperitoneal and pancreatic model (magnification × 500).
- Citation: Rubio-Manzanares Dorado M, Marín Gómez LM, Aparicio Sánchez D, Pereira Arenas S, Praena-Fernández JM, Borrero Martín JJ, Farfán López F, Gómez Bravo MÁ, Muntané Relat J, Padillo Ruiz J. Translational pancreatic cancer research: A comparative study on patient-derived xenograft models. World J Gastroenterol 2018; 24(7): 794-809
- URL: https://www.wjgnet.com/1007-9327/full/v24/i7/794.htm
- DOI: https://dx.doi.org/10.3748/wjg.v24.i7.794


