Copyright
©The Author(s) 2018.
World J Gastroenterol. Feb 21, 2018; 24(7): 775-793
Published online Feb 21, 2018. doi: 10.3748/wjg.v24.i7.775
Published online Feb 21, 2018. doi: 10.3748/wjg.v24.i7.775
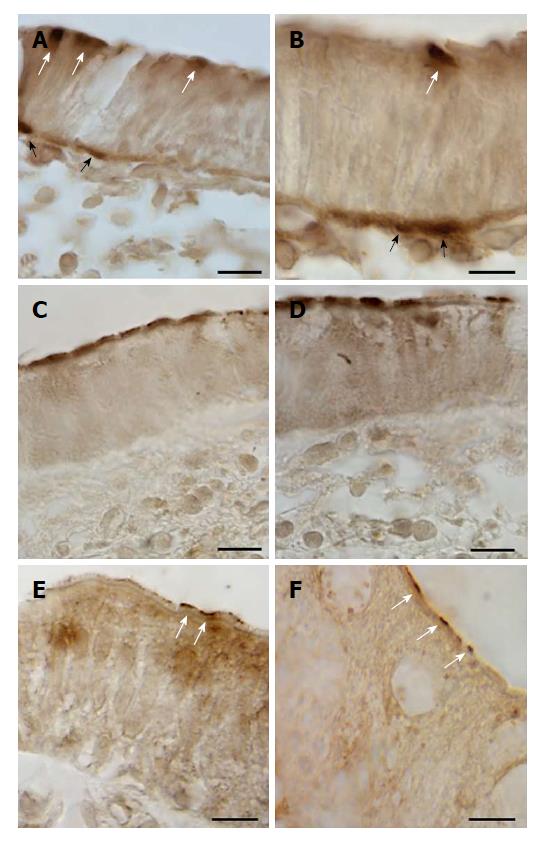
Figure 1 Immunoperoxidase staining showing GLUT2 (A-D) and SGLT1 (E and F) immunoreactivity in epithelial cells of the cecum (A and B), descending (C and D), and sigmoid (E and F) colon of human intestine.
White arrows indicate staining on the apical pole, black arrows on the basolateral membrane of epithelial intestinal cells. Scale bar: (A, C, D) 50 μm; (B, E, F) 5 μm.
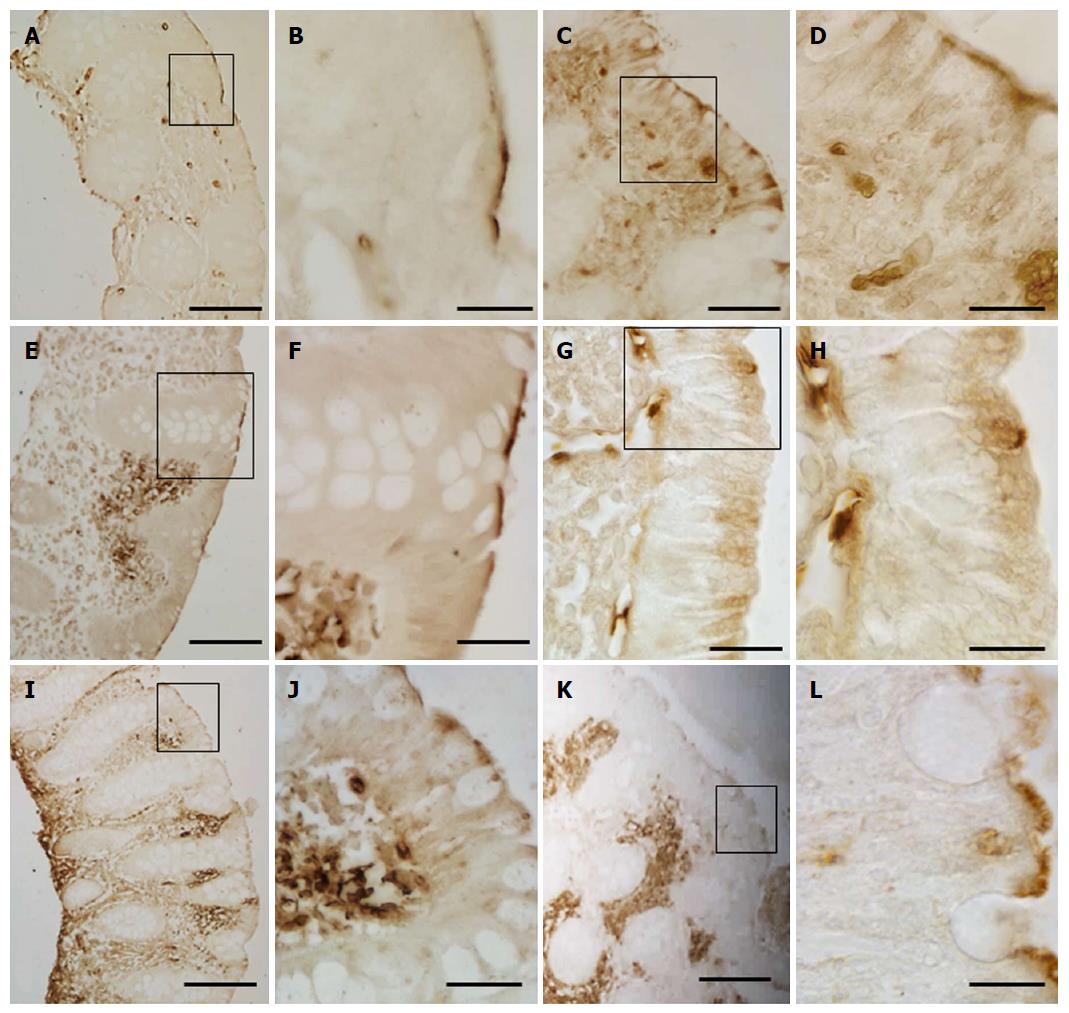
Figure 2 Immunoperoxidase staining showing GLUT5 immunoreactivity in the brush border membrane of epithelial cells in lumen of cecum (A and B), ascending (C and D), transverse (E and F), descending (G and H), sigmoid (I and J) colon, and rectum (K and L).
The boxed area in (A, C, E, G, I, K) is shown at higher magnification in (B, D, F, H, J, L, respectively). Scale bar: (A, E, G, I) 50 μm; (C, K) 25 μm; (D, F) 10 μm; (B, H, J, L) 5 μm.
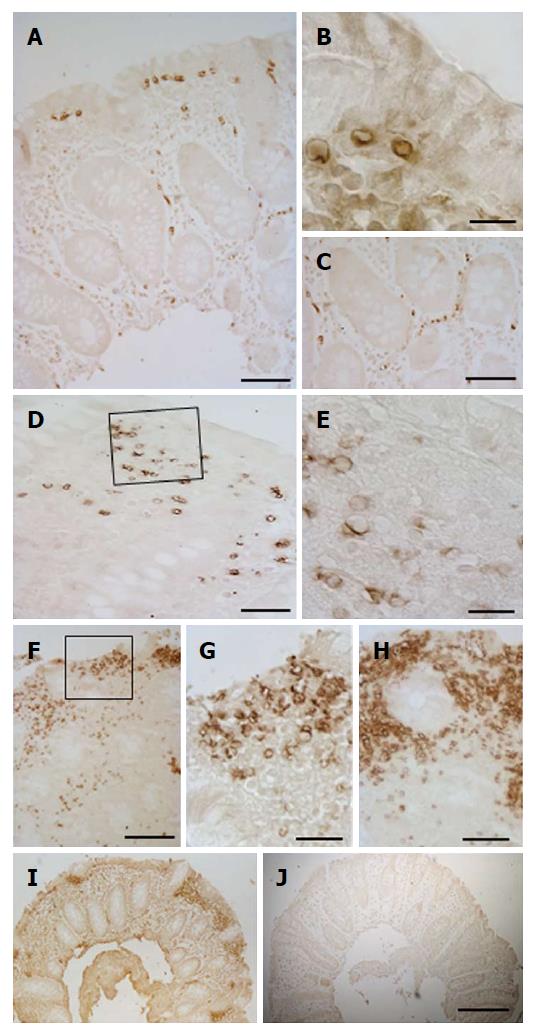
Figure 3 Immunoperoxidase staining showing GLUT5 immunoreactivity in small, rounded vessels in cecum (A and C), ascending (B and I), transverse (D and E), and sigmoid (F-H) colon of human intestine.
No specific staining is observed in adjacent sections (I and J) when GLUT5 antibody was omitted (J). The boxed area in (D and F) is shown at higher magnification in (E and G, respectively). Scale bar: (I and J) 125 μm; (A, C, D, F) 50 μm; (B, E, G, H) 10 μm.
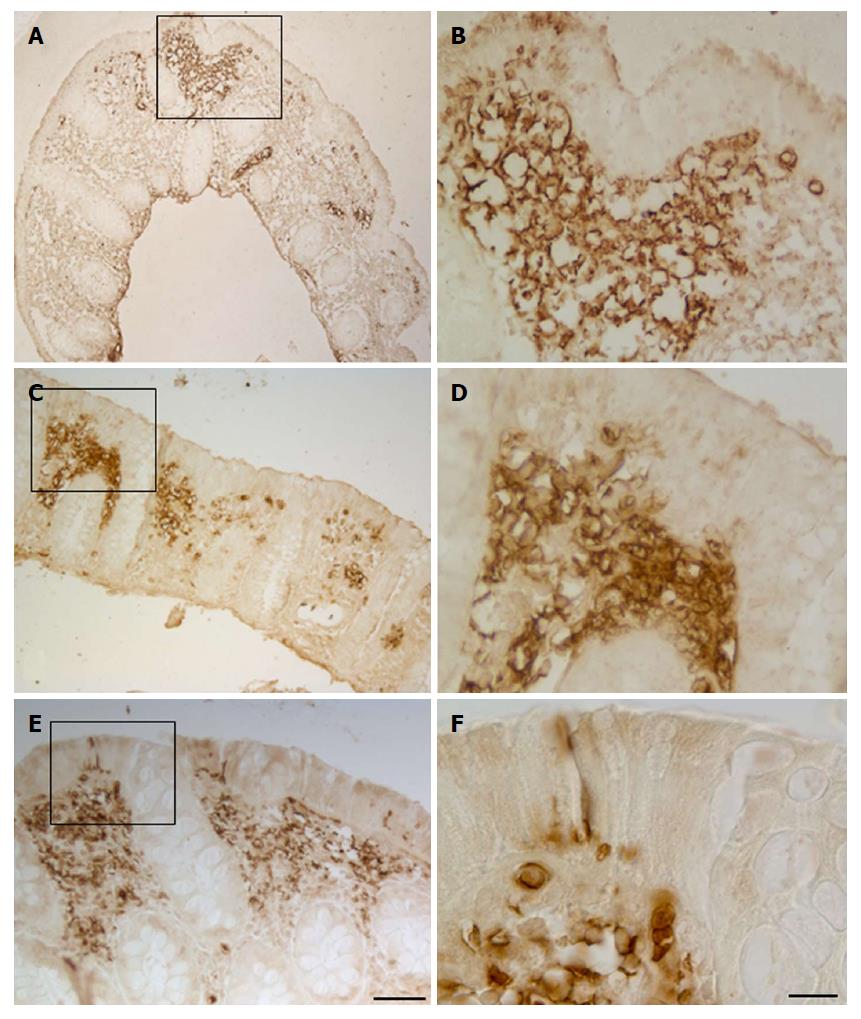
Figure 4 Immunoperoxidase staining showing GLUT5 immunoreactivity in vessel clusters in ascending (A and B), descending (C and D) colon, and rectum (E and F).
The boxed area in (A, C, E) is shown at higher magnification in (B and D, F respectively). Scale bar: (A, C, E) 125 μm; (B, D, F) 25 μm.
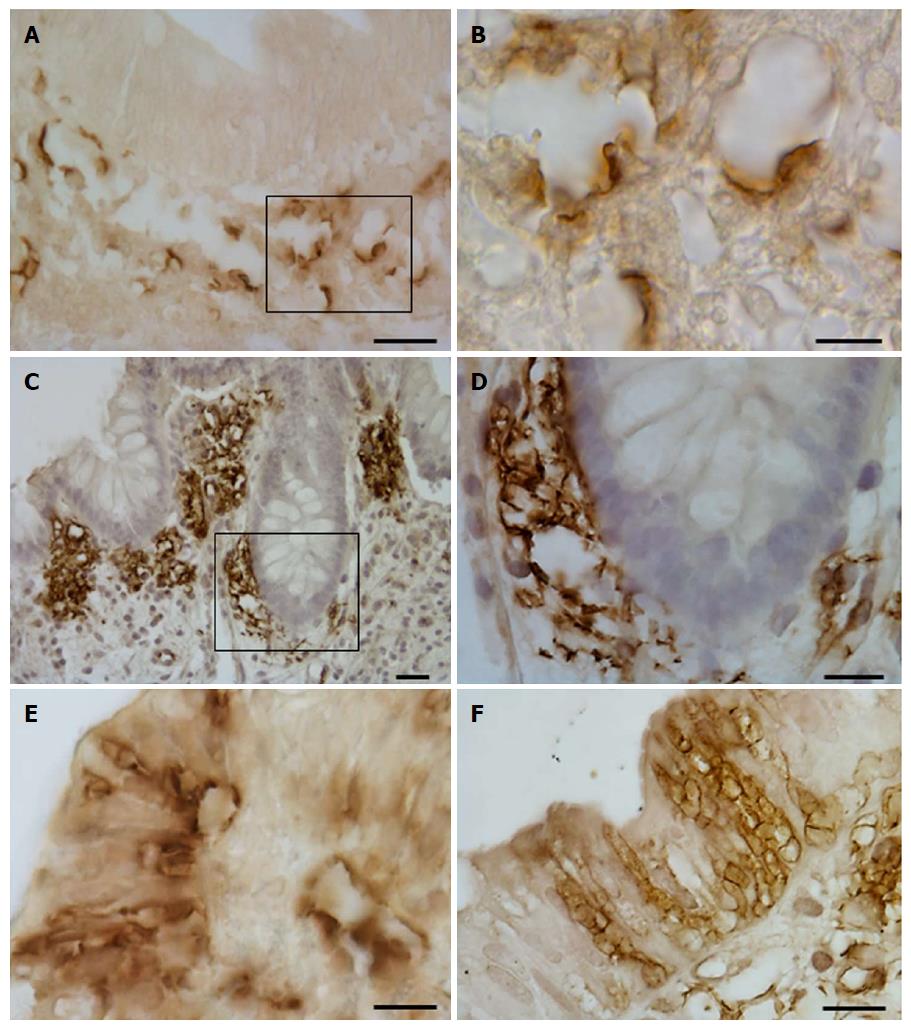
Figure 5 GLUT5 immunoreactivity is shown in vessel clusters localized beneath the epithelium (A and B) or around the glands (C and D), and in vacuolar structures in the epithelium (E and F).
The boxed area in (A and C) is shown at higher magnification in (B, D, respectively). Scale bar: (A, C, E and F) 25 μm; (D) 10 μm; (B) 5 μm.
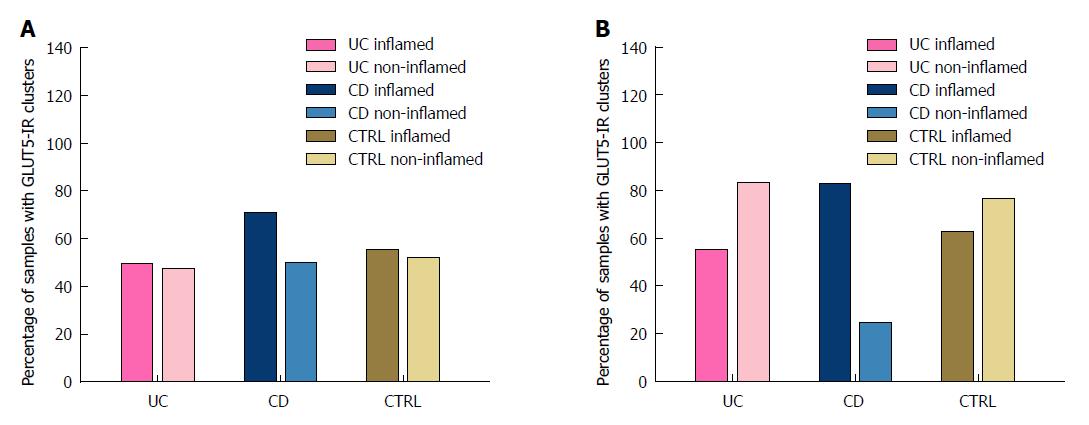
Figure 6 Bar graphs of the percentage of samples with GLUT5-immunoreactive clusters of lymphatic vessels in the proximal tract (Panel A) and distal tract (Panel B) of large intestine of patients with ulcerative colitis, Crohn’s disease, and controls.
Inflamed and non-inflamed mucosa can be distinguished for each patient group. In the UC and CTRL groups, the percentage is similar for inflamed and non-inflamed mucosa in the proximal tract, and higher for non-inflamed than inflamed mucosa in the distal tract. In the CD group, the percentage is higher for inflamed than non-inflamed mucosa in both the proximal and the distal tract. UC: Ulcerative colitis; CD: Crohn’s disease; CTRL: Controls.
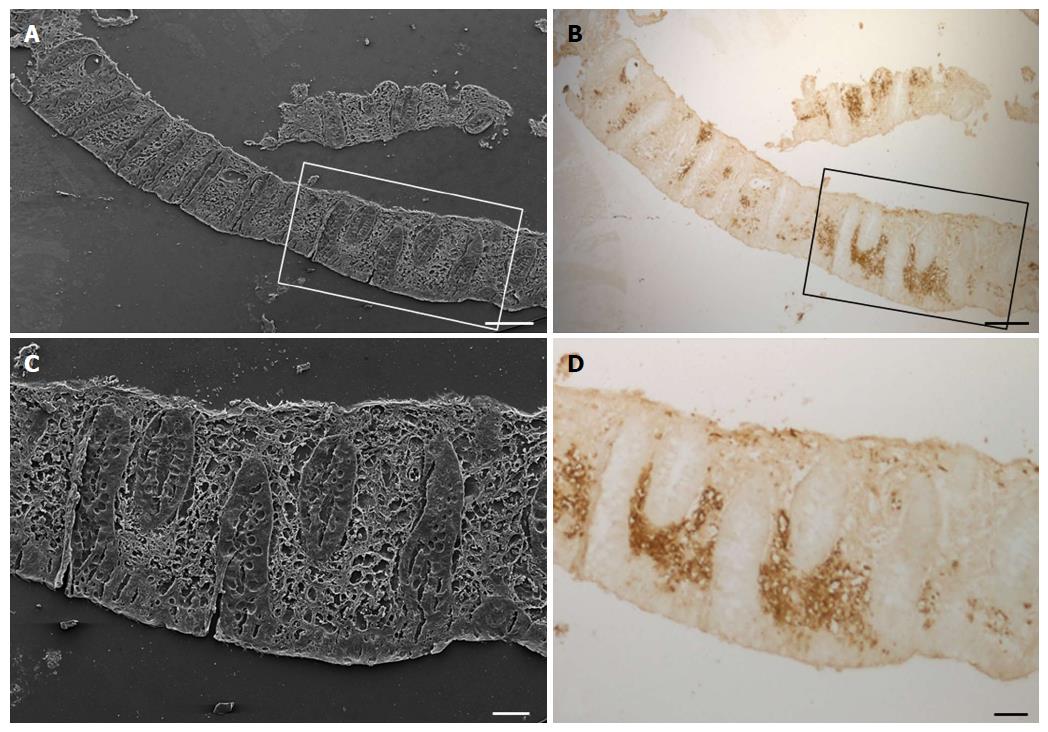
Figure 7 Scanning electron (A and C) and light (B and D) microscopy images of a sample of descending colon with non-inflamed mucosa after immunoperoxidase GLUT5 staining from a ulcerative colitis patient.
Scale bar: (A and B) 250 μm; (C and D) 100 μm.
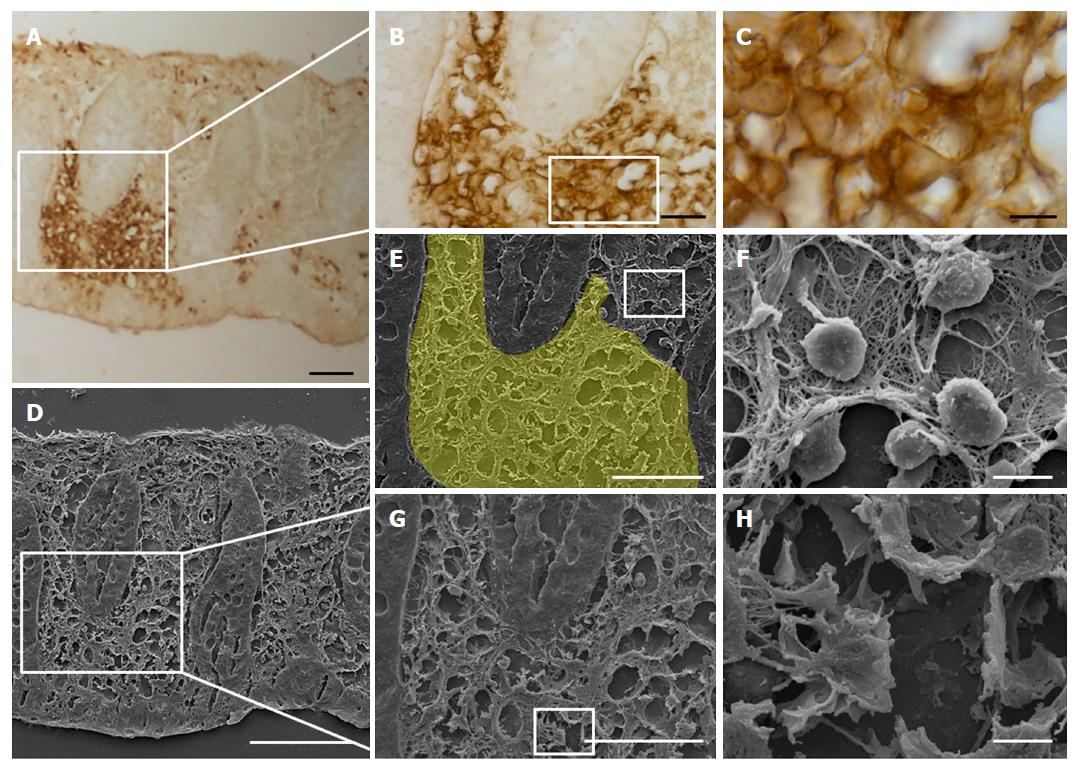
Figure 8 Light (A-C) and scanning electron (D-H) microscopy images of a sample of descending colon with non-inflamed mucosa after immunoperoxidase GLUT5 staining from a UC patient.
The boxed areas in (A) and (D) are corresponding areas and are shown enlarged in (B) and (G), respectively. The yellow area in (E) represents the immunostaining area shown in (B). The boxed area in (B, E, G) is shown at higher magnification in (C, F, H, respectively). Scale bar: (D) 100 μm ; (A, E, G) 50 μm; (B) 25 μm; (C, F, H) 5 μm.
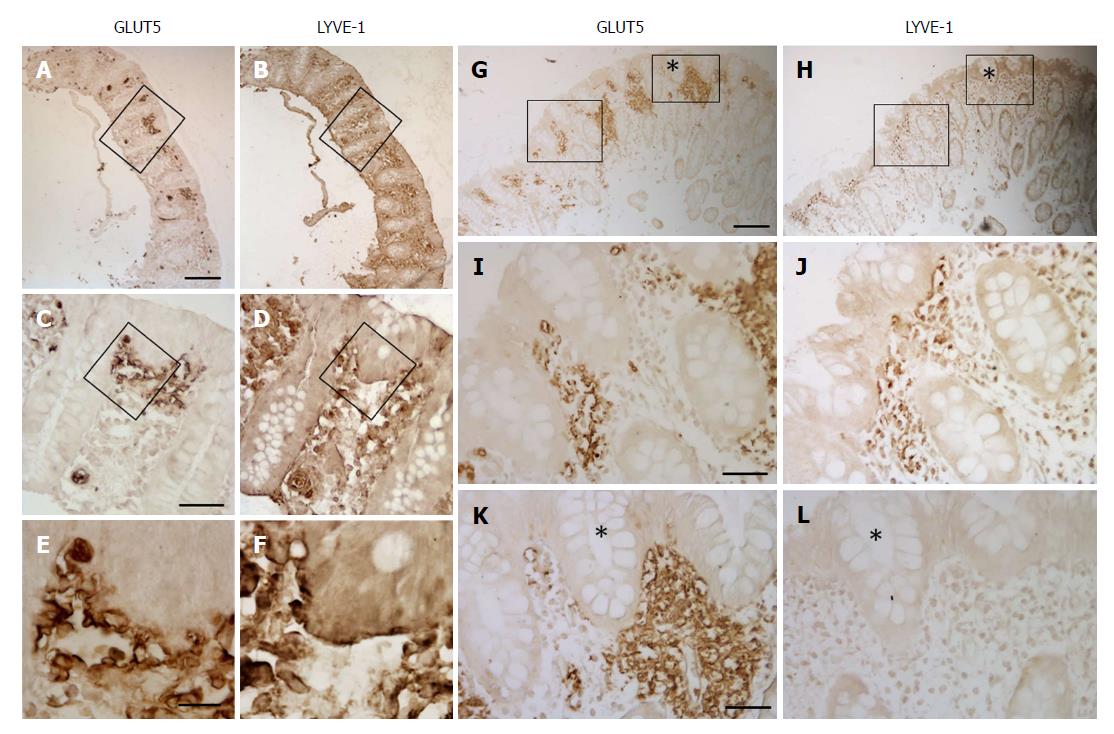
Figure 9 Immunoperoxidase staining showing GLUT5 and LYVE-1 immunoreactivity in samples of the distal tract of large intestine from UC (A-F) and CD (G-L) patients.
In both samples, the mucosa was non- inflamed. The boxed area in (A and B) is enlarged in (C and D, respectively), the area in (C and D) is enlarged in (E and F, respectively), the area without an asterisk in (G and H) is enlarged in (I and J, respectively), the area with an asterisk in (G and H) is enlarged in (K and L, respectively). Scale bar: (A, B, G, H) 100 μm; (C, D, I-L) 25 μm; (E and F) 10 μm.
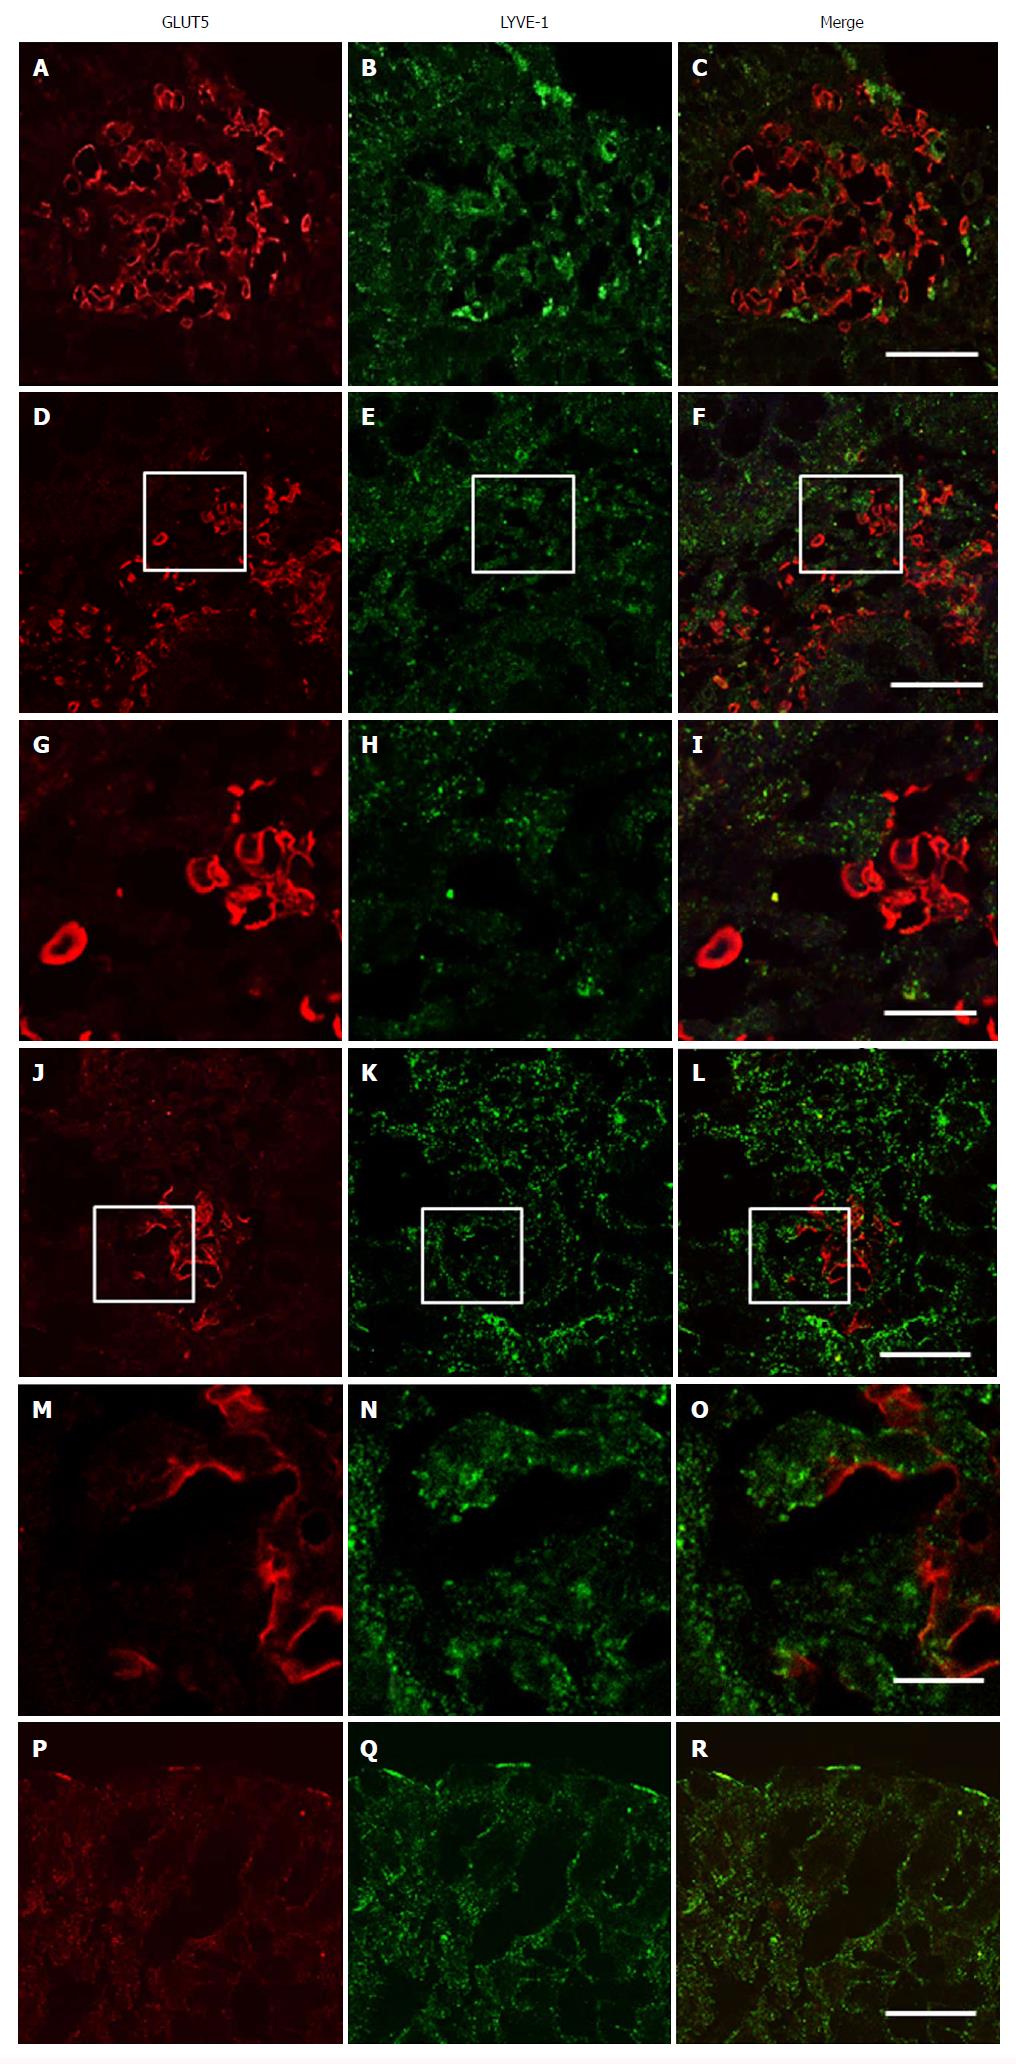
Figure 10 Double-immunofluorescent confocal microscopy showing expression of GLUT5 (red) with LYVE-1 (green) in samples of descending colon from UC (A-C, J-R) and CD (D-I) patients.
The mucosa was inflamed in the UC sample and non-inflamed in the CD sample. The boxed area in (D-F) is shown at higher magnification in (G-I, respectively); the boxed area in (J-L) is shown at higher magnification in (M-O, respectively). Scale bar: (C, F, L, R) 20 μm; (I, O) 10 μm.
- Citation: Merigo F, Brandolese A, Facchin S, Missaggia S, Bernardi P, Boschi F, D’Incà R, Savarino EV, Sbarbati A, Sturniolo GC. Glucose transporter expression in the human colon. World J Gastroenterol 2018; 24(7): 775-793
- URL: https://www.wjgnet.com/1007-9327/full/v24/i7/775.htm
- DOI: https://dx.doi.org/10.3748/wjg.v24.i7.775


