Copyright
©The Author(s) 2018.
World J Gastroenterol. Feb 7, 2018; 24(5): 623-630
Published online Feb 7, 2018. doi: 10.3748/wjg.v24.i5.623
Published online Feb 7, 2018. doi: 10.3748/wjg.v24.i5.623
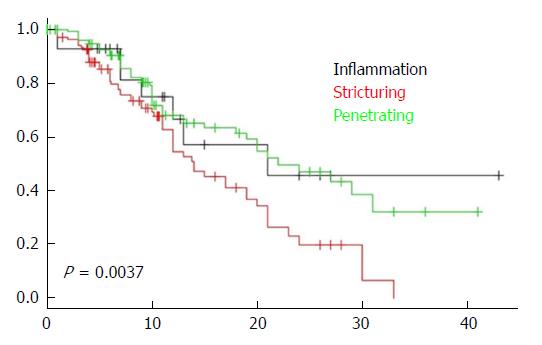
Figure 1 Comparison of survival Kaplan-Meier curves of patients according to disease behavior.
Log-rank test, P = 0.0037. CD: Crohn’s disease.
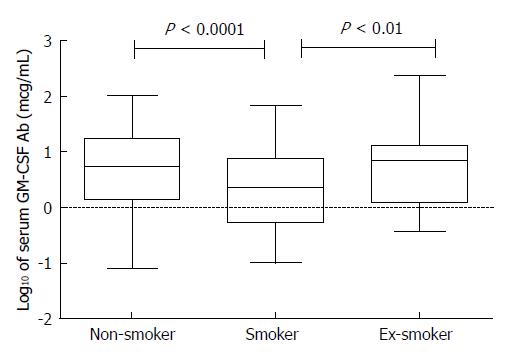
Figure 2 Serum granulocyte-macrophage colony-stimulating factor auto-antibodies levels in patients with Crohn’s disease stratified by smoking status.
The log10 transformation of serum GM-CSF Ab (in micrograms per milliliter) is shown. The middle line represents the median, and the lower edge and the upper edge of the box represent the 25% and 75% quartiles, respectively. The bottom and top lines represent the minimum and maximum values, respectively. There were 201 non-smokers, 180 smokers and 27 ex-smokers with CD. Kruskal-Wallis test with Dunn’s post-test revealed significant differences between non-smokers and smokers and between smokers and ex-smokers. GM-CSF Ab: Granulocyte-macrophage colony-stimulating factor auto-antibodies; CD: Crohn’s disease.
- Citation: Gathungu G, Zhang Y, Tian X, Bonkowski E, Rowehl L, Krumsiek J, Nix B, Chalk C, Trapnell B, Zhu W, Newberry R, Denson L, Li E. Impaired granulocyte-macrophage colony-stimulating factor bioactivity accelerates surgical recurrence in ileal Crohn’s disease. World J Gastroenterol 2018; 24(5): 623-630
- URL: https://www.wjgnet.com/1007-9327/full/v24/i5/623.htm
- DOI: https://dx.doi.org/10.3748/wjg.v24.i5.623


