Copyright
©The Author(s) 2018.
World J Gastroenterol. Dec 28, 2018; 24(48): 5505-5524
Published online Dec 28, 2018. doi: 10.3748/wjg.v24.i48.5505
Published online Dec 28, 2018. doi: 10.3748/wjg.v24.i48.5505
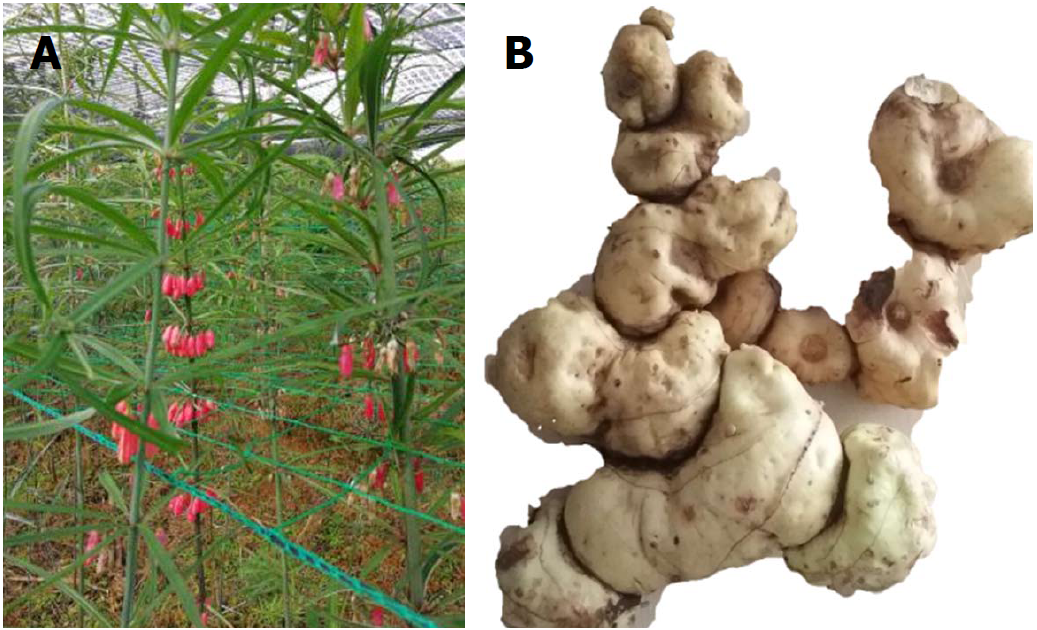
Figure 1 Polygonatum kingianum.
A: Whole plant photograph of Polygonatum kingianum (P. kingianum); B: Rhizome of P. kingianum, which represents the medicinal part of this plant used in this study.
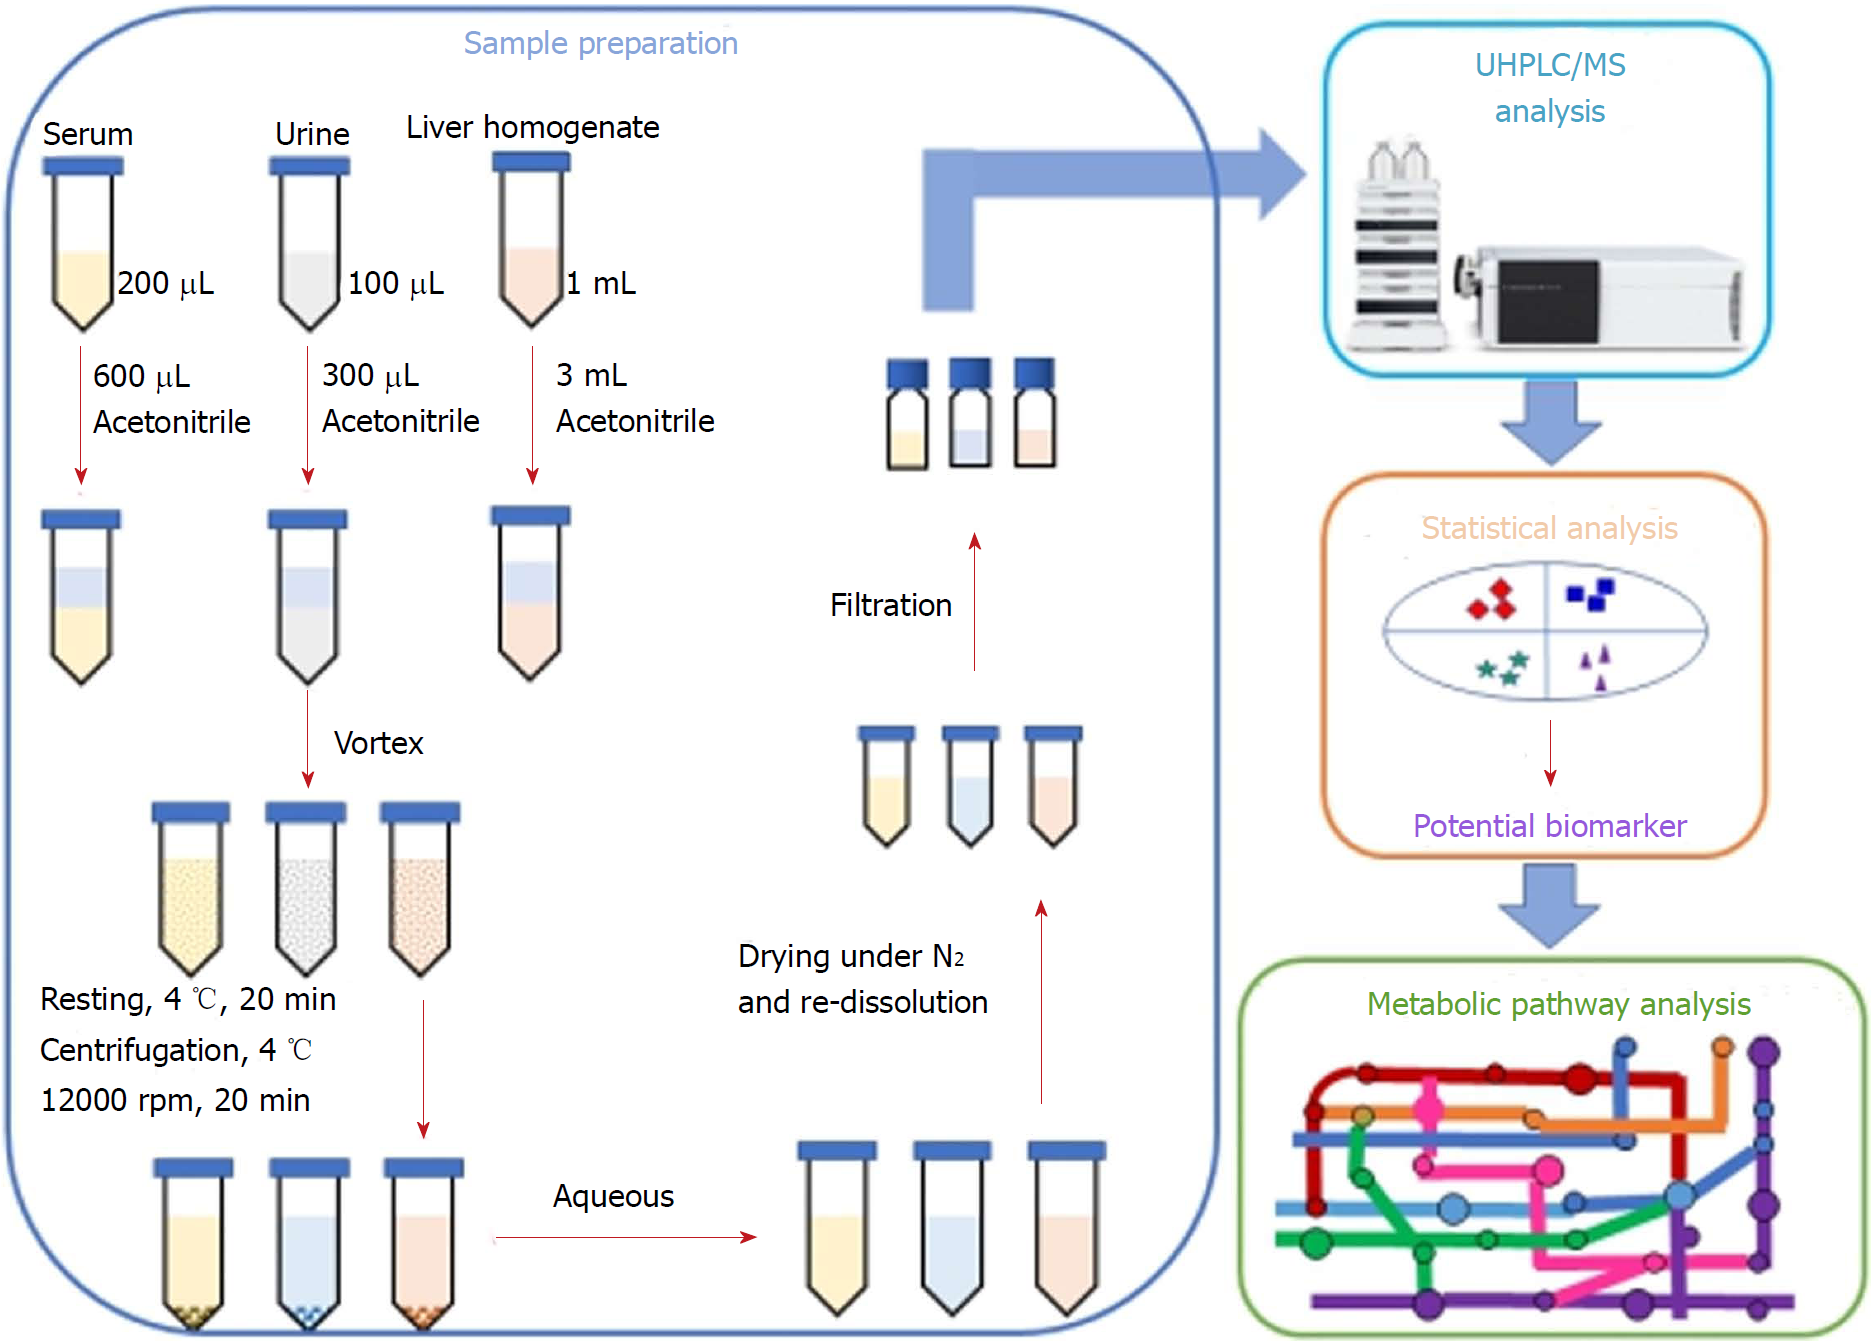
Figure 2 Workflow of the integrated untargeted metabolomic method based on ultra-high performance liquid chromatography/mass spectrometry analysis of serum, urine and liver samples.
UHPLC/MS: Ultra-high performance liquid chromatography/mass spectrometry.
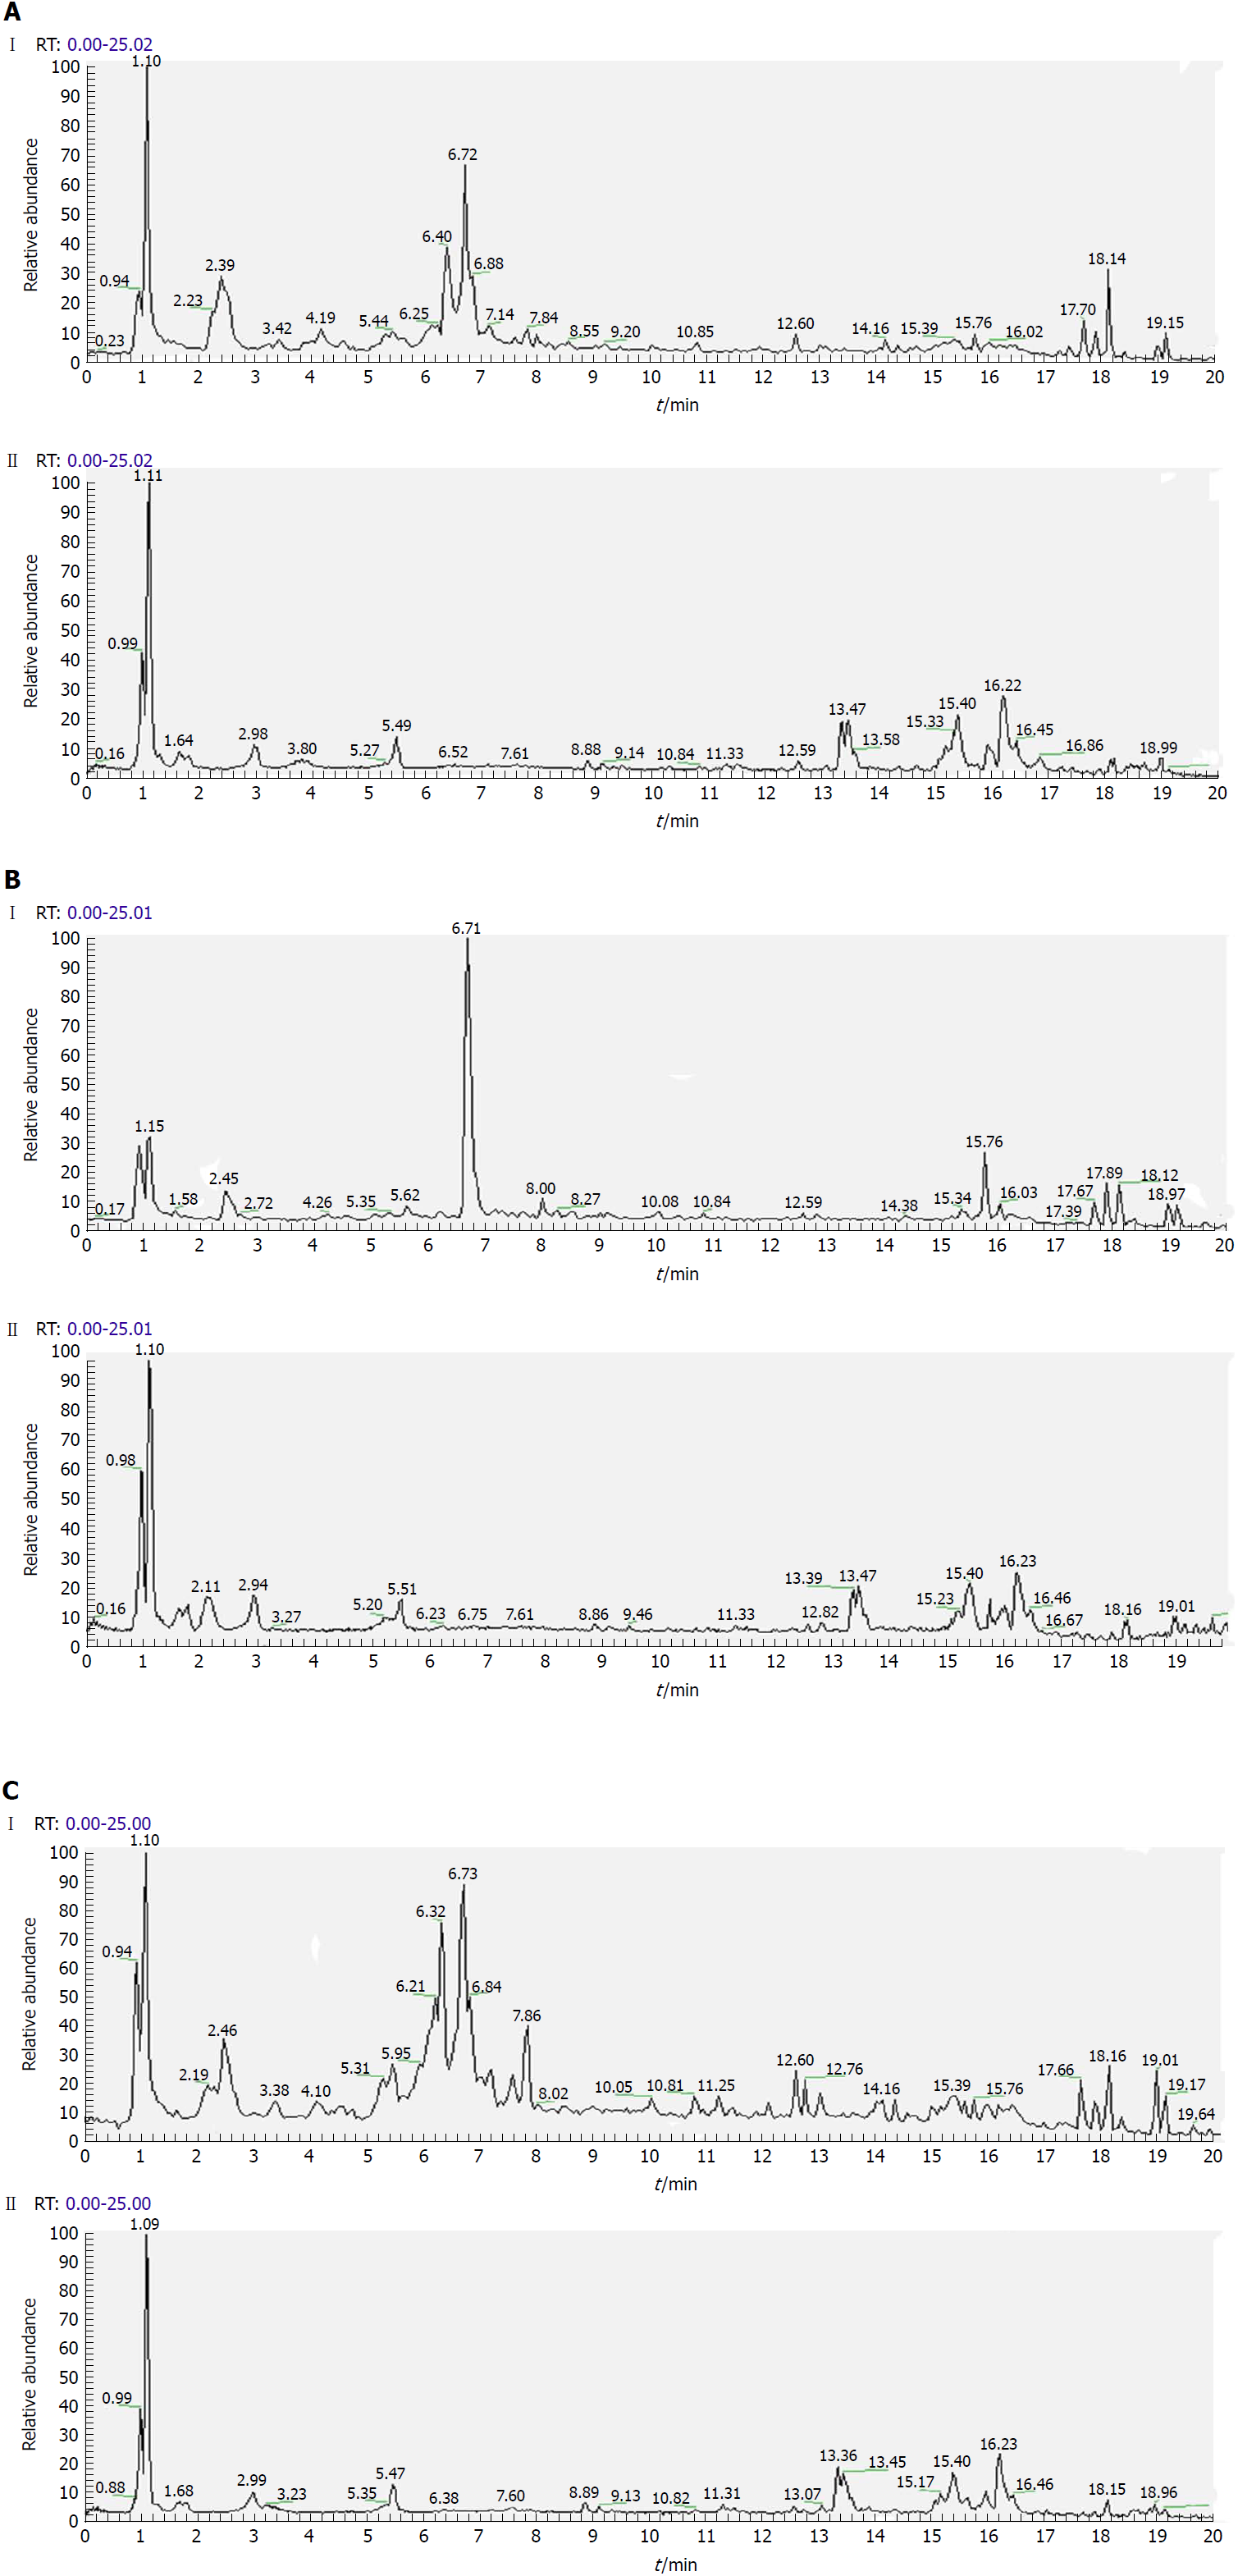
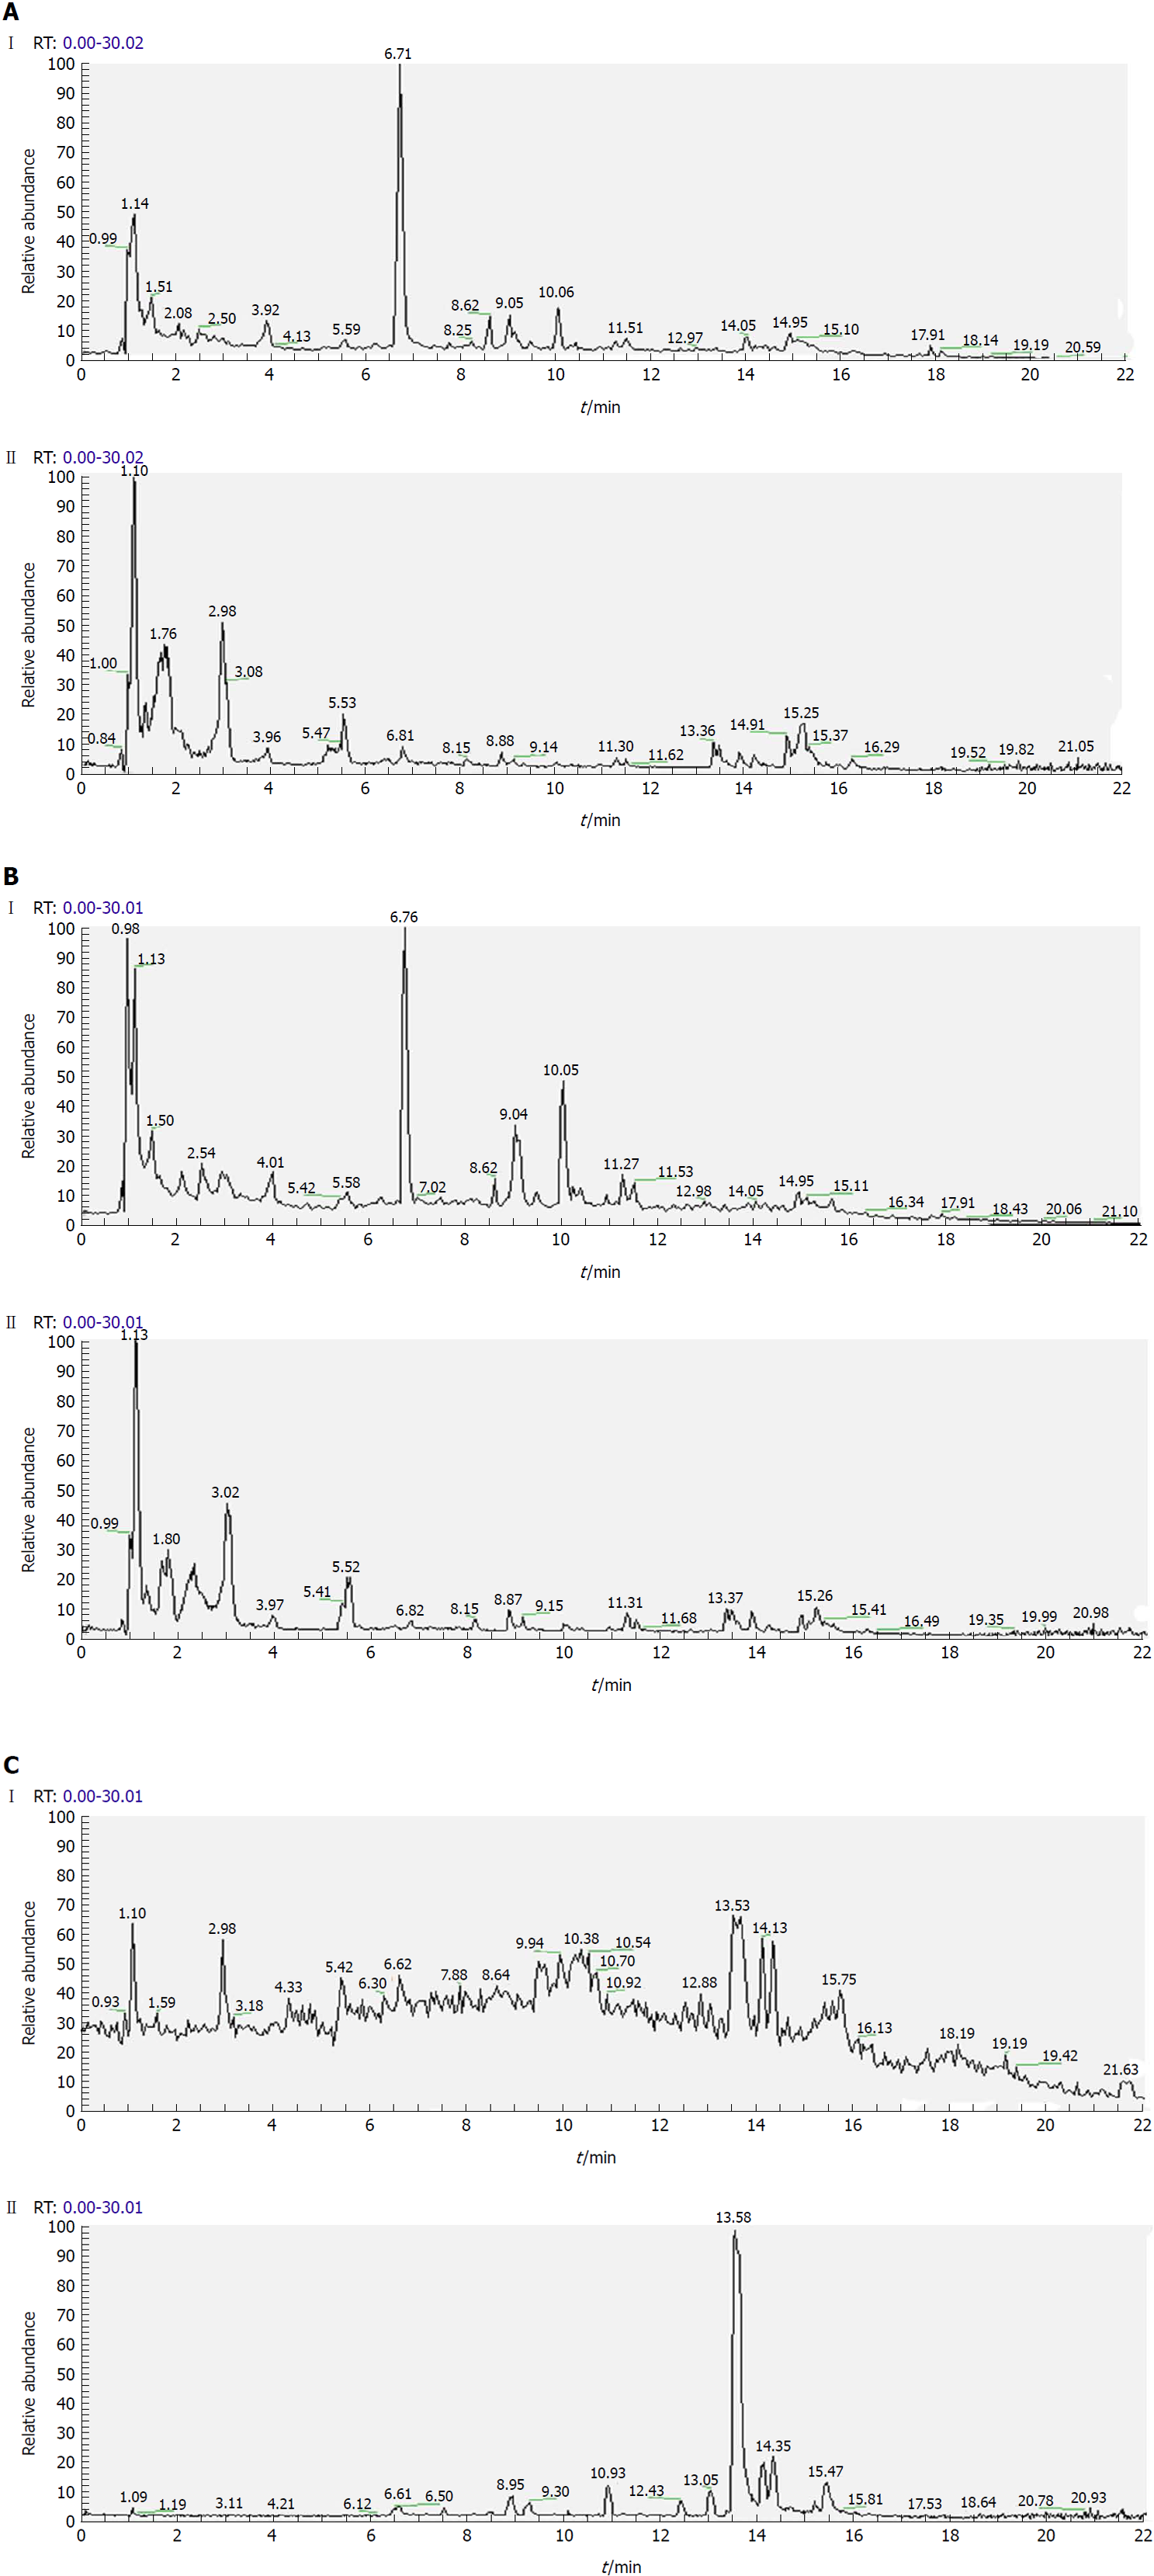
Figure 3 Representative total ion current profiles of serum samples in the negative (I) and positive (II) ion modes.
A: Control group; B: Model group; and C: Polygonatum kingianum group.
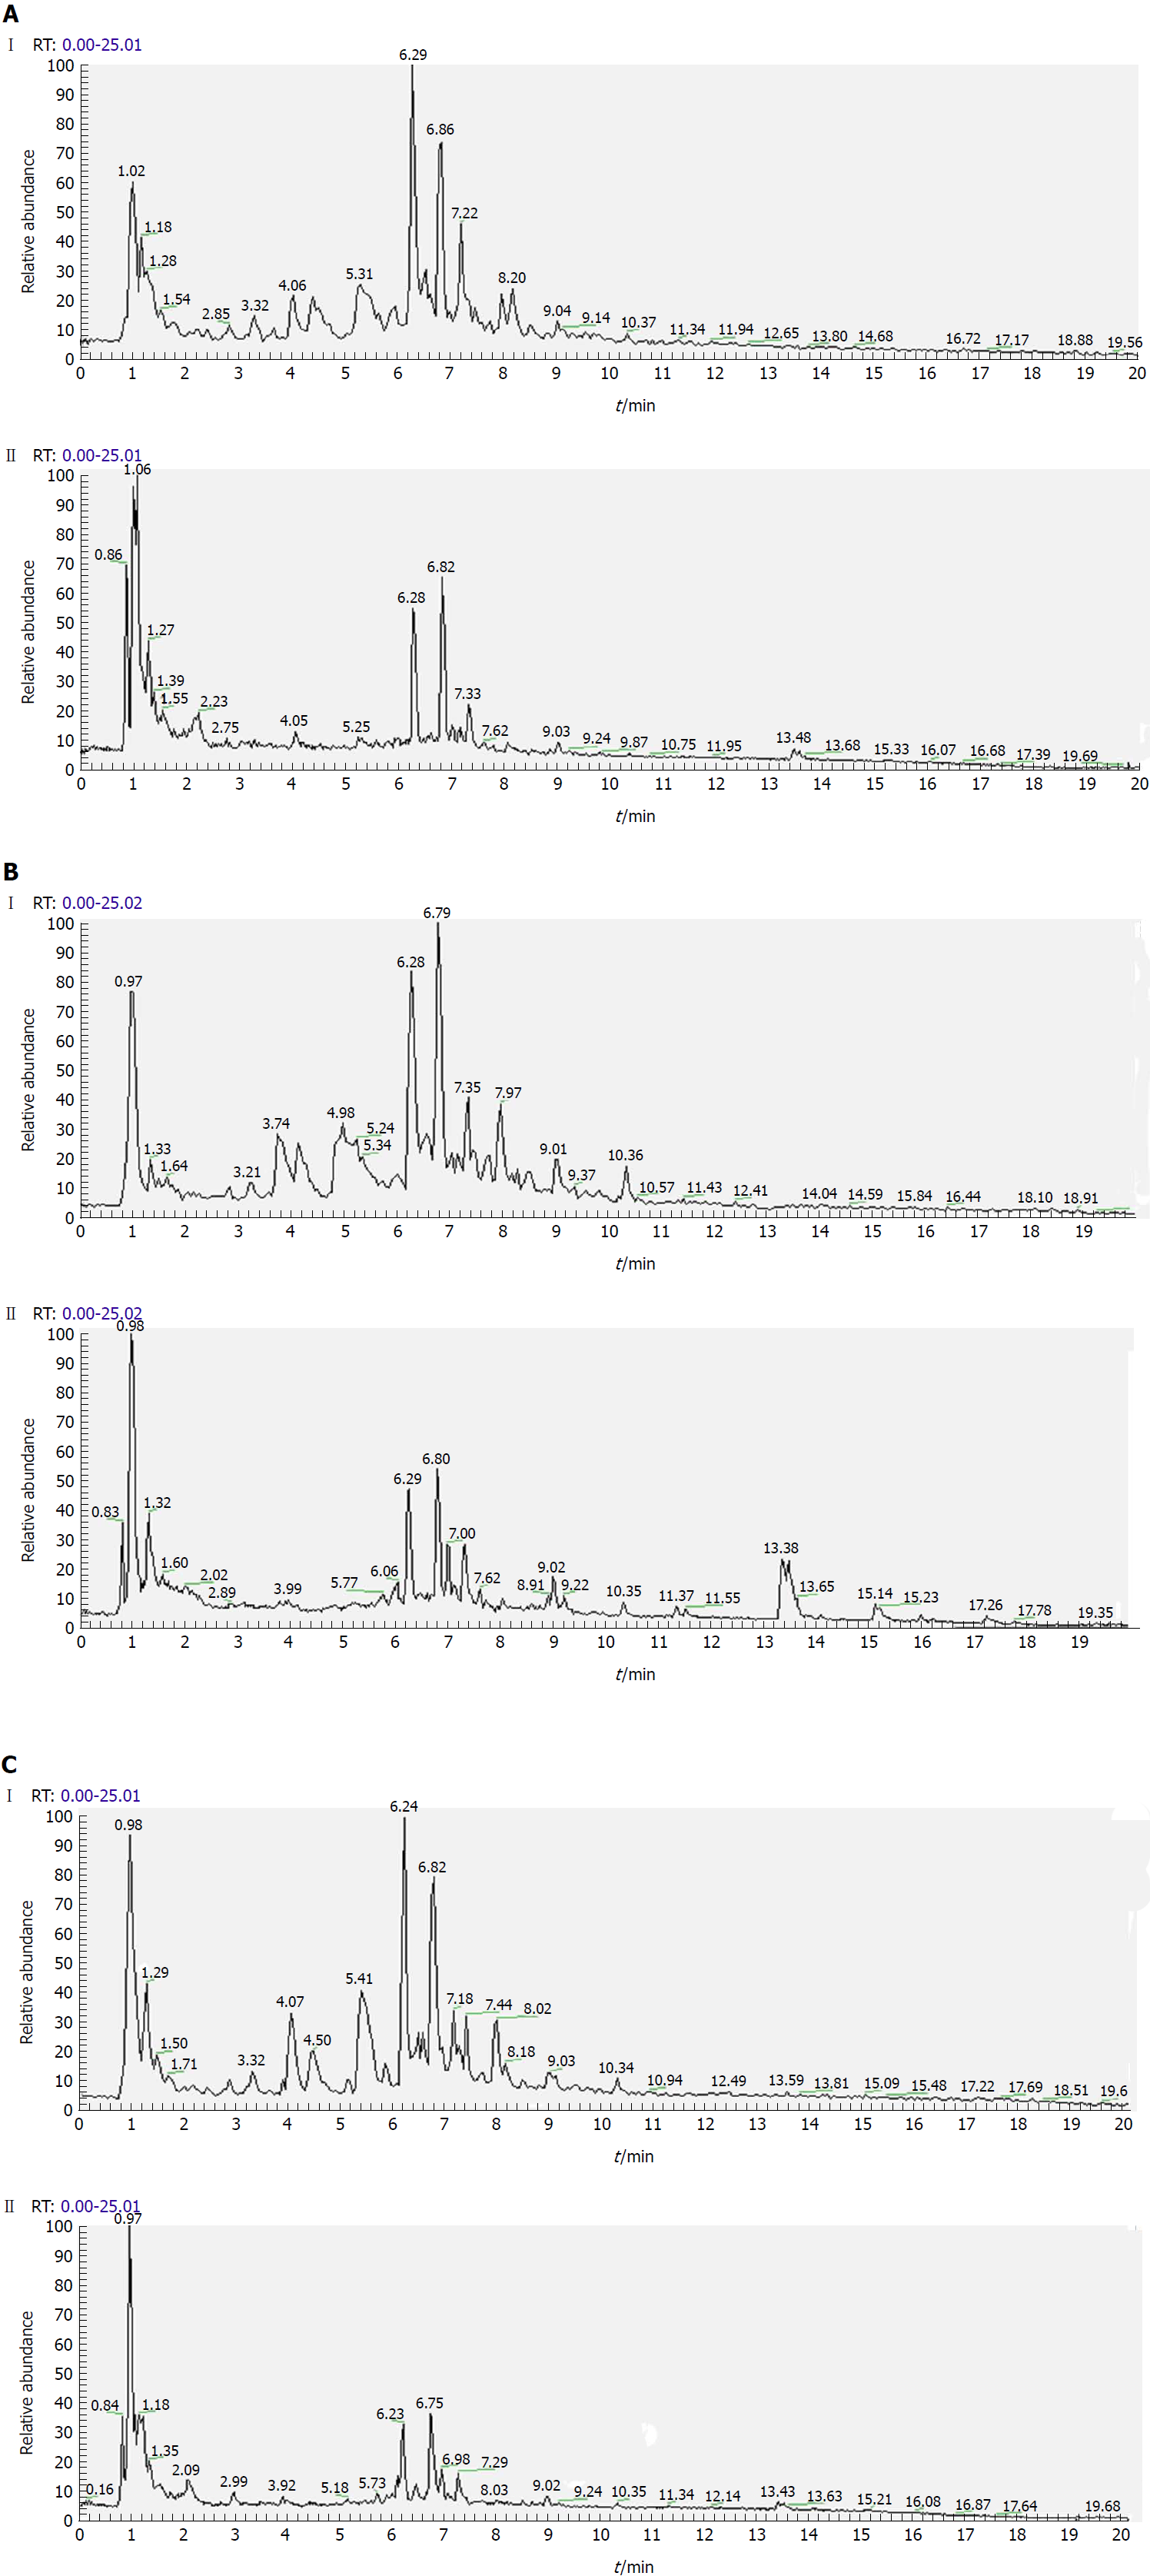
Figure 4 Representative total ion current profiles of urine samples in the negative (I) and positive (II) ion modes.
A: Control group; B: Model group; and C: Polygonatum kingianum group.
Figure 5 Representative total ion current profiles of liver samples in the negative (I) and positive (II) ion modes.
A: Control group; B: Model group; and C: Polygonatum kingianum group.
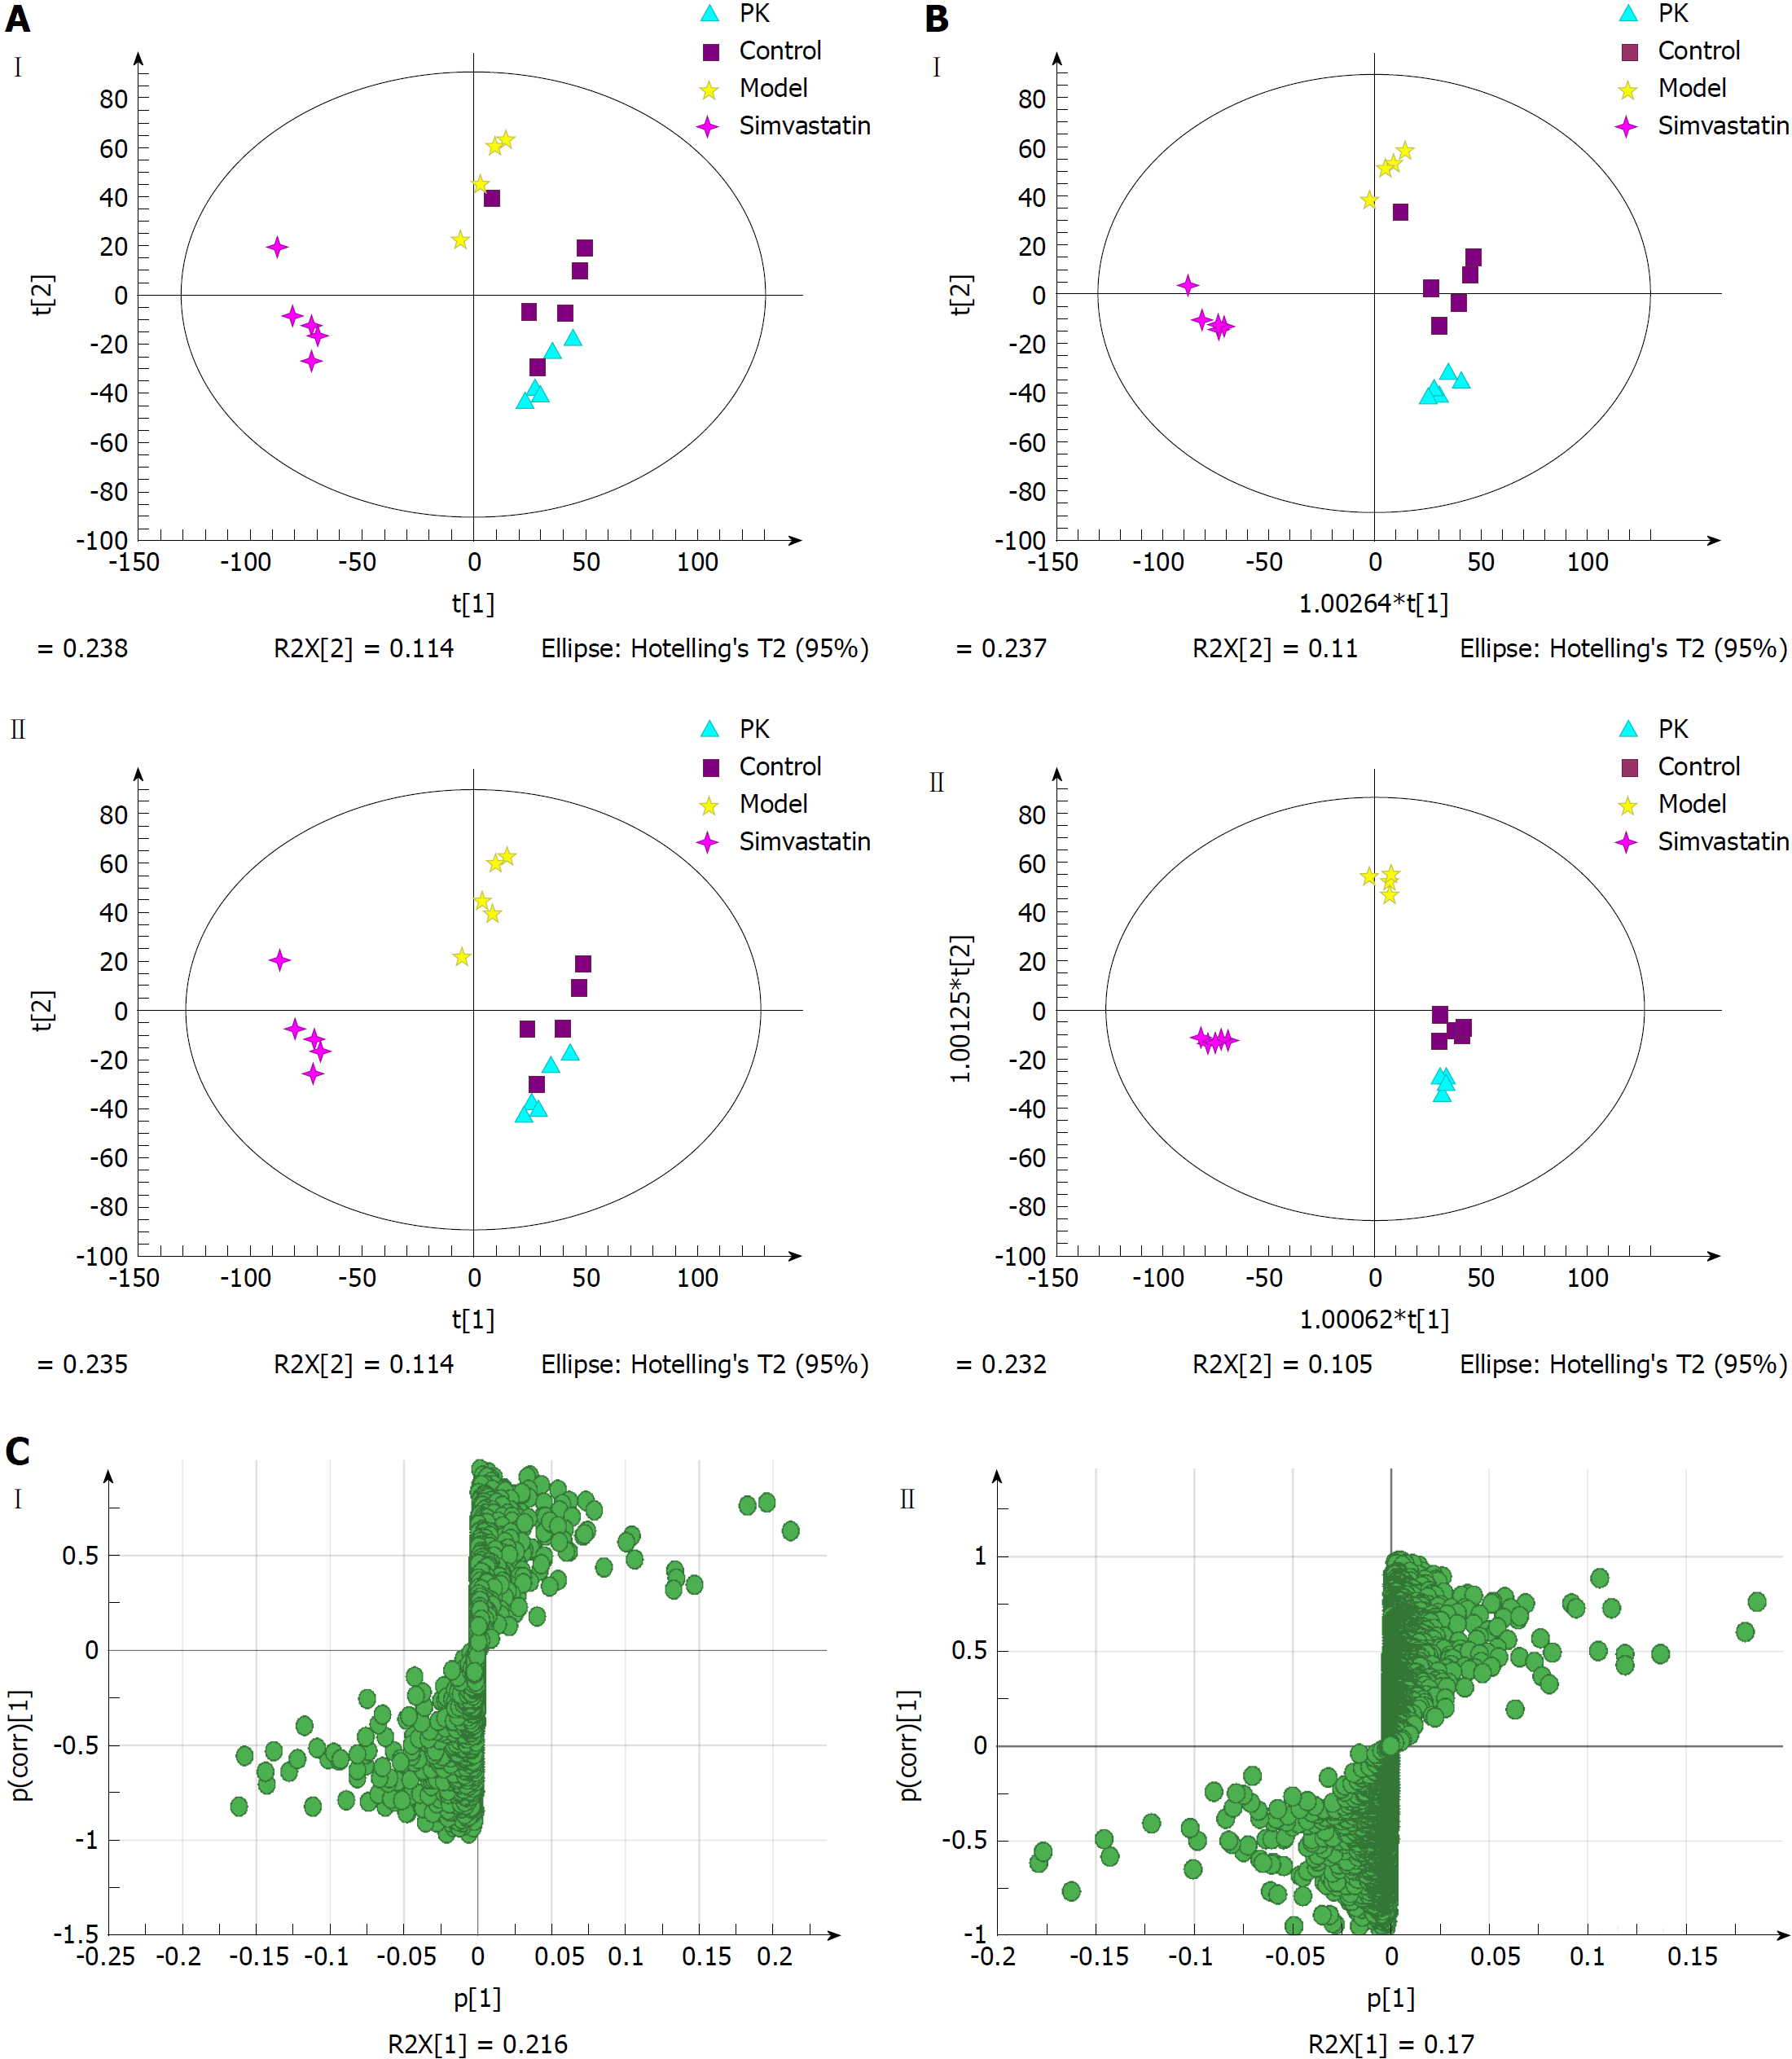
Figure 6 Multivariate statistical analysis of serum samples from model and Polygonatum kingianum groups in the negative (I) and positive (II) ion modes.
A: Principal components analysis score plots; B: Orthogonal partial least squares discriminant analysis score plots; C: S-plot loading diagram. PK: Polygonatum kingianum.
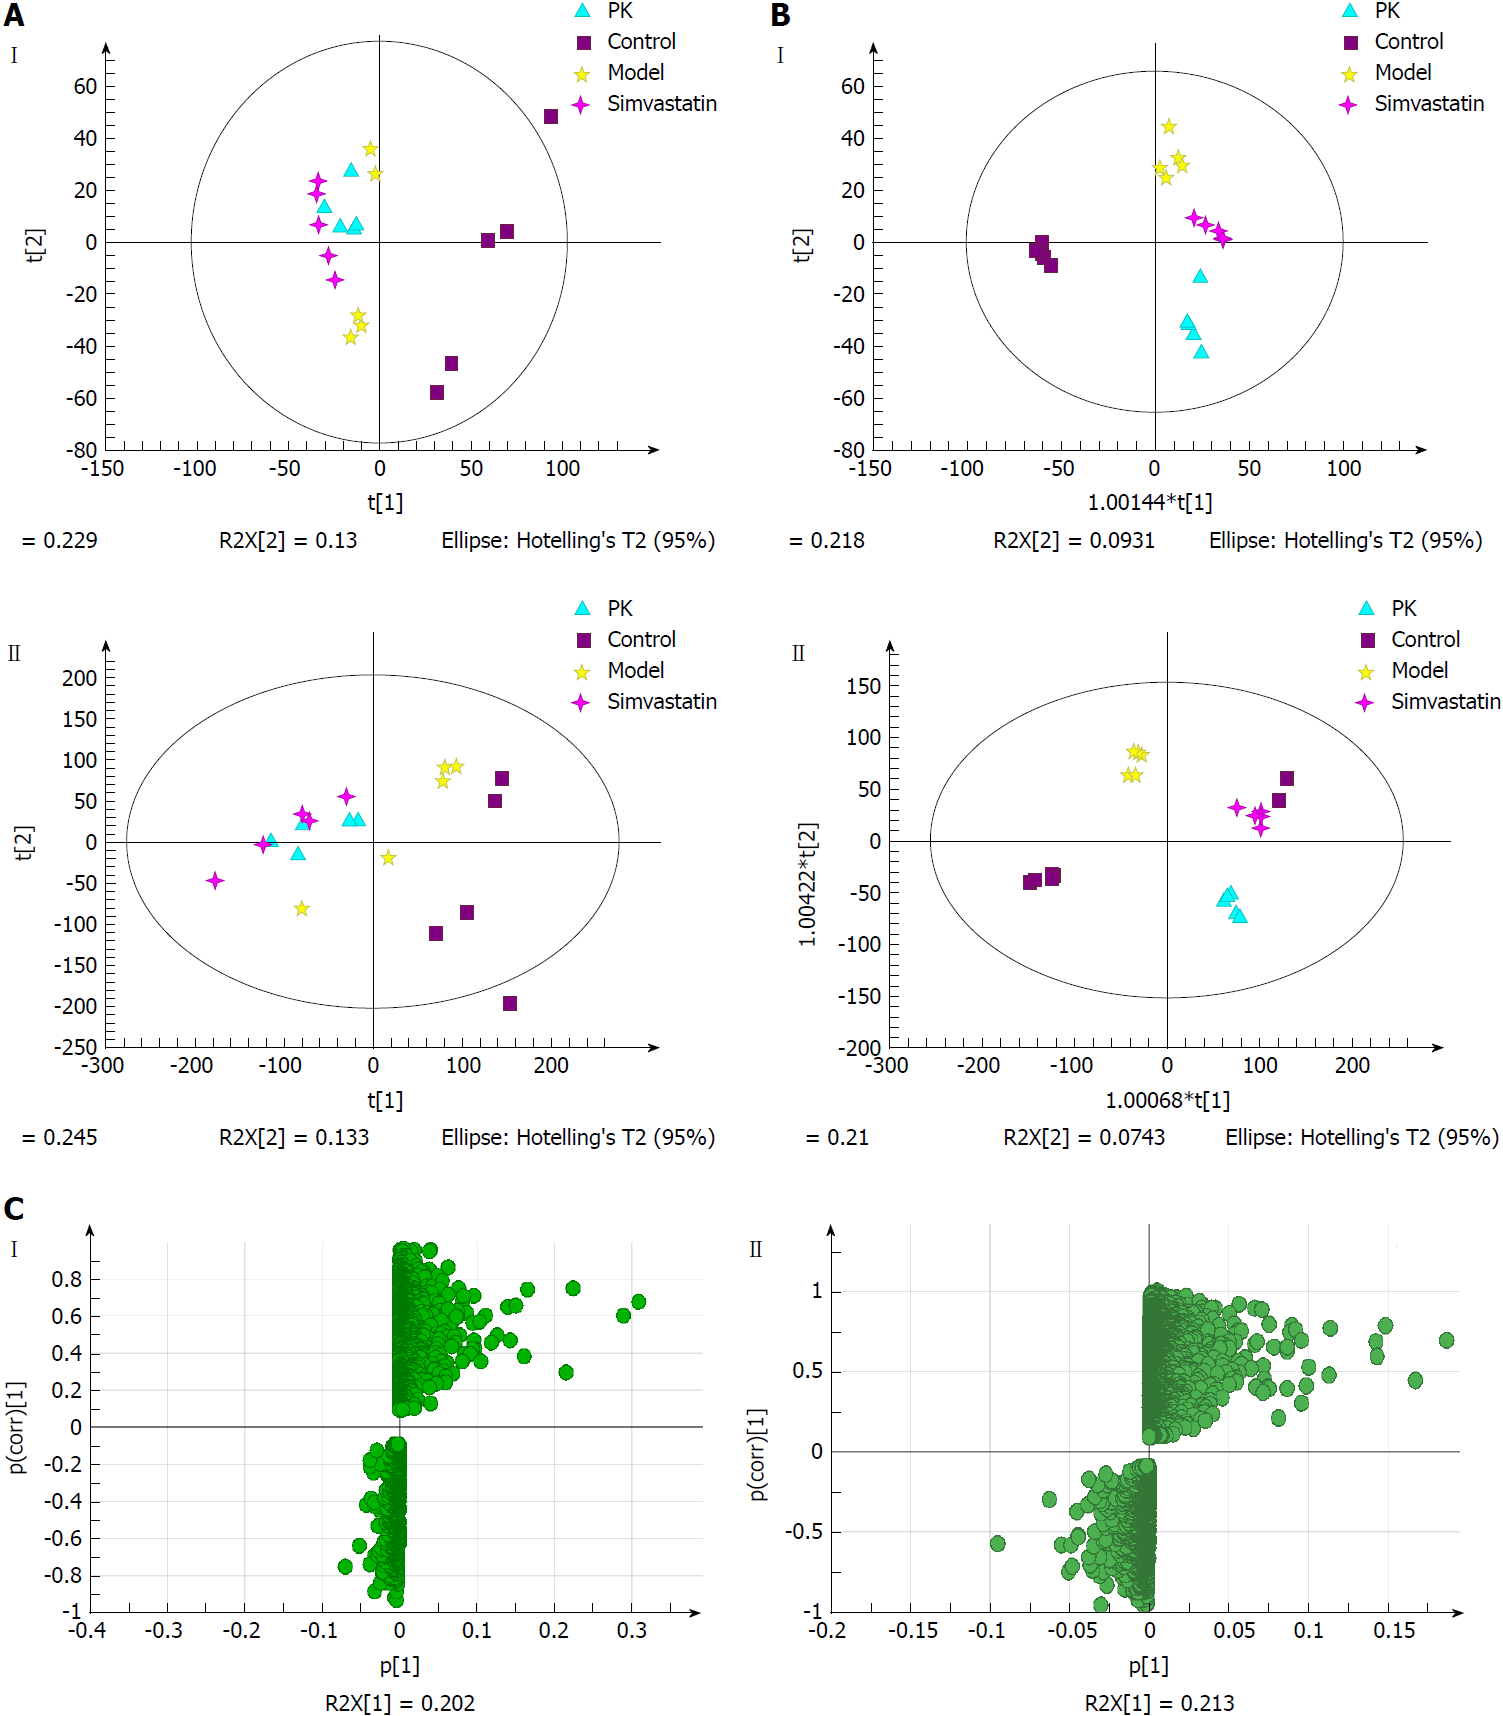
Figure 7 Multivariate statistical analysis of urine samples from model and Polygonatum kingianum groups in the negative (I) and positive (II) ion modes.
A: Principal components analysis score plots; B: Orthogonal partial least squares discriminant analysis score plots; C: S-plot loading diagram. PK: Polygonatum kingianum.
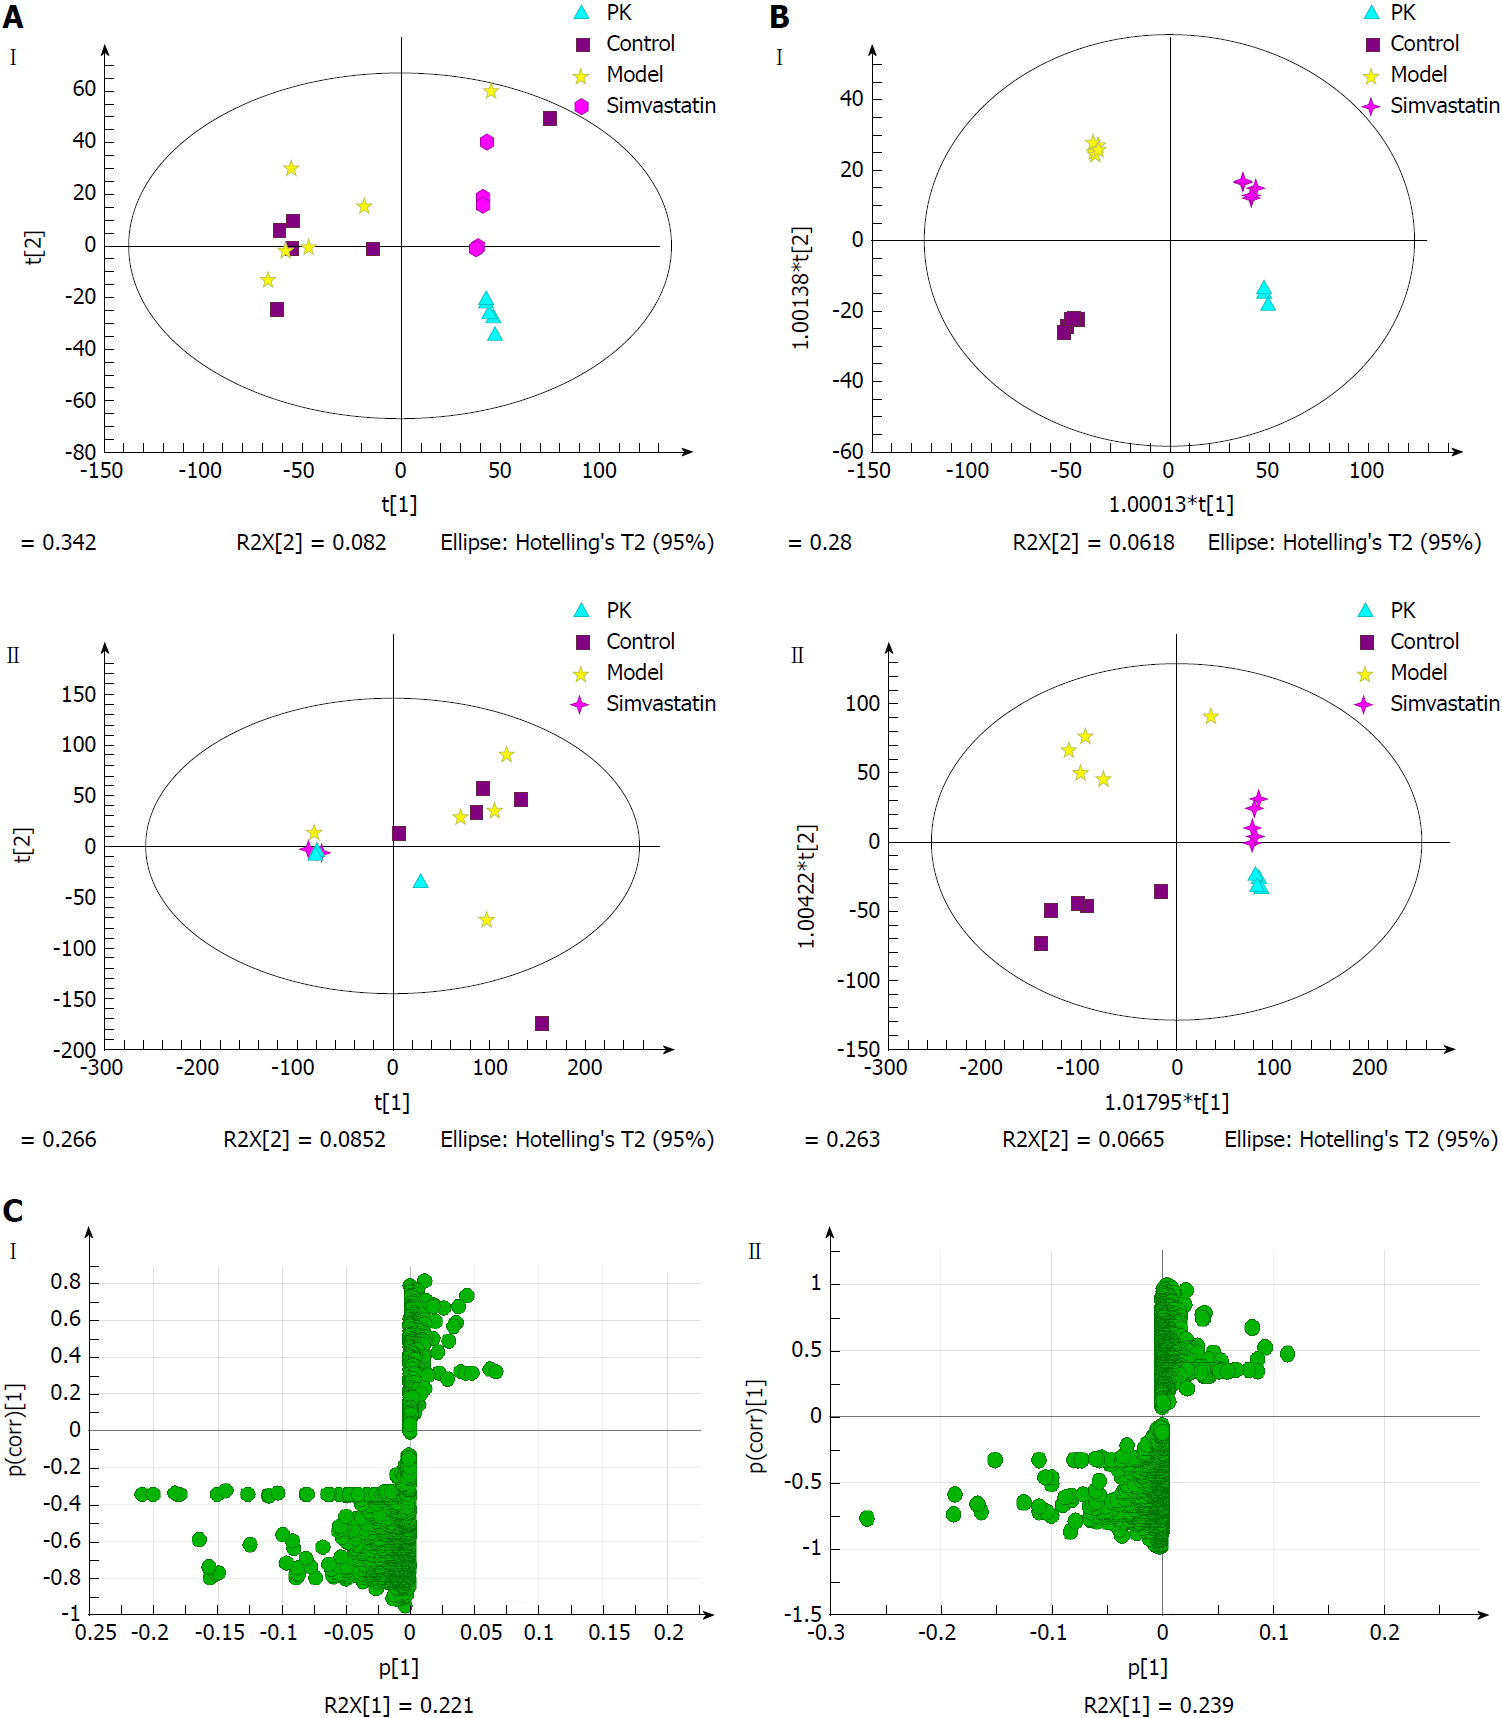
Figure 8 Multivariate statistical analysis of liver samples from model and Polygonatum kingianum groups in the negative (I) and positive (II) ion modes.
A: Principal components analysis score plots; B: Orthogonal partial least squares discriminant analysis score plots; C: S-plot loading diagram. PK: Polygonatum kingianum.
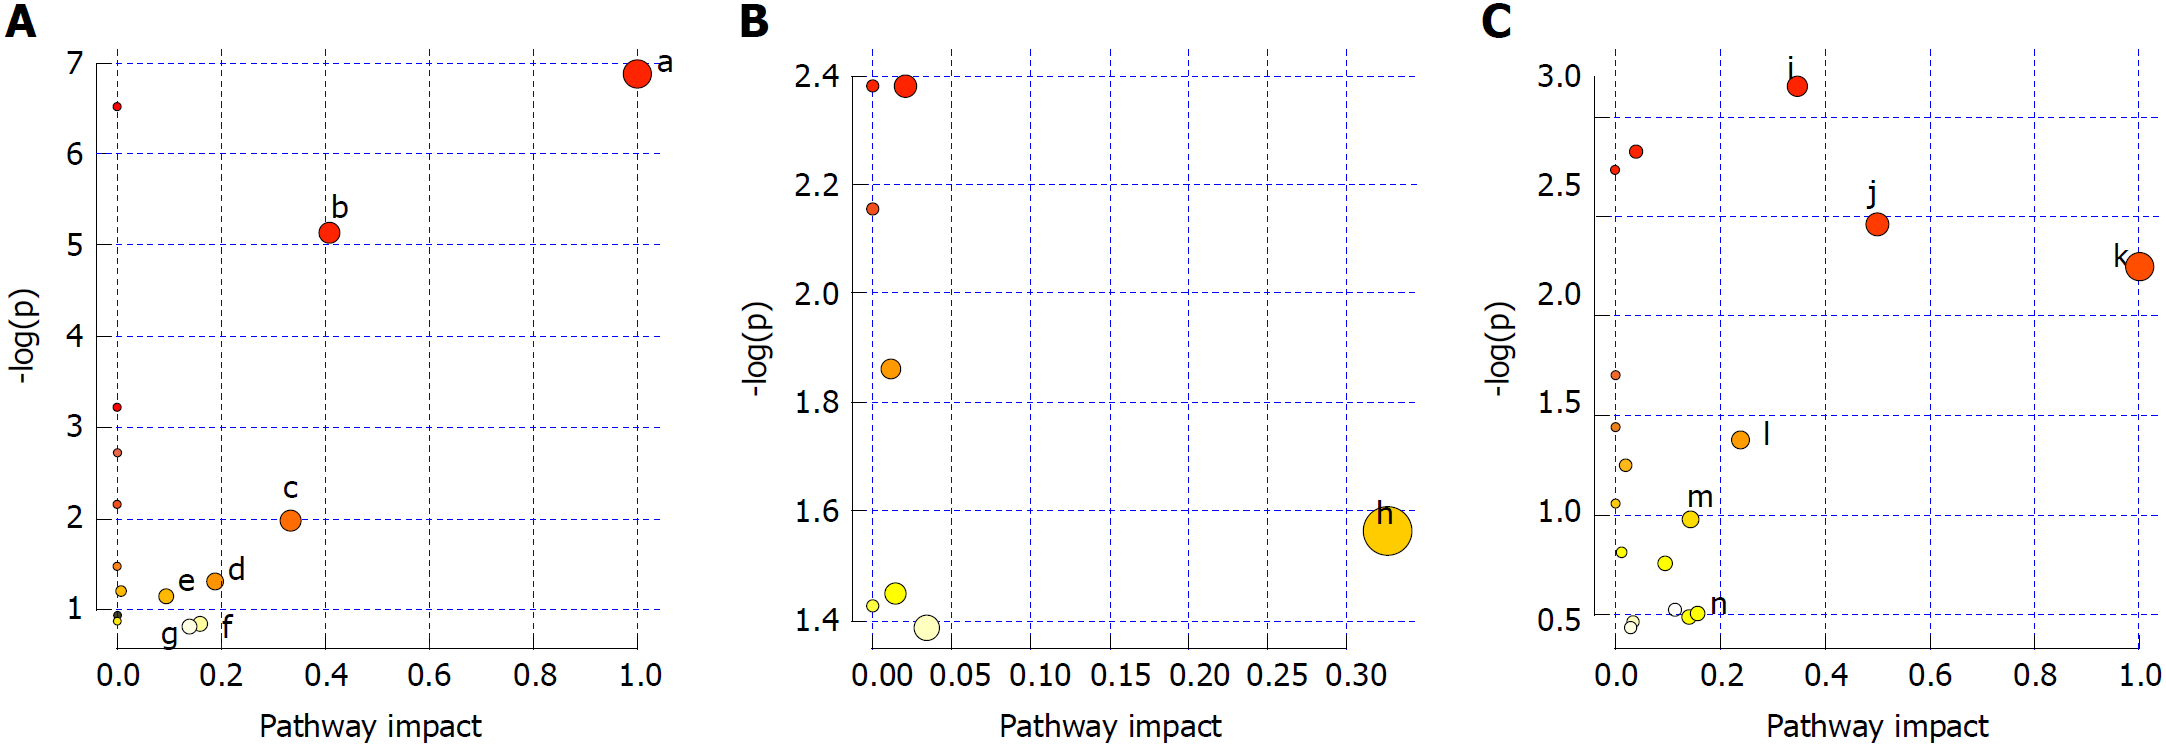
Figure 9 Analysis of metabolic pathways in serum (A), urine (B) and liver (C) samples.
a: Phenylalanine, tyrosine and tryptophan biosynthesis; b: Phenylalanine metabolism; c: Valine, leucine and isoleucine biosynthesis; d: Starch and sucrose metabolism; e: Glycerophospholipid metabolism; f: Tryptophan metabolism; g: Tyrosine metabolism; h: Arachidonic acid metabolism; i: Arachidonic acid metabolism; j: Phenylalanine, tyrosine and tryptophan biosynthesis; k: Linoleic acid metabolism; l: Nicotinate and nicotinamide metabolism; m: Sphingolipid metabolism; n: Tryptophan metabolism; and o: Tyrosine metabolism.
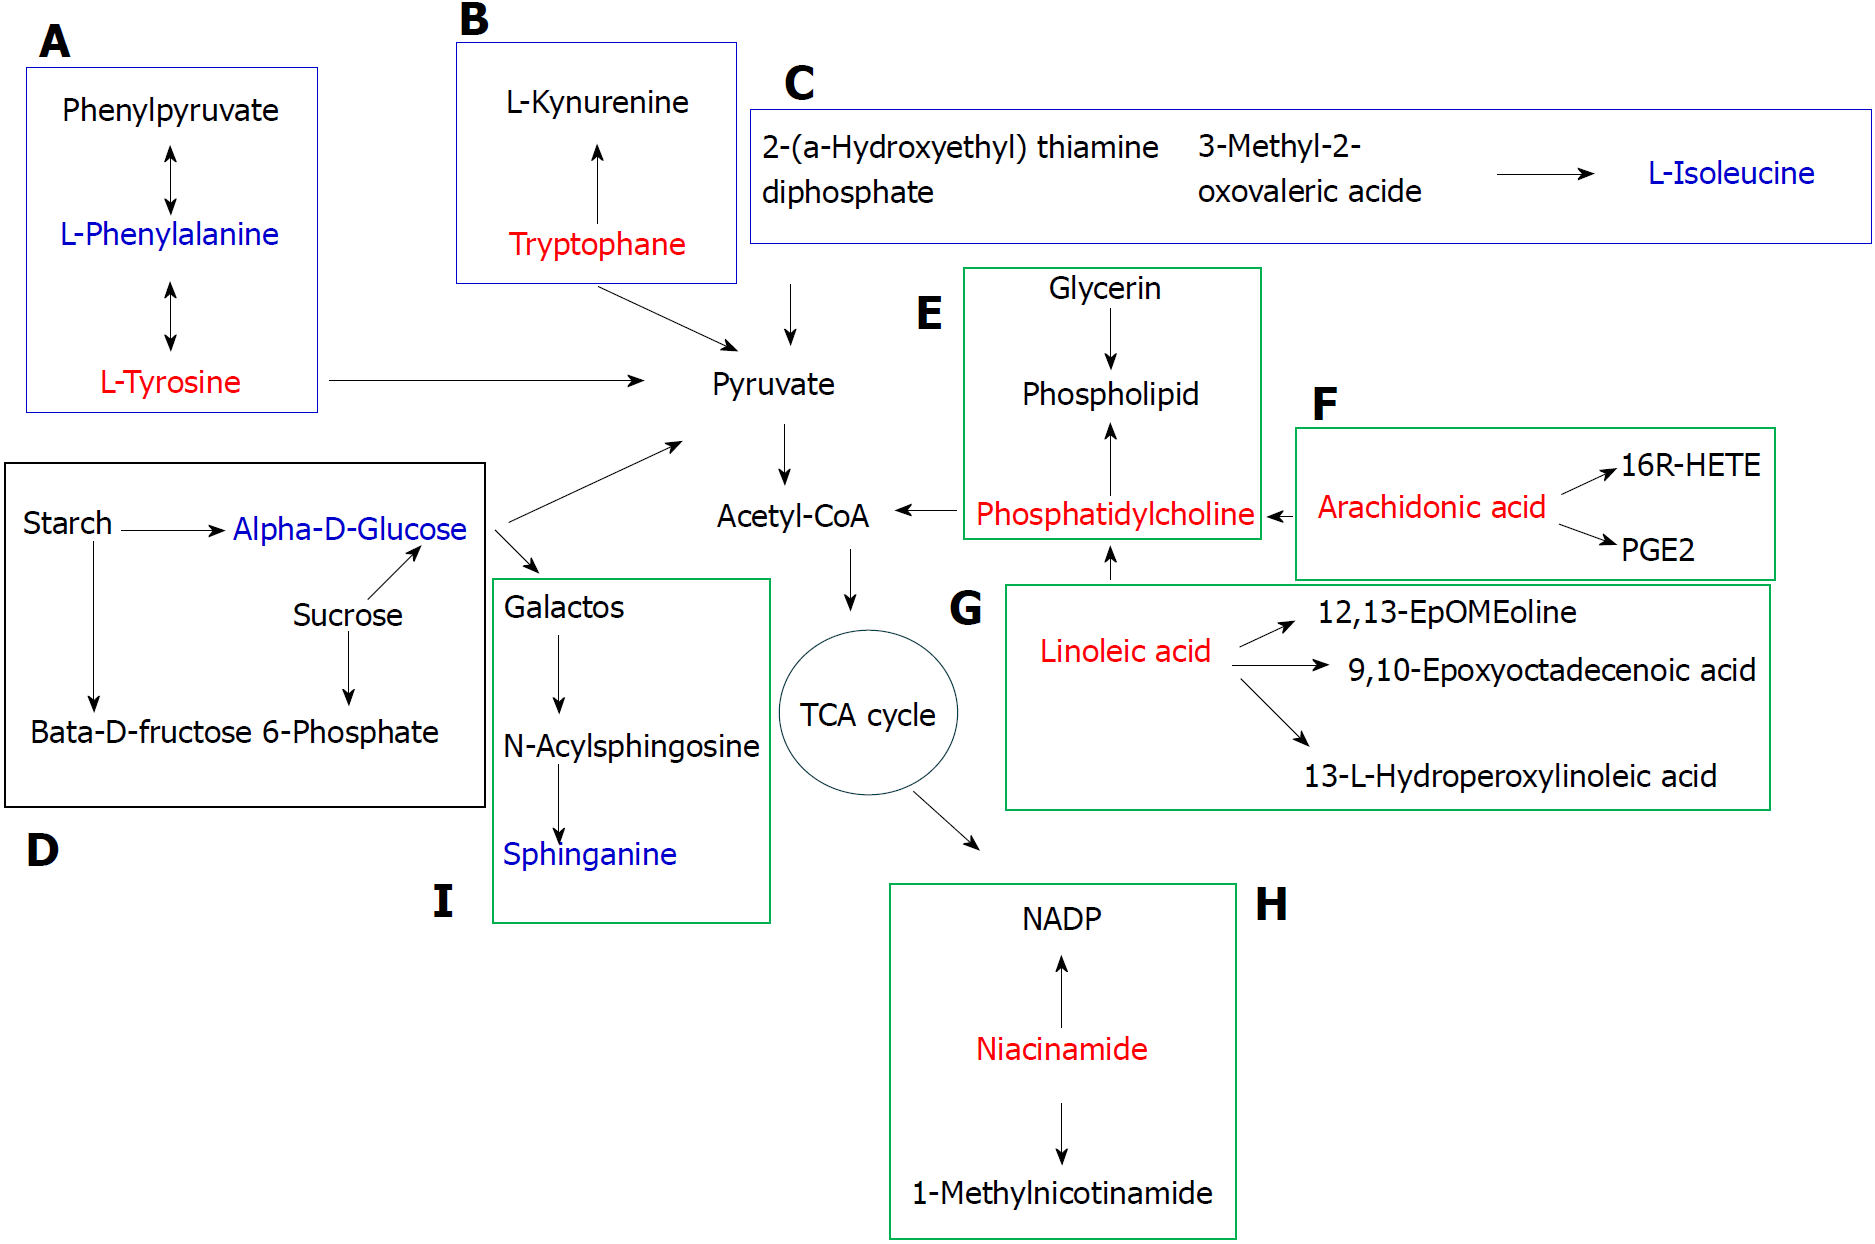
Figure 10 Metabolic pathway map of potential biomarkers.
The red and blue font represents potential biomarkers that were up- and down-regulated by Polygonatum kingianum treatment, respectively. The blue, black and green box represents amino acid, sugar and lipid metabolism, respectively. A: Phenylalanine, tyrosine and tryptophan biosynthesis, and phenylalanine and tyrosine metabolism; B: Tryptophan metabolism; C: Valine, leucine and isoleucine biosynthesis; D: Starch and sucrose metabolism; E: Glycerophospholipid metabolism; F: Arachidonic acid metabolism; G: Linoleic acid metabolism; H: Nicotinate and nicotinamide metabolism; and I: Sphingolipid metabolism. TCA: Tricarboxylic acid.
- Citation: Yang XX, Wei JD, Mu JK, Liu X, Dong JC, Zeng LX, Gu W, Li JP, Yu J. Integrated metabolomic profiling for analysis of antilipidemic effects of Polygonatum kingianum extract on dyslipidemia in rats. World J Gastroenterol 2018; 24(48): 5505-5524
- URL: https://www.wjgnet.com/1007-9327/full/v24/i48/5505.htm
- DOI: https://dx.doi.org/10.3748/wjg.v24.i48.5505


