Copyright
©The Author(s) 2018.
World J Gastroenterol. Dec 21, 2018; 24(47): 5391-5402
Published online Dec 21, 2018. doi: 10.3748/wjg.v24.i47.5391
Published online Dec 21, 2018. doi: 10.3748/wjg.v24.i47.5391
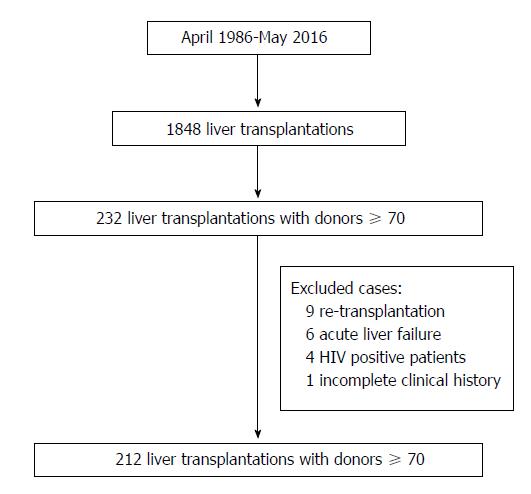
Figure 1 Flowchart of the selection of the cases included in the present study.
HIV: Human immunodeficiency virus.
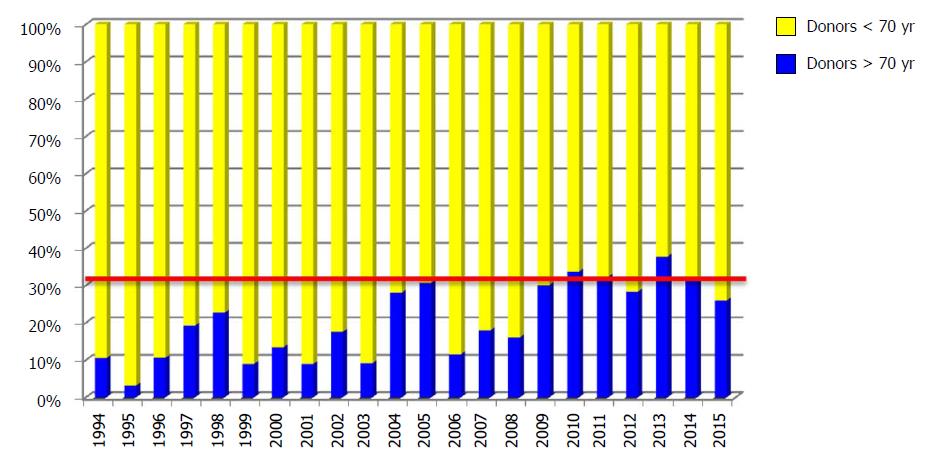
Figure 2 Rate of transplants performed in our department from 1996 to 2015 with donors ≥ 70 years old.
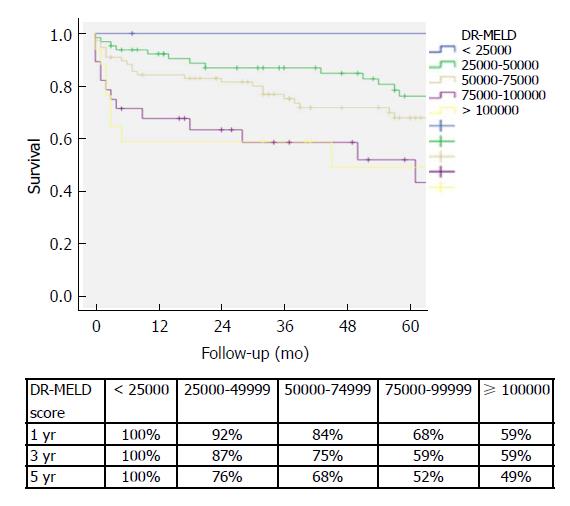
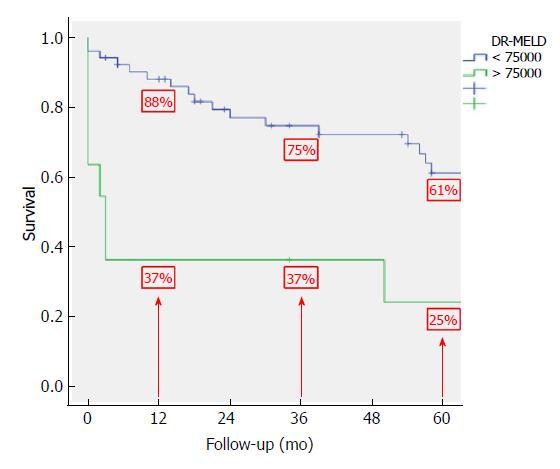
Figure 3 Graft survival according to donor age X recipient age X model for end-stage liver disease score in patients undergoing liver transplantation with grafts ≥ 70 years old.
Chi-square = 12.358, degrees of freedom = 1, P = 0.00. DR-MELD: Donor age X recipient age X model for end-stage liver disease.
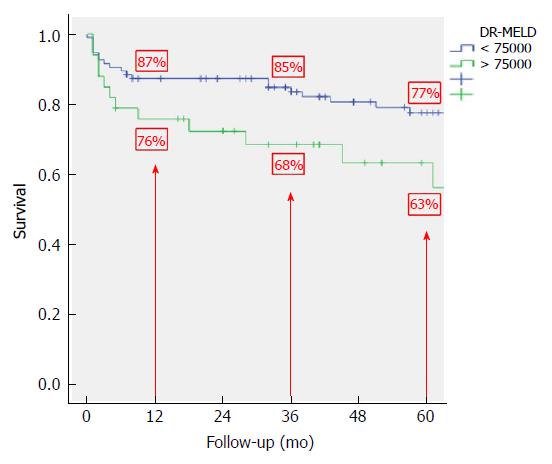
Figure 4 Graft survival in hepatitis C-negative patients according to donor age X recipient age X model for end-stage liver disease score after liver transplantation with grafts ≥ 70 years old.
Chi-square = 4.222, degrees of freedom = 1, P = 0.00. DR-MELD: Donor age X recipient age X model for end-stage liver disease.
Figure 5 Graft survival in hepatitis C-positive patients according to donor age X recipient age X model for end-stage liver disease score after liver transplantation with grafts ≥ 70 years old.
Chi-square = 12.615, degrees of freedom = 1, P = 0.00. DR-MELD: Donor age X recipient age X model for end-stage liver disease.
- Citation: Caso-Maestro O, Jiménez-Romero C, Justo-Alonso I, Calvo-Pulido J, Lora-Pablos D, Marcacuzco-Quinto A, Cambra-Molero F, García-Sesma A, Pérez-Flecha M, Muñoz-Arce C, Loinaz-Segurola C, Manrique-Municio A. Analyzing predictors of graft survival in patients undergoing liver transplantation with donors aged 70 years and over. World J Gastroenterol 2018; 24(47): 5391-5402
- URL: https://www.wjgnet.com/1007-9327/full/v24/i47/5391.htm
- DOI: https://dx.doi.org/10.3748/wjg.v24.i47.5391


