Copyright
©The Author(s) 2018.
World J Gastroenterol. Dec 21, 2018; 24(47): 5351-5365
Published online Dec 21, 2018. doi: 10.3748/wjg.v24.i47.5351
Published online Dec 21, 2018. doi: 10.3748/wjg.v24.i47.5351
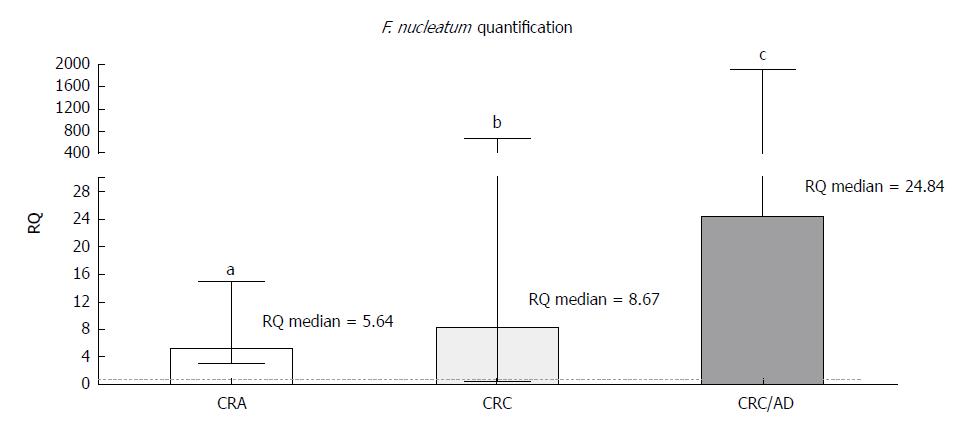
Figure 1 Relative quantification of the Fusobacterium nucleatum NusG gene in adenoma and colorectal cancer samples compared to adjacent normal tissues and colorectal cancer compared to adenoma tissue.
Statistically significant differences, according to the Wilcoxon signed-rank test, were as follows: colorectal adenoma: aP = 0.0002, colorectal cancer: bP = 0.0002, colorectal cancer/adenoma: cP < 0.0001. Median with interquartile range graph. CRA: Colorectal adenoma; CRC: Colorectal cancer; CRC/AD: Colorectal cancer/adenoma; RQ: Relative quantification; F. nucleatum: Fusobacterium nucleatum.
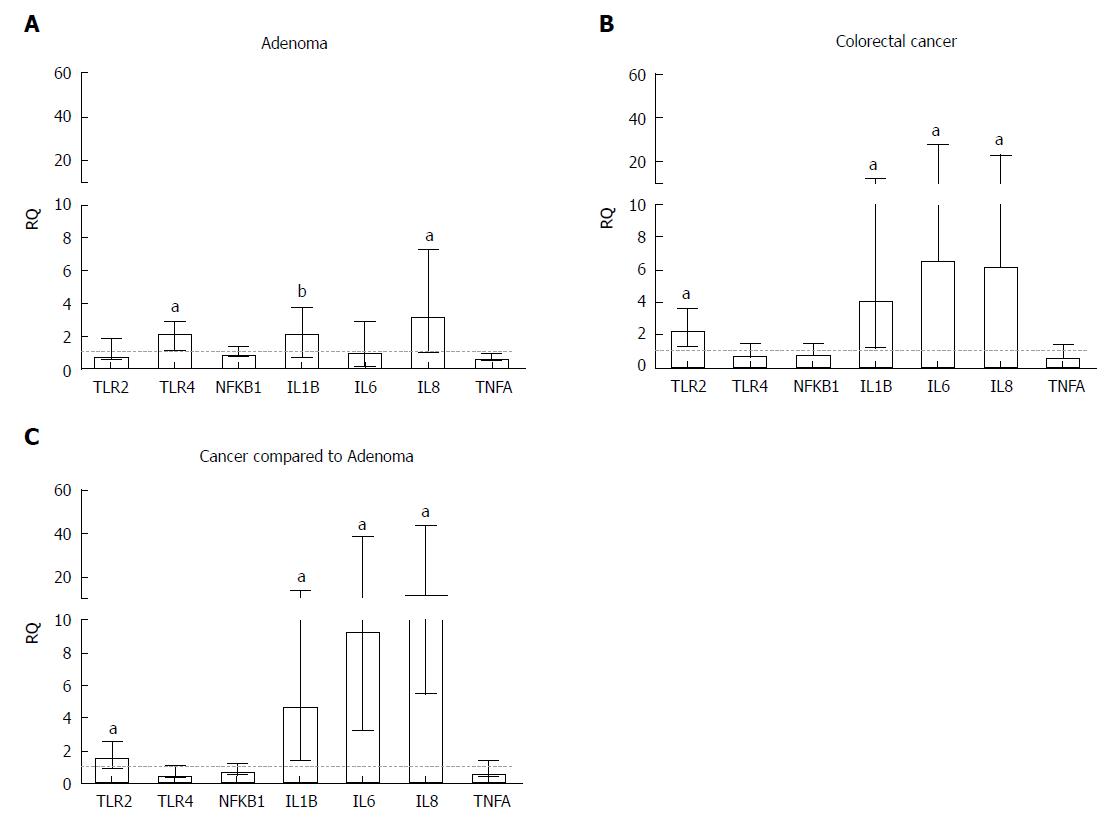
Figure 2 Relative quantification of inflammatory genes in (A) adenoma and (B) colorectal tumour tissue samples compared to a pool of respective adjacent normal tissue samples and (C) colorectal tumour tissue samples compared to adenoma samples.
All samples were normalized to the reference genes ACTB and GAPDH. Statistically significant differences, according to the Wilcoxon signed-rank test, were aP ≤ 0.001 and bP ≤ 0.01. Median with interquartile range graph. RQ: Relative quantification.
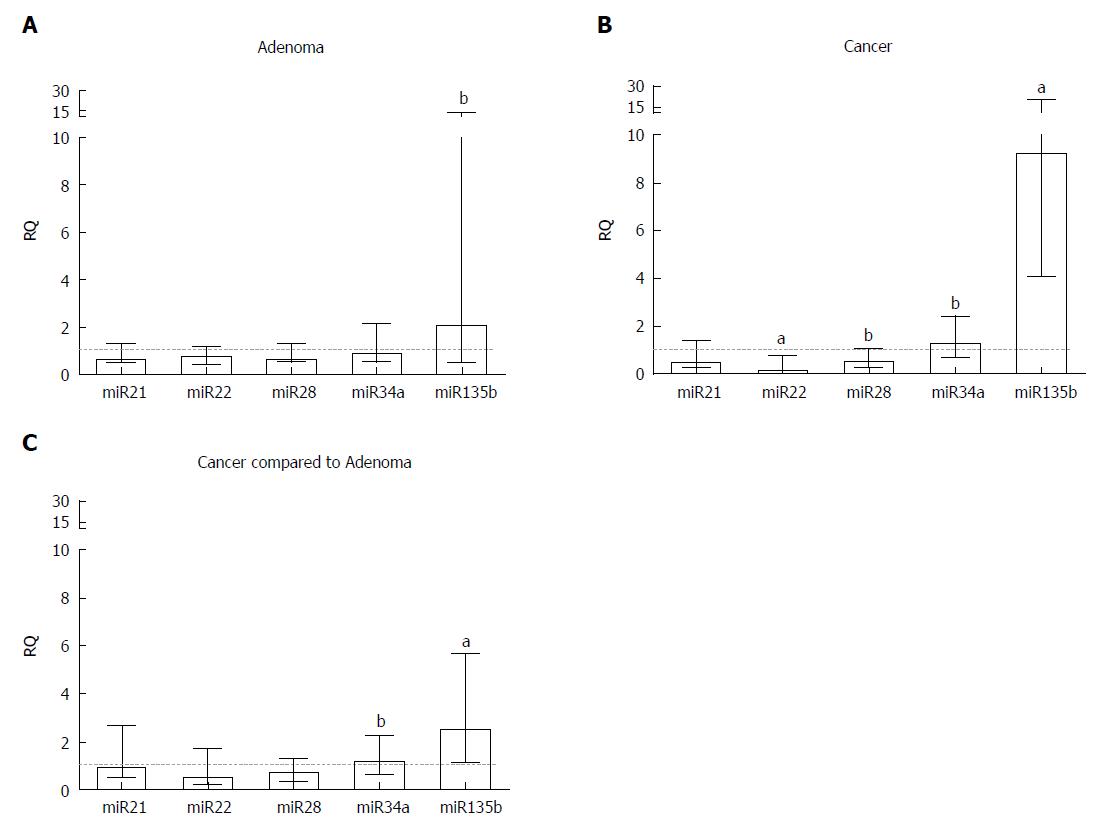
Figure 3 Relative quantification of microRNA genes in (A) adenoma and (B) colorectal tumour tissue samples compared to a pool of respective adjacent normal tissue samples and (C) colorectal tumour tissue samples compared to adenoma samples.
Statistically significant differences, according to the Wilcoxon signed-rank test, were aP ≤ 0.001 and bP ≤ 0.01. Median with interquartile range graph. RQ: Relative quantification.
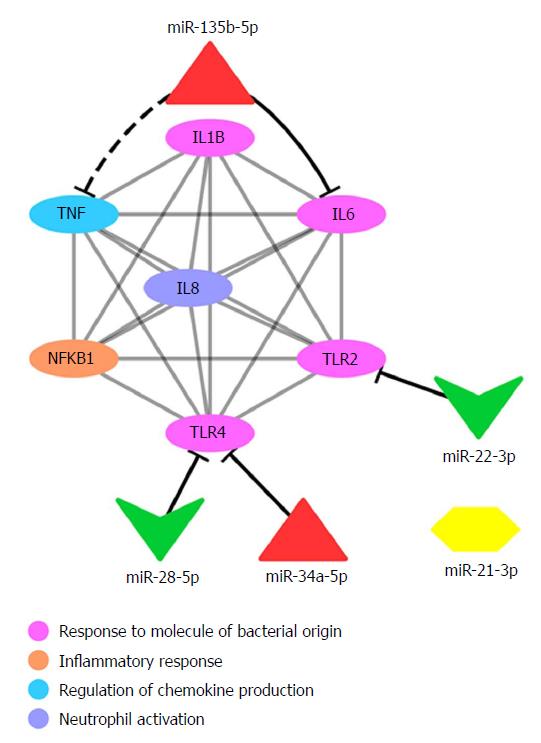
Figure 4 Protein interaction network showing microRNAs and their predicted gene targets.
The protein interaction network (grey lines) shows the interaction between proteins encoded by target genes that are predicted to be regulated by microRNAs (miRNAs). Predicted interactions between miRNAs and target genes are shown by black lines. The dashed black line represents the possible interaction suggested in this study for miR-135b-5p and TNF. Ellipses represent target genes and/or proteins; red triangles represent upregulated miRNAs; green triangles represent downregulated miRNAs. TNF: Tumour necrosis factor; IL: Interleukin; NFKB: Nuclear factor kappa B; TLR: Toll-like receptor.
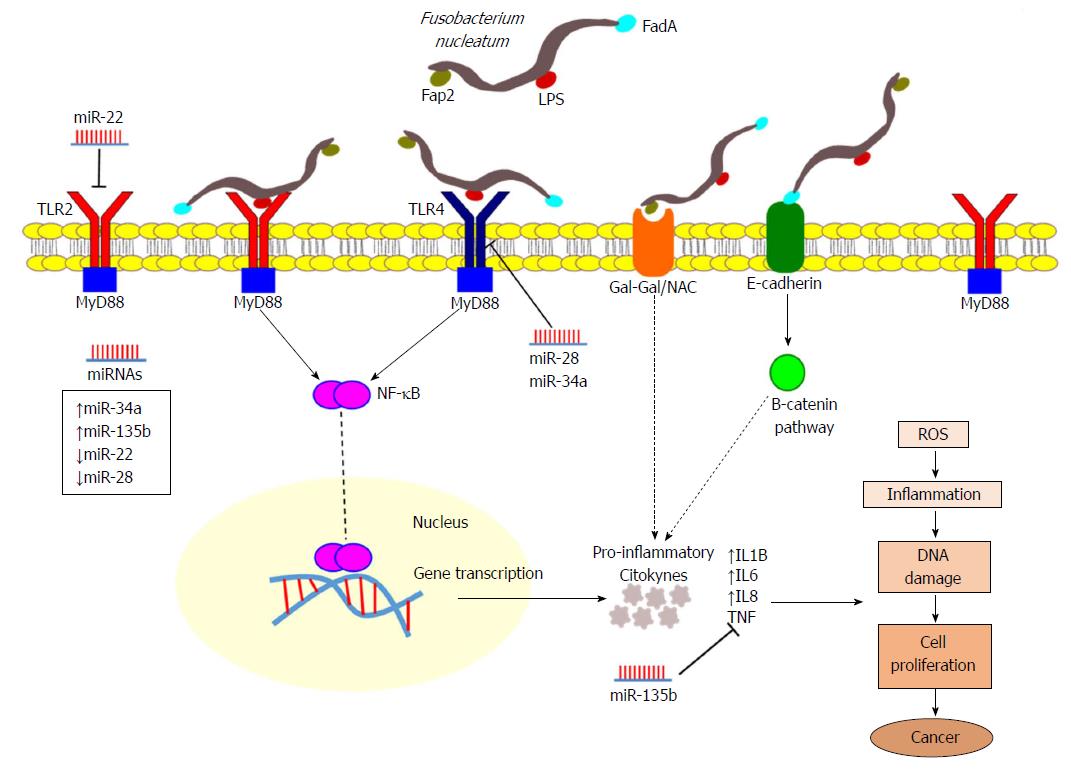
Figure 5 Representation illustrating the interactions of Fusobacterium nucleatum in colorectal cancer.
Fusobacterium nucleatum (F. nucleatum) presents the virulence factors FadA and Fap2 and lipopolysaccharide (LPS), which are recognized by Toll-like receptors (TLR2 and TLR4) mediating F. nucleatum invasion and the promotion of colorectal cancer (CRC). FadA, a surface adhesion protein, can bind to E-cadherin on CRC cells, activating B-catenin signalling. Fap2, a galactose-sensitive haemagglutinin and adhesion protein binding to Gal-GalNAc, contributes to the invasive ability of F. nucleatum. The TLR2/TLR4/MYD88 pathway is activated in response to F. nucleatum, leading to the activation of NF-κB, a transcription factor that is involved in regulating the expression of many genes, leading to elevated expression levels of oncogenes and pro-inflammatory cytokines, mainly interleukin (IL)1B, IL6, IL8 and tumour necrosis factor, inducing the production of reactive oxygen species, which subsequently lead to inflammation and DNA damage that promotes tumour growth and progression. Furthermore, these pathways may be under the regulation of differentially expressed microRNAs. ROS: Reactive oxygen species; TNF: Tumour necrosis factor; IL: Interleukin; NF-κB: Nuclear factor kappa B; TLR: Toll-like receptor; miRNA: MicroRNA.
- Citation: Proença MA, Biselli JM, Succi M, Severino FE, Berardinelli GN, Caetano A, Reis RM, Hughes DJ, Silva AE. Relationship between Fusobacterium nucleatum, inflammatory mediators and microRNAs in colorectal carcinogenesis. World J Gastroenterol 2018; 24(47): 5351-5365
- URL: https://www.wjgnet.com/1007-9327/full/v24/i47/5351.htm
- DOI: https://dx.doi.org/10.3748/wjg.v24.i47.5351


