Copyright
©The Author(s) 2018.
World J Gastroenterol. Dec 21, 2018; 24(47): 5338-5350
Published online Dec 21, 2018. doi: 10.3748/wjg.v24.i47.5338
Published online Dec 21, 2018. doi: 10.3748/wjg.v24.i47.5338
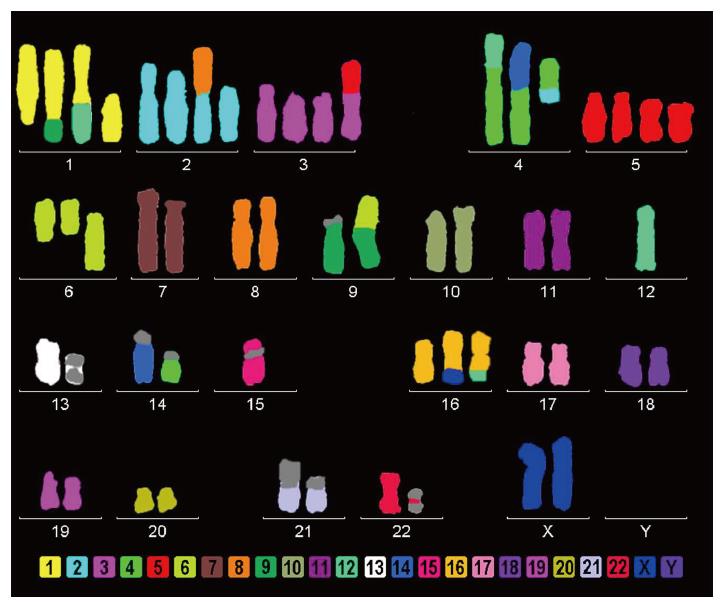
Figure 1 AGP01 cell line multicolor-FISH showing several chromosomal changes, including the monosomy of chromosome 12, where the PIWIL1 gene is located.
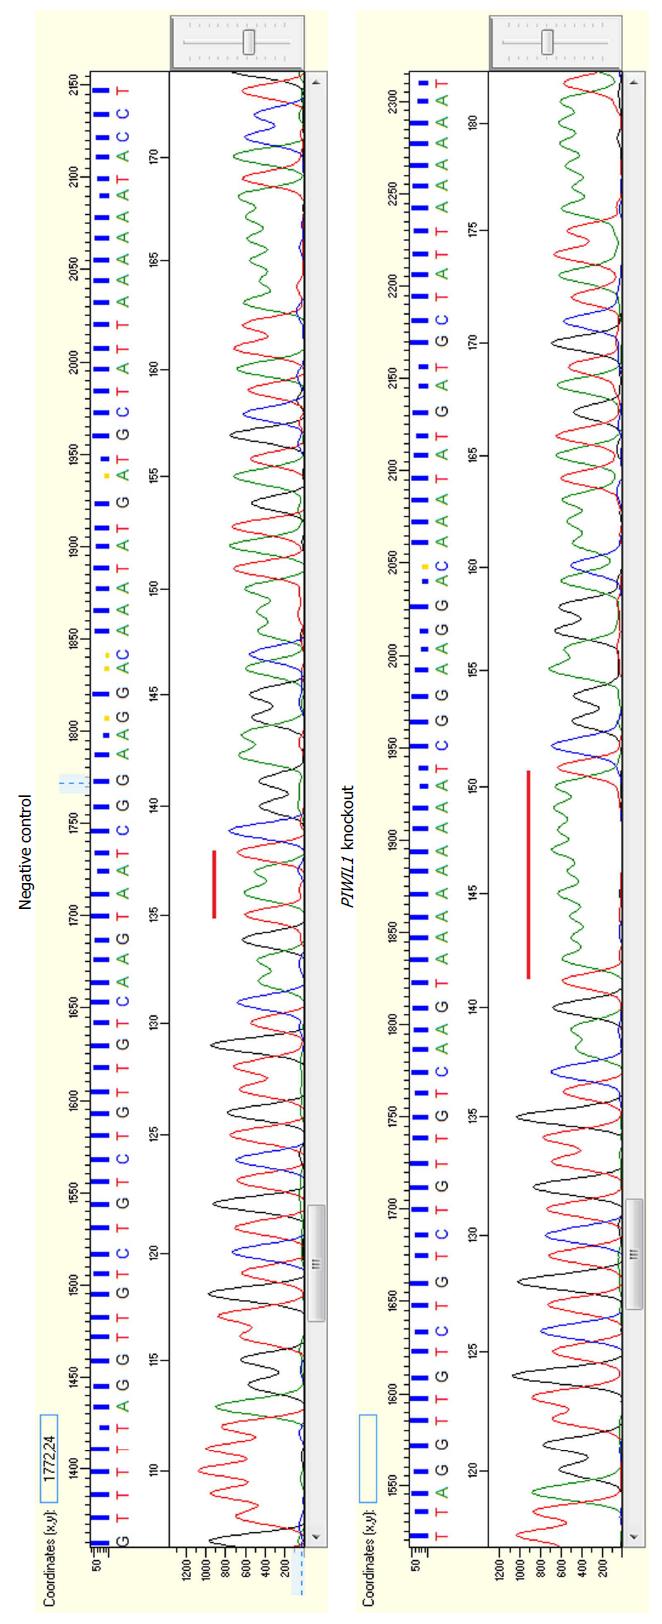
Figure 2 Electropherograms showing the insertion of seven adenines in the PIWIL1 gene sequence after using the CRISPR-Cas9 system (B) in comparison with the reference sequence of the negative control (A).
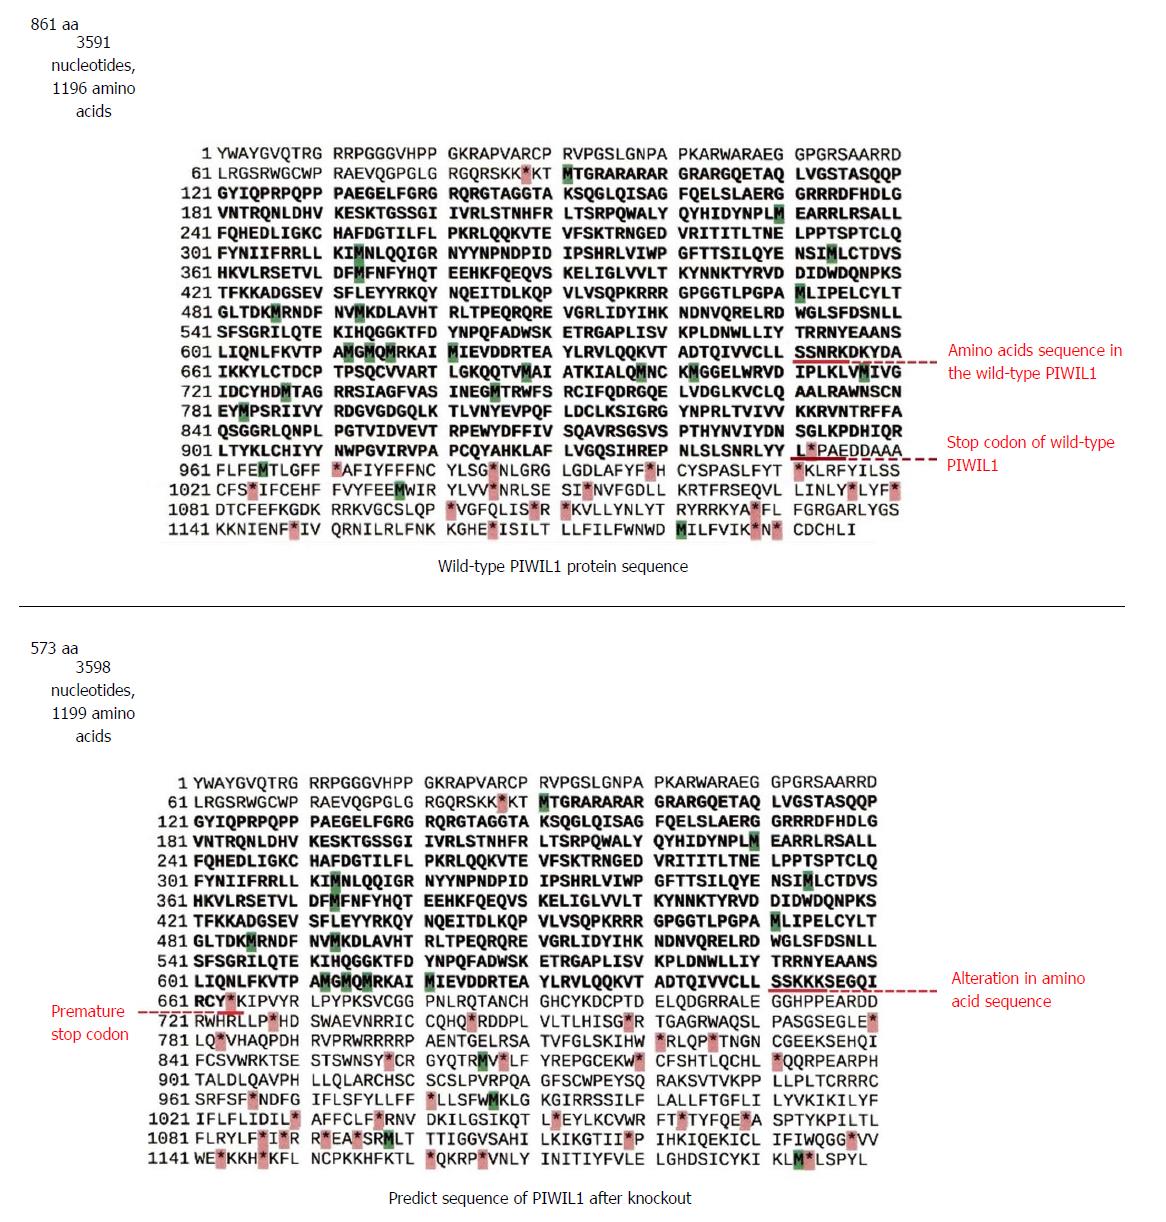
Figure 3 Amino acid sequences of the wild-type PIWIL1 protein and the PIWIL1 protein after the insertion of seven adenines by the CRISPR-Cas9 system.
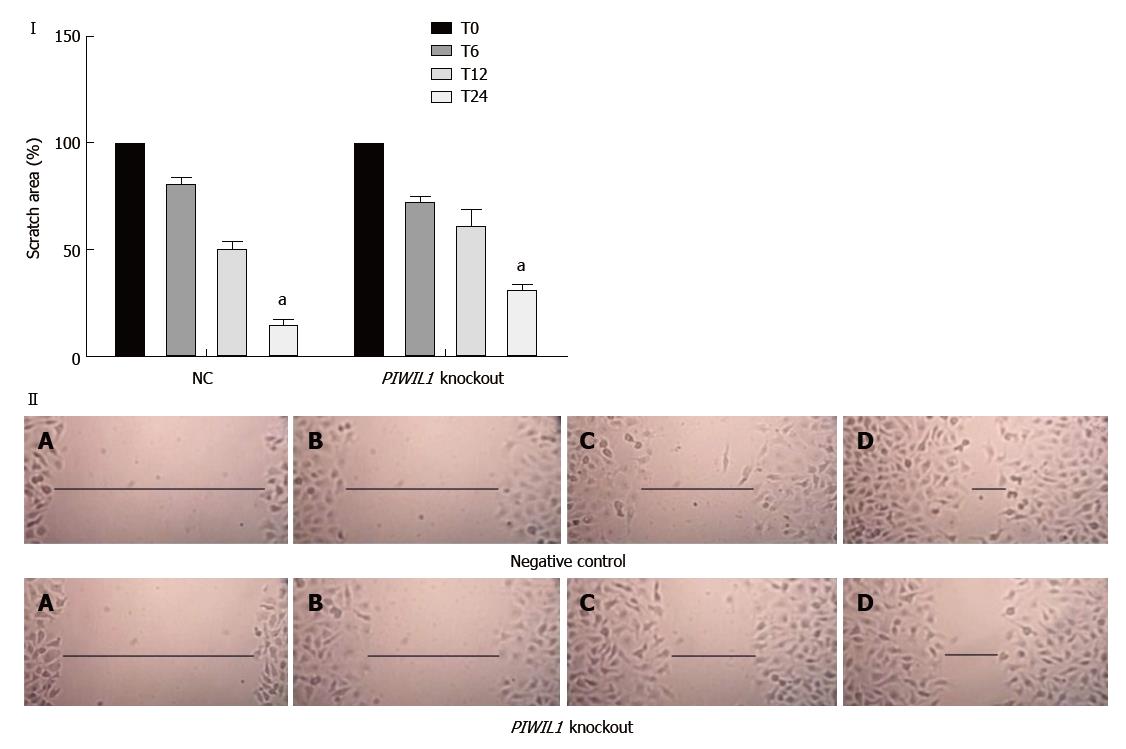
Figure 4 Analysis of the migration capacity of the AGP01 cell line with and without PIWIL1 gene knockout.
T0: Immediately after injury; T6: 6 h after injury; T12: 12 h after injury; T24: 24 h after injury. NC: Negative control. aP < 0.01. Two-way ANOVA, Bonferroni post-test. Photomicrography of AGP01 cell migration. A: Immediately after injury; B: 6 h after injury; C: 12 h after injury; D: 24 h after injury. The black lines represent approximation of the edges over time, demonstrating the migration capacity of the cells.
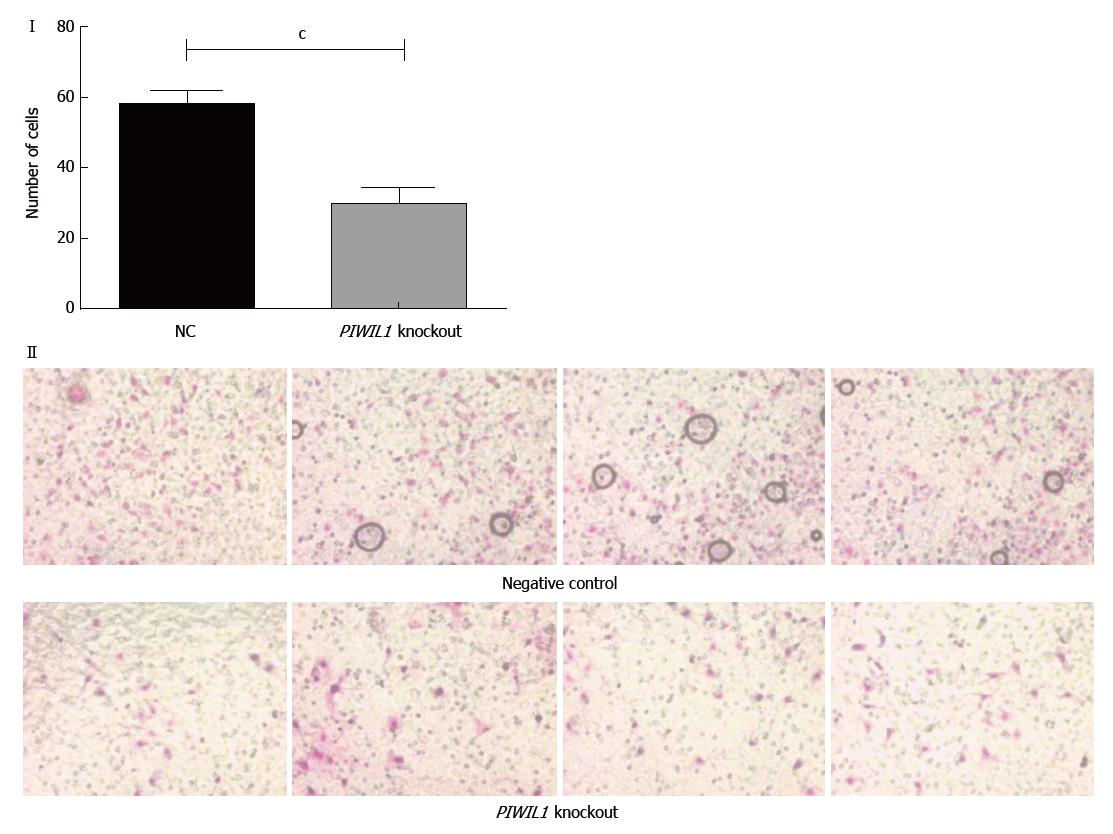
Figure 5 Analysis of the invasion capacity of the AGP01 cell line with and without the PIWIL1 gene knockout.
Statistically significant difference between groups was shown by the Student’s t test (cP < 0.001). Photomicrography of the cell invasion assay demonstrating the decrease in the number of cells that invaded when PIWIL1 was knocked out. NC: Negative control.
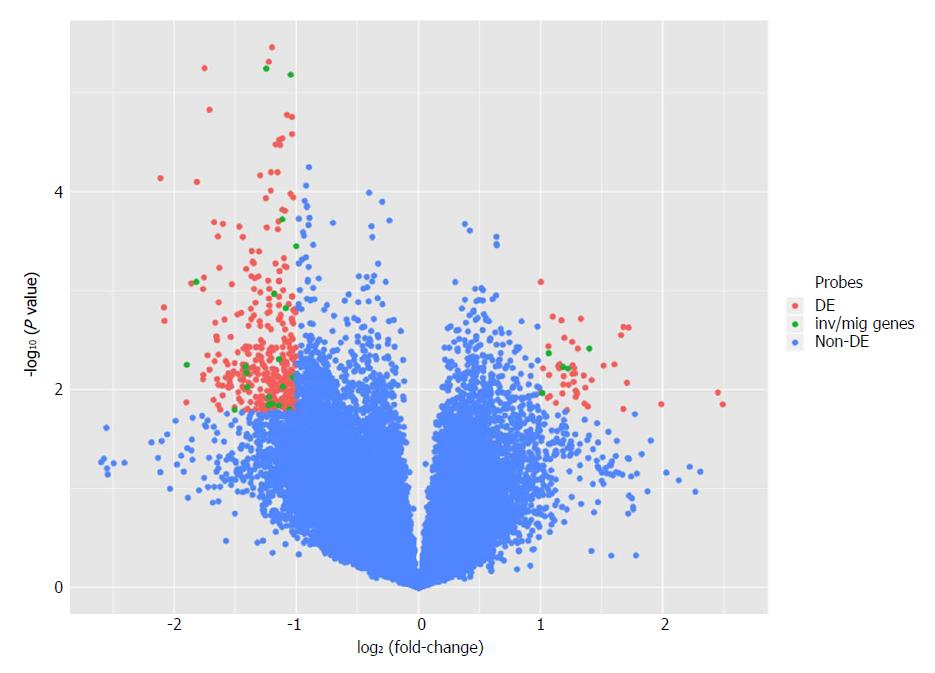
Figure 6 Volcano plot comparing gene expression after PIWIL1 permanent knockout in the gastric cancer AGP01 cell line.
Differentially expressed probes [adjusted P-value of < 0.05 and |Log2(Fold-Change)| > 1] are on superior left and right areas (red). mRNAs involved in invasion and migration processes are in green.
- Citation: Araújo T, Khayat A, Quintana L, Calcagno D, Mourão R, Modesto A, Paiva J, Lima A, Moreira F, Oliveira E, Souza M, Othman M, Liehr T, Abdelhay E, Gomes R, Santos S, Assumpção P. Piwi like RNA-mediated gene silencing 1 gene as a possible major player in gastric cancer. World J Gastroenterol 2018; 24(47): 5338-5350
- URL: https://www.wjgnet.com/1007-9327/full/v24/i47/5338.htm
- DOI: https://dx.doi.org/10.3748/wjg.v24.i47.5338


